Wow, those cart abandonment rates can really make your heart skip a beat!
I completely understand how frustrating this situation can be. But don’t fret! The first step in tackling this issue is to roll up your sleeves and do a little research.
You’ll gain a crystal-clear understanding of the cart abandonment issue by exploring how it varies across industries and regions. By identifying the top reasons behind it and uncovering proven strategies to counteract it, you’ll be well-equipped to tackle the challenge head-on. This insight will guide you in the right direction to improve conversion rates.
In this blog, I’ve compiled 27 shopping cart abandonment statistics that showcase stats on various sectors and regions, the reasons carts are left behind, and methods to combat this challenge.
So, without further ado, let’s dive right in!

Cart abandonment rate statistics across industries
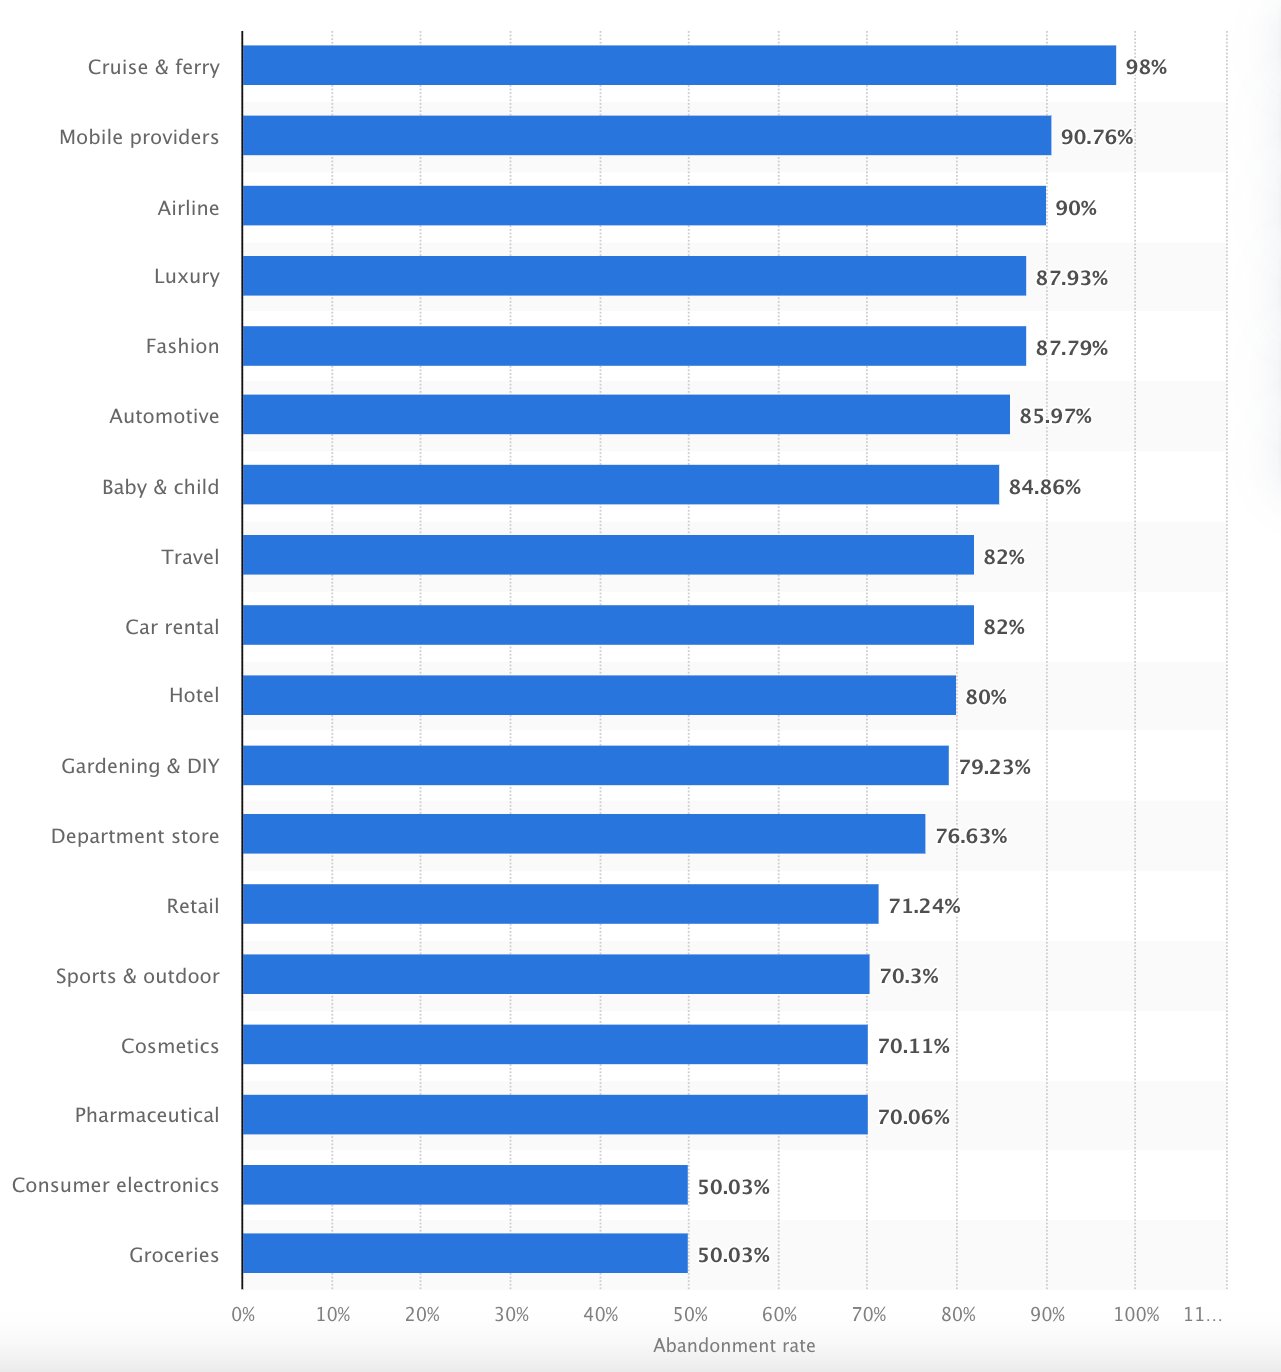
1. The grocery sector has the lowest cart abandonment at 50.03%
The low cart abandonment rate in grocery shopping is mainly due to the high purchase intent of shoppers. Unlike other sectors, customers aren’t simply browsing—they are there to buy essential products they use daily. This practicality drives them to complete their transactions more consistently.
2. The retail sector has a cart abandonment rate of 71.24%
Cart abandonment in retail occurs for various reasons, including high shipping costs, lengthy checkout pages and processes, mandatory account creation, limited delivery and lack of enough payment methods, and unclear or inconvenient return policies.
3. The travel industry faces a significantly high cart abandonment rate of 82%.
The travel industry faces one of the highest cart abandonment rates, with most drop-offs occurring at the final stage of conversion. This is often due to brands not being transparent about costs. Other contributing factors include non-localized brand messaging, overly lengthy lead forms, and complex checkout processes.
4. Automotive industry has a cart abandonment rate of 85.97%
The automotive industry experiences high cart abandonment rates due to the complexity of the purchase process, hefty price tags, and concerns surrounding financing and delivery options. These factors often lead potential buyers to abandon their carts before completing the purchase.
5. The fashion industry sees an exceptionally high cart abandonment rate of 87.79%
The high abandonment rate in fashion can largely be attributed to visitors who browse without intent to purchase. Also, window shopping is a common behavior in this industry, making it challenging to convert casual visitors into buyers.
6. Cruise and ferry sector faces the highest cart abandonment rate at 98%
The cruise and ferry sector faces unique challenges that contribute to high cart abandonment rates. Factors such as geopolitical situations, unpredictable weather conditions, high costs, and significant time investment discourage customers from completing their bookings. These complexities make it one of the industries with the highest rates of cart abandonment.
The above statistics come from research conducted by Statista in collaboration with SaleCycle. Below is an infographic from Statista that highlights cart abandonment rates across sectors.
Abandoned cart statistics across regions
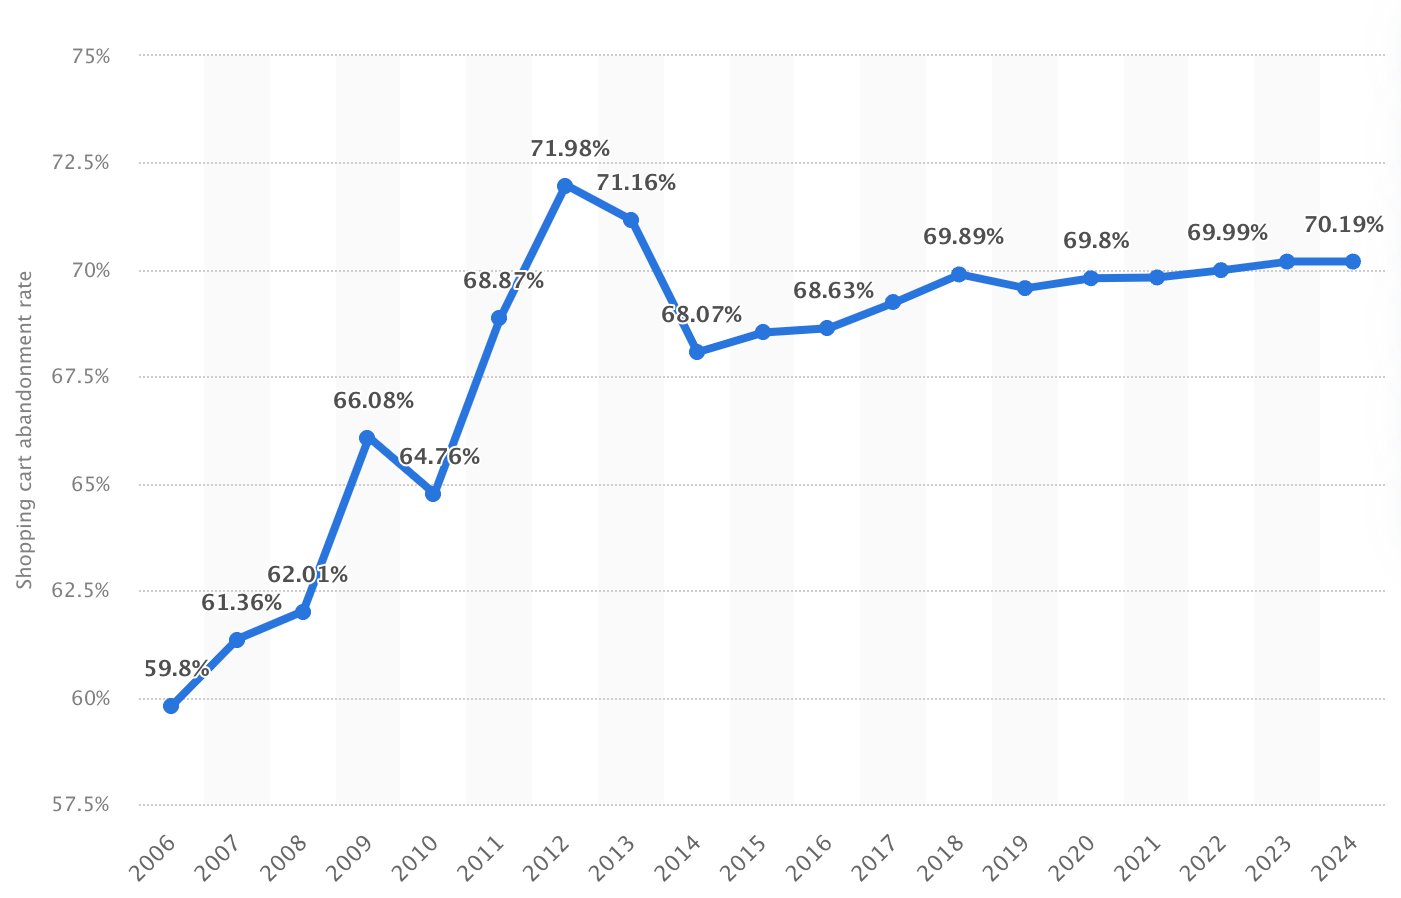
7. The global online shopping cart abandonment rate for 2024 stands at 70.19%
(Source: Statista.com)
Cart abandonment rates have been on the rise since 2014, driven by several factors. These include growing competition, increasing customer expectations, shifting online behavior, and surprise costs at checkout. Below is a graph illustrating the trend of shopping cart abandonment over the years.
8. Asia reports one of the world’s highest cart abandonment rates, reaching 84%
(Source: IBS Intelligence)
Asia has one of the highest shopping cart abandonment rates, shaped by multiple issues.
According to DHL’s Global Online Shopper Survey 2023, 92% of respondents from India and 87% from Thailand cited sustainability concerns as a reason for abandoning carts. Brands lacking in sustainability often face higher abandonment rates.
Additionally, 45% of respondents from China prefer flexible delivery options, such as leaving parcels with neighbors or in safe spots, which are often unavailable. Other key contributors include the expectation of free returns and free delivery.
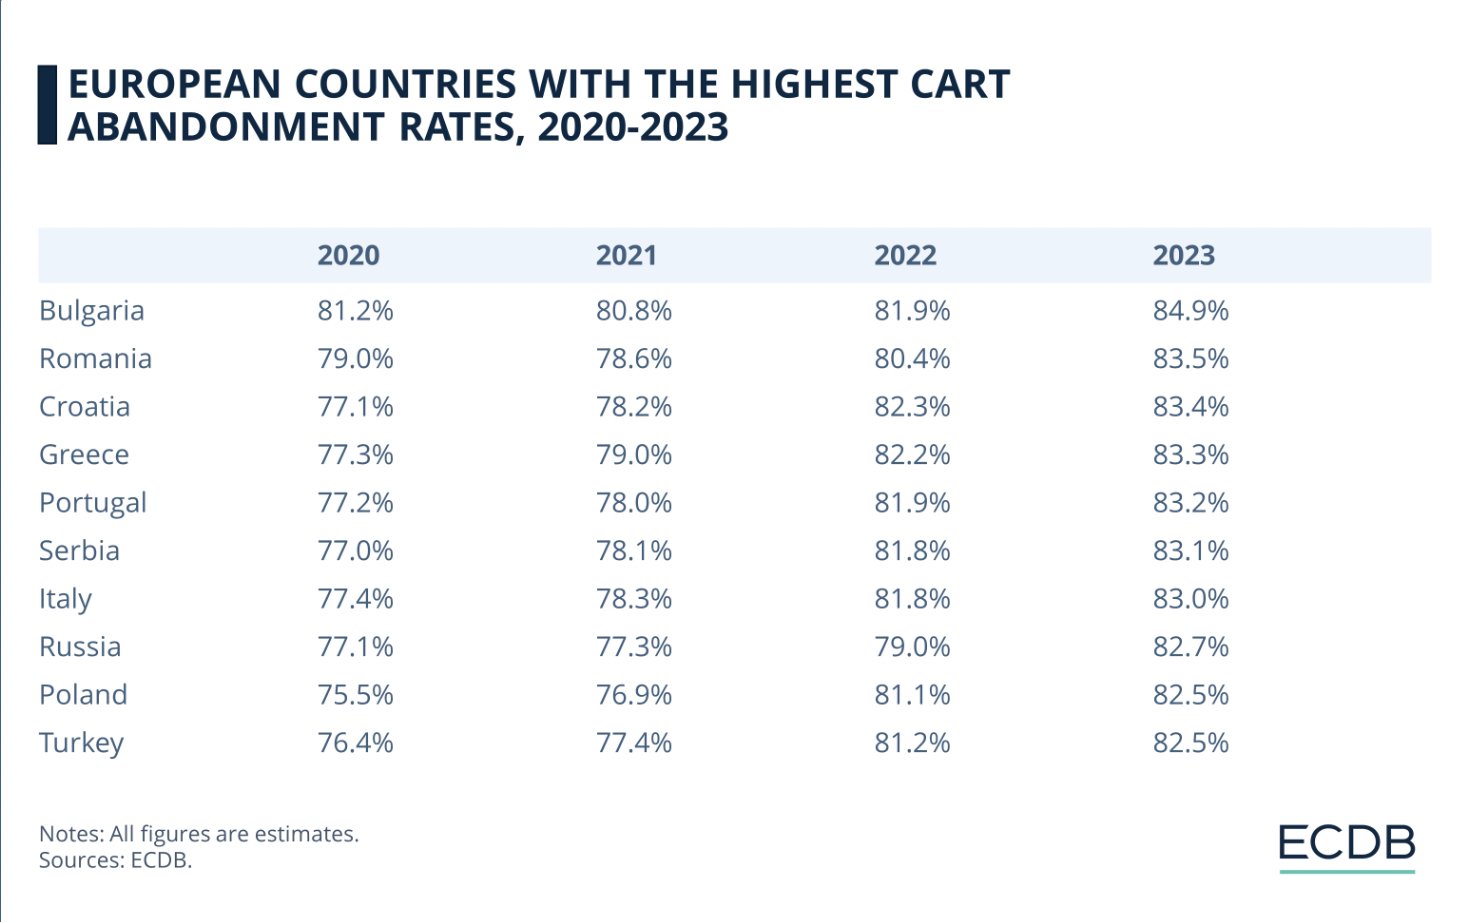
9. Europe’s average shopping cart abandonment rate reaches 80%
(Source: ecommercedb.com)
Cart abandonment rates in Europe have been steadily rising, with Bulgaria leading the pack. Key reasons include high shipping costs, slow website load times, and limited payment options. Additionally, requiring customers to create an account before purchasing and insufficient delivery choices contribute to the growing abandonment rates.
Here’s a quick snapshot of the European countries with the highest cart abandonment rates from 2020 to 2023.
10. Online shopping cart abandonment rate in North America stands at 79.14%
(Source: Salescycle.com)
In the U.S., part of North America, high shipping costs top the list of reasons for cart abandonment. Other significant factors include slow delivery, the need to create an account, and concerns over sharing credit card information. On the flip side, the lack of delivery options and the decline in credit card use contribute the least to abandonment rates.
11. The average cart abandonment rate in Latin America is 83.43%
(Source: Statista)
Cart abandonment is on the rise in Latin America. The primary causes include the limited availability of multiple payment options and the inconvenience of being required to pay in foreign currencies.
12. Africa’s shopping cart abandonment rate is 85.15%
(Source: Salescycle.com)
Africa has the second-highest shopping cart abandonment rate globally. Two key factors driving this trend are inconvenient payment methods and long delivery waiting times, both of which deter customers from completing their purchases.
13. 88% of shoppers in Australia abandon items in online carts
(Source: CouriersPlease)
Australia’s eCommerce businesses are grappling with a significant cart abandonment issue, leading to an annual loss of $18 billion in sales revenue. A major factor behind this is high shipping costs, which account for 63% of cart abandonment cases, leading many buyers to rethink their decision to buy.
Statistics for reasons behind abandoned shopping carts
14. 55% of people will leave their carts if asked to re-enter credit card details
(Source: interakt.shop)
Re-entering card details repeatedly adds unnecessary friction to the checkout process, making visitors wary of inputting sensitive information multiple times. This is especially true for mobile shoppers, where filling out numerous fields on a smaller screen becomes even more frustrating. This inconvenience often leads to cart abandonment. Thus, businesses must ensure that the payment gateway experience is smooth with less need to fill multiple fields.
15. 90% of shoppers say a smooth checkout is a make-or-break experience.
(Source: PYMNTS)
A smooth checkout experience can make or break a sale. Let’s take a look at its significance through an example.
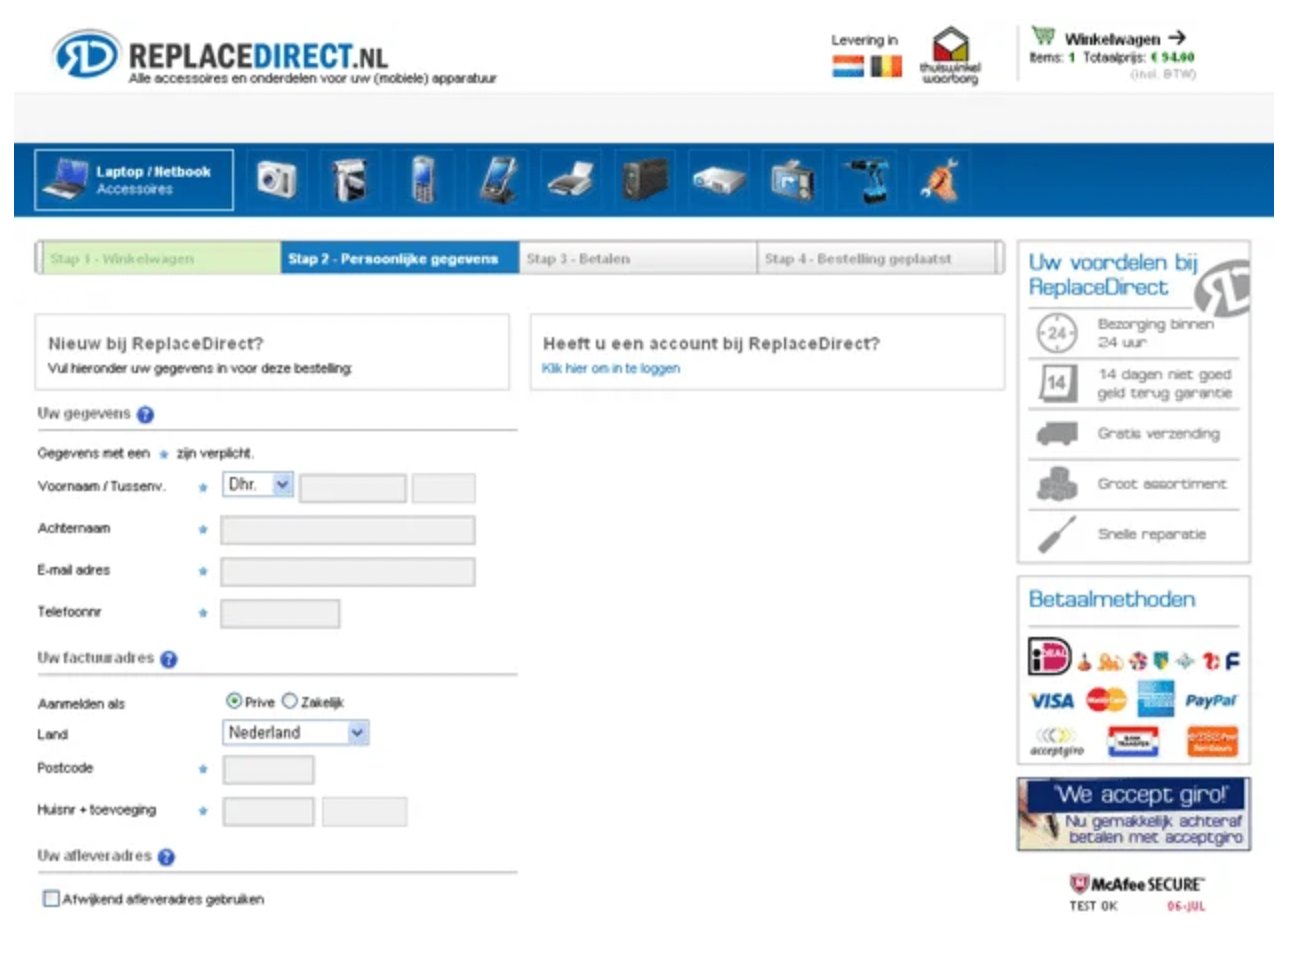
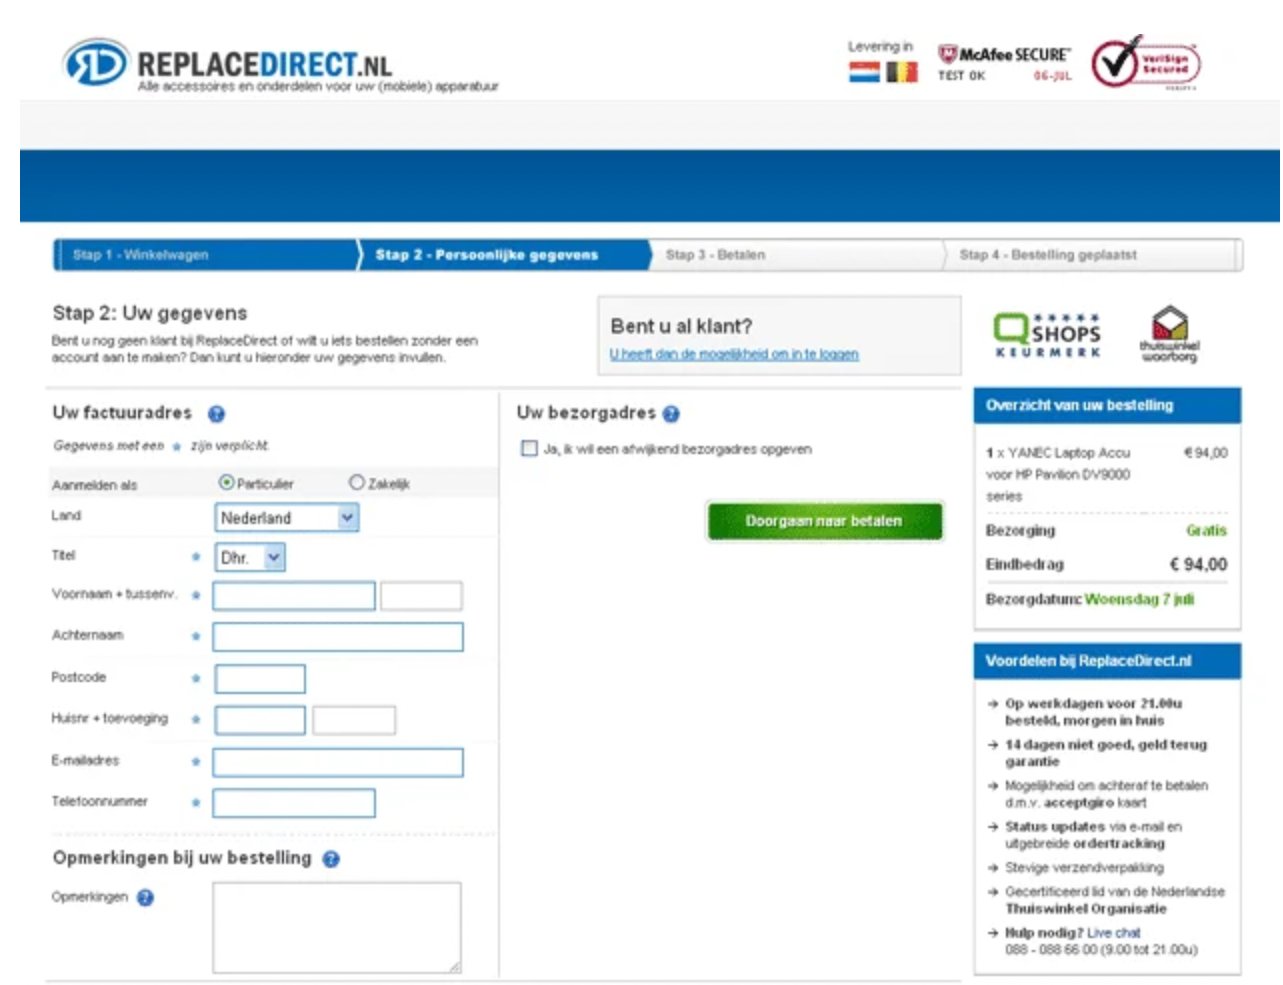
ReplaceDirect, one of the largest online retailers of replacement parts for electronics in the Netherlands, had problems with its checkout process. The company decided to optimize its checkout process through A/B testing.
The original checkout process had too many form fields and lacked a clear cart summary. Below is a screenshot of the old process.
To improve the experience, ReplaceDirect A/B tested a new version with VWO that included:
- An order summary with product details
- Total costs
- Delivery date
- Key benefits are highlighted at each step of the checkout process.
Here’s a look at the variation.
The results? The variation reduced the cart abandonment rate by 25%. This highlights how building a smooth and seamless checkout process can impact conversion rates.
16. 48% of customers abandon their carts due to high extra costs, such as shipping fees, taxes, and other charges.
(Source: Baymard Institute)
Shoppers often face an unpleasant surprise when the total amount increases at checkout, after selecting a product based on its displayed price. They are typically reluctant to pay additional shipping costs, especially if the product price already fits their budget. Many customers now expect free shipping, and the added cost can lead them to abandon their purchases.
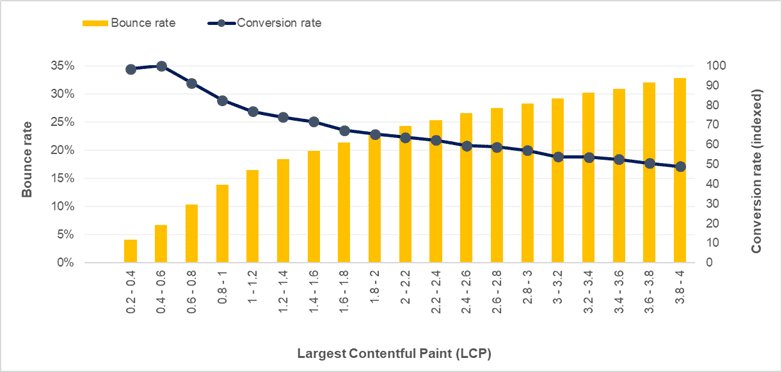
17. 30% of buyers abandoned their carts and bought from elsewhere due to slow website speed.
(Source: Yottaa)
Visitors have a short attention span, and slow website speed often leads to cart abandonment. Improving site speed is crucial for boosting conversions. Below is a graph illustrating the relationship between conversion rate and the Largest Contentful Paint (LCP). The data is based on a dataset of 10 million visits from 33 countries on Groupe Renault’s website. This highlights how faster load times can significantly impact conversion rates.
18. 53% of U.S. consumers say they typically abandon their carts and go elsewhere if there’s at least one item they can’t find on an eCommerce website.
(Source: Google Cloud)
This statistic highlights the critical importance of providing easy access to a search bar and offering a robust product recommendation engine. These features help visitors quickly find the products they’re looking for, reducing friction and improving the overall shopping experience.
19. 82% have abandoned an online purchase due to a negative user experience.
(Source: SurveyMonkey)
A staggering 82% is no small number! It’s crucial to understand what visitors are finding frustrating on your website. Identifying negative experiences is key to reducing friction and preventing drop-offs. You can run surveys or rely on behavior analytics to pinpoint what’s driving cart abandoners away.
Conduct a comprehensive behavior analysis with VWO Insights. It lets you track heatmaps, view session recordings, analyze form submissions, and run on-page surveys to help you uncover and resolve friction points.
20. 75% of Americans who abandon their online shopping carts do so because of cost and lack of coupons.
(Source: couponcabin.com)
Coupons and price drops are powerful motivators, offering customers the satisfaction of getting a great deal. However, it’s essential to strategically place coupons in the visitor’s journey. Displaying them on the product page gives immediate clarity on potential savings, enticing visitors to proceed with confidence. Holding off until later stages might lead to missed opportunities, especially for those just browsing, and could disrupt the natural flow of the buying process.
21. 53% of US online shoppers are prone to abandoning their carts if they cannot find swift answers to their questions.
(Source: Forrester)
To minimize cart abandonment for the reason mentioned, it’s essential to provide ample support throughout the buying journey. Adding features like FAQs, chatbots, or live chat can help address customer concerns instantly. Additionally, offering comprehensive product descriptions ensures customers have the information needed to make informed decisions, reducing the chances of them leaving mid-purchase.
Statistics on recovering abandoned carts
22. Personalization in the cart abandonment email campaigns reduces cart abandonment rates by 10%-30%.
(Source: Invesp)
Personalized communication can significantly increase the chances of conversion. This includes using a customer’s name in the salutation. It also involves sending hyper-targeted emails based on behavior, attributes, and purchase stage. These tailored messages are highly relevant to each individual, addressing specific friction points that may be preventing them from progressing in their buyer journey. By offering solutions to their unique concerns, personalization creates a smoother path to conversion.
23. 99% of consumers are likely to come back if a website has a good search function.
(Source: Google Cloud)
Investing in robust search engine functionality is crucial for reducing online cart abandonment. When choosing a search tool, prioritize features like personalization and integration capabilities. These not only enhance the user experience but also significantly reduce shopping cart abandonment by helping visitors find exactly what they’re looking for more efficiently.
24. With retargeting, 26 percent of shoppers will return to complete their purchases. Without retargeting, only 8 percent will return.
(Source: TEGNA Inc.)
Retargeting through page experience, paid ads, and email campaigns can be a powerful strategy to convert hesitant visitors. It serves as a gentle reminder, encouraging them to complete their purchase. Pairing retargeting efforts with limited-time offers can further drive urgency, boosting conversions and reducing cart abandonment.
25. Product recommendation pop-ups can reduce cart abandonment by 17%.
(Source: Frizbit)
Product recommendation pop-ups that display bestsellers, related items, or previously abandoned products can significantly enhance the visitor experience. Showing relevant products in context, rather than random suggestions, creates a personalized and engaging shopping journey, boosting the chances of conversion.
Statistics on losses from cart abandonment
26. eCommerce stores in the US and EU lose $260 billion in recoverable sales revenue each year because of cart abandonment.
(Source: Baymard Institute)
Improving checkout flow designs and user experience in online stores can boost conversions by an impressive 35.26% on average. Considering that eCommerce sales in this region total $738 billion, this enhancement translates to a staggering $260 billion in recoverable sales revenue each year.
Note: You can create a better checkout flow with the help of A/B testing. When it comes to A/B testing, VWO is a leader in the field, and you can start using VWO for free. Check out what you can achieve with the VWO free trial!
27. On average, eight carts are abandoned within a month.
(Source: PYMNTS)
The average eCommerce cart value in the US is $151.07, with an alarming average of eight carts abandoned per user. This results in a substantial monthly loss in the four-figure range for businesses, highlighting the critical importance of effectively addressing cart abandonment.
Wrapping up
The above statistics highlight that cart abandonment rates are highest in the cruise and ferry sector, while the grocery sector sees the lowest rates. Key culprits for abandonment include a complicated checkout process and unexpected shipping costs. To tackle this, businesses should focus on personalization, retargeting, and A/B testing to improve user experiences and minimize friction.
If you’re looking to invest in A/B testing and personalization, VWO is a top choice. Book a demo with VWO to discover how it can help you pinpoint friction points, run effective A/B tests, and craft personalized experiences, ultimately reducing cart abandonment and increasing conversions.
Categories:


![20 Best Shopping Cart Abandonment Tools in 2026 [Expert-Reviewed Solutions]](https://static.wingify.com/gcp/uploads/sites/3/2025/02/Feature-image-20-Best-Shopping-Cart-Abandonment-Tools_-Reduce-Abandoned-Carts-Effectively.jpg?tr=h-600)