Conversion Rate Optimization Solutions for Revenue Growth
VWO’s end-to-end CRO platform helps brands understand visitor behavior, make observations, build a testing pipeline, execute the tests for statistical results, and engage through new-age channels.
Imagine you’re pouring water into a bucket, but the water level never seems to rise. You’d stop pouring and look for the holes, right?
The same problem exists in revenue funnels. Prospects enter at the top, but somewhere along the way, momentum is lost. Without clear visibility into where this happens, teams continue to add more volume without addressing what’s broken beneath the surface.
A sales funnel report is the diagnostic view that makes this visible. It shows how prospects move from initial interest to becoming customers, where drop-offs occur, and which stages contribute most to downstream results.
In this guide, we’ll walk through how to build sales funnel reports that expose friction across the funnel and make it easier for both sales and marketing teams to understand what’s working, what’s not, and where focused improvements can drive better outcomes.
What is a sales funnel report?
A sales funnel report is a visual representation that tracks how prospects move through the stages of the buying journey. It measures conversion rates between stages, highlights drop-off points, and provides insight into where sales funnel performance breaks down, helping teams improve conversion flow and connect funnel activity to revenue outcomes.
Benefits of using a sales funnel report
A sales funnel report is not just a performance dashboard. It acts as a shared operating view for both marketing and sales, helping teams understand how demand turns into revenue.
Without a funnel report, marketing often optimizes for activity (traffic, clicks, form fills) while sales focuses on outcomes (pipeline, deals, revenue). This disconnect makes it difficult to diagnose what’s actually working and where growth is being lost.
A well-built sales funnel report brings both teams onto the same page and unlocks the benefits that follow:
Aligns marketing and sales: It provides a “single source of truth.” When both teams review the same funnel report, they can align marketing and sales efforts, agree on the quality of leads, and determine if the “handoff” point needs adjustment. This alignment is essential for improving downstream performance and revenue outcomes.
Pinpoints friction and leaks: It highlights exactly where potential customers are “falling out” of the journey. If you see a 60% drop-off between viewing a pricing page and clicking “Start Free Trial,” you know exactly where to focus your optimization efforts.
Improves conversion rate optimization (CRO): By identifying high-friction stages, you can deploy targeted experiments. For instance, using VWO to run an A/B test on a high-drop-off sign-up form can directly increase the volume of leads passed to your sales reps/team.
Strengthens customer engagement: By mapping how prospects move through the funnel, teams can adapt messaging and experiences to user intent, leading to more relevant interactions and stronger long-term relationships.
Enables accurate revenue forecasting: When you know your historical conversion rates at each stage (e.g., 10% of demo requests eventually close), you can look at the top of your funnel and make accurate financial projections with far greater confidence.
Maximizes marketing ROI: By tracking leads from their source all the way to a closed deal, you can see which channels (Organic, LinkedIn, PPC) yield the highest-value customers. This helps reduce overall customer acquisition cost, allowing you to reallocate budget to the highest-performing streams.
Key elements of a sales funnel report
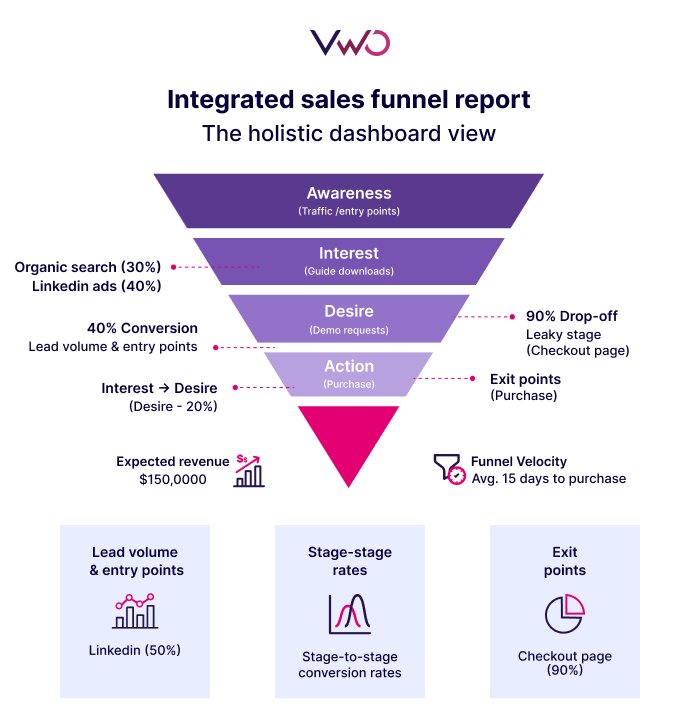
A truly actionable sales funnel report does more than list totals; it breaks down the customer journey into measurable segments that reveal the health of your pipeline and the effectiveness of your sales process, and the impact of ongoing marketing efforts. To get the full picture, your report should include these five essential elements:
Clearly defined funnel stages
Every report must start with a standardized map of the journey. For marketers, this often spans from Awareness (landing page visit) to Interest (newsletter sign-up), to Desire (adding to cart or requesting a demo), and finally Action (making a purchase). Without clear definitions, data becomes muddy and hard to act upon.
Stage-to-stage conversion rates
This is the “heartbeat” of your report. Rather than just looking at the final conversion, you track the percentage of users moving from one specific step to the next. High drop-offs between steps are immediate red flags that signify a need to adjust marketing strategies or better-targeted messaging.
Example: If 1,000 people visit your “Pricing” page but only 50 click “Start Trial,” your stage conversion rate is 5%. This 95% drop-off signals a need to optimize that specific page.
Funnel velocity
This metric measures the average time it takes for a prospect to move from the top of the funnel to the final conversion. If leads are stalling for weeks in the “Consideration” phase, it may indicate that your middle-of-the-funnel content isn’t persuasive enough or that there’s a technical friction point in the user journey.
Example: You might find it takes an average of 12 days for a lead to move from “Sign-up” to “Paid Customer.” If this jumps to 20 days, you know there’s a new friction point in your onboarding.
Lead volume & entry points
You need to know not just how many people are in your funnel, but where they are coming from. By tracking entry points, such as organic search, social media, or paid ads, you can identify which channels are feeding your most qualified leads into the marketing-led portion of the funnel.
Example: Your report might show that 60% of your SQLs (Sales Qualified Leads) enter through LinkedIn ads, while only 10% come from organic search, helping you decide where to double your budget.
Exit points and “leaky” stages
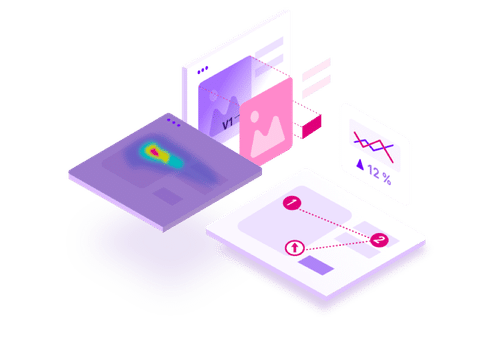
A great report explicitly identifies where users are leaving. In VWO Funnels, this is visualized as a step-by-step “leakage” map. Knowing exactly where the exit happens allows you to deploy tools like heatmaps or session recordings on that specific page to understand the “why” behind the exit.
Example: Through session recordings, you notice a “leak” where users drop off at the second page of a three-step registration form. By identifying this exit point, you can use VWO Testing to experiment with a single-page layout instead.
Sales funnel report examples
To provide a comprehensive view, sales funnel reporting should always be tailored to your business model. Let’s see, with the help of a real-world example, how different funnel reports work in practice.
The table below outlines a typical B2B SaaS funnel, showing how marketing-led engagement gradually progresses into a structured sales process, and ultimately, closed revenue.
Funnel stage
Primary goal
Key metric
Awareness
Attract the right persona
Website traffic/source attribution
Interest
Capture lead data
Visitor-to-lead conversion (e.g., guide downloads
Intent (MQL)
Identify high-intent prospects
Demo requests or pricing page visits
Evaluation (SQL)
Sales validation
Discovery call-to-opportunity ratio
Purchase
Close the deal
Win rate/average contract value
Conversion-focused reports (The efficiency view)
This report focuses on the “micro-conversions” between each step. It is designed to show how effectively you are moving people through the journey.
Key metric: Stage-to-stage conversion rate.
Best for: Identifying which specific page or touchpoint (like a landing page or a checkout screen) is underperforming.
Example: In the B2B SaaS model, this would track the conversion from a Guide Download (Interest) to a Demo Request (Intent). If this rate is low, your lead nurturing emails or demo landing page may need optimization.
Leakage-focused reports (The diagnostic view)
Think of this as the “drop-off” report. It highlights where prospects are abandoning the funnel entirely and never coming back.
Key metric: Abandonment rate / Exit points.
Best for: Pinpointing technical bugs, confusing UI, or high-friction form fields that act as “holes” in your bucket.
Example: In a B2B SaaS signup flow, if users abandon the funnel at the Business Email field during demo requests, you’ve found a leak. Step-level leakage visualization makes this immediately visible.
Revenue-focused reports (The financial view)
This report shifts the focus from “people” to “dollars” by tying marketing funnel metrics directly to pipeline value and identifying which activities are actually worth the investment.
Key metric: Expected revenue per stage / average order value (AOV).
Best for: Sales forecasting and prioritizing high-value leads. It helps marketing teams see not just which channels drive leads, but which channels drive the most profitable leads.
Example: By looking at the Win Rate and Average Contract Value (ACV) in the table above, marketing teams can calculate the “Pipeline Value” generated by each campaign, even before deals close.
How VWO supports and enriches sales funnel reports
The quality of your sales pipeline is shaped long before deals are discussed. By optimizing marketing-led funnel stages, such as sign-ups, demo requests, bookings, and purchases, VWO helps reduce low-intent leads, increase the flow of qualified opportunities, and drive revenue growth through better experiences rather than simply more traffic.
Discover exactly where users drop off
VWO funnels add the qualitative context needed to uncover the real causes behind funnel friction.
You can clearly see the paths visitors take through your website and identify exactly where they stop progressing, whether that’s during sign-up, demo requests, checkout, or bookings.
By integrating these insights into an inbound marketing funnel report, teams can move from passively observing data to actively improving marketing-led funnel performance.
Get deeper insights with sophisticated segments
Advanced segmentation helps you filter funnel reports by device type, query parameters, traffic sources, or custom events.
This allows you to compare how different audiences move through the same funnel, for example, mobile users versus desktop users, or paid campaign traffic versus organic, ensuring optimization efforts focus on the segments with the greatest impact on ROI.
Go beyond surface-level metrics like click-through rates or conversion rates, diving deeper into behavioral segmentation. These insights lead to a tailored strategy that significantly improves engagement across all segments.
To ensure insights don’t get lost, you can annotate visitor flows directly within funnel reports. Adding these “Observations” streamlines the creation of tailored optimization strategies, making it easier to share data-backed hypotheses across your marketing and sales teams.
Visualize drop-offs with integrated behavior analytics
Once a leak is identified, the next question is why it’s happening.
VWO connects funnel insights directly with heatmaps and session recordings, so investigation happens in context:
Heatmaps show aggregated interaction patterns: where visitors click, scroll, or ignore, highlighting what captures attention and what gets overlooked.
Session recordings let you watch how individuals navigate your pages, capturing clicks, scrolls, mouse movements, and hesitation that quantitative charts alone can’t reveal
This helps visually confirm what’s blocking progress, whether it’s unclear copy, hidden CTAs, form friction, or technical issues.
Pro Tip!
Use VWO Copilot to automatically analyze heatmaps and session recordings, reducing manual effort and uncovering actionable insights faster.
Run data-backed experiments and personalization
Once bottlenecks are identified and documented, teams can move directly into action.
You can use the insights to form data-backed hypotheses and use VWO Testing to run A/B tests or multivariate tests on the high-friction areas identified in your funnel report.
Funnel data shows heavy abandonment on a demo request page
Heatmaps reveal the CTA isn’t prominent
Session recordings show confusion around form fields
Together, these insights point to a focused experiment, such as testing a stronger CTA or simplifying the form flow.
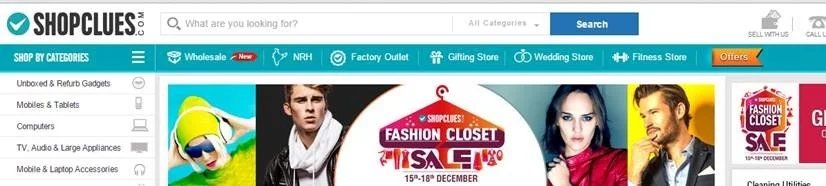
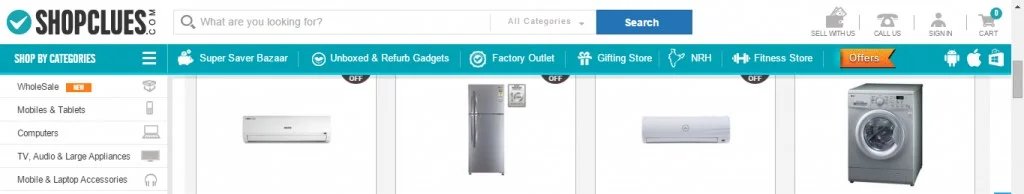
ShopClues, one of India’s leading eCommerce platforms, achieved a 26% increase in visits-to-order from the homepage and a 48% increase from category pages with the help of VWO. Small but targeted design changes, such as restructuring the main navigation and surfacing high-interest products earlier, proved that improving user experience at early touchpoints can significantly lift revenue without increasing traffic.
Control
Variation
Beyond testing, VWO Personalize allows teams to tailor experiences based on funnel behavior:
For instance:
Users who visit pricing multiple times but don’t convert can be shown targeted messages or offers.
Visitors who drop off at a specific funnel stage can be offered timely, tailored nudges to reduce friction.
These personalized interventions help move prospects forward before they enter the sales pipeline, improving both conversion rates and opportunity quality.
Request a demo and see how VWO supports data-backed optimization.
Everything achieved with VWO strengthens the sales funnel and improves the quality of leads entering the sales pipeline. The report becomes the system of record for tracking how prospects move through each stage across inbound channels and the outbound marketing funnel, and which of them ultimately become customers.
With this visibility, teams can see which funnel stages, acquisition paths, and marketing campaigns contribute most to downstream revenue, making it easier to connect optimization efforts to business outcomes.
FAQs
Q1. What is a sales funnel report?
A sales funnel report analyzes how users progress through each funnel stage, showing volumes, conversion rates, drop-offs, and timing to identify friction and optimization opportunities.
Q2. How to create a funnel report?
To create a funnel report:
– Define clear funnel stages – Track user actions at each stage – Measure conversion and drop-off rates – Segment by audience or channel – Analyze bottlenecks and test improvements
Q3. What are the 5 stages of the sales funnel?
Common sales funnel stages include: – Awareness – Interest – Intent – Evaluation – Purchase These stages can be adapted based on the business model and sales cycle.
Q4. What is a sales funnel analysis?
Sales funnel analysis is the process of evaluating funnel performance to understand where users hesitate, abandon, or convert, helping teams improve efficiency, lead quality, and revenue outcomes.
Q5. What is the difference between a sales pipeline and a sales funnel?
A sales funnel focuses on the buyer’s journey and conversion rates between stages, while a sales pipeline tracks deals from the seller’s perspective, emphasizing deal progress, value, and close probability.
Q6. Why are sales funnels important?
Sales funnels help teams understand where prospects drop off, how efficiently they move forward, and which stages need optimization, making it easier to improve conversions and revenue predictably.
I'm a branding enthusiast, marketer, and B2B content professional with over 20 years of experience. I'm also a certified native advertising expert and trained in strategic thinking. Author of 'Managing Modern Brands: Cult Theory and Psychology', and three other books in diverse genres. I generally write on marketing trends, optimization, brand strategy, consumer psychology, CRO, cult theory, data, personalization, and content strategy. With a strong expertise in building and leading teams and cross-functional collaboration, I have driven demand through content creation, data, digital media, content marketing, and technology.
Uncover hidden visitor insights to improve their website journey
One of our representatives will get in touch with you shortly.
Awesome! Your meeting is confirmed for at
Thank you, for sharing your details.
, you're all set to experience the VWO demo.
I can't wait to meet you on at
Account Executive
, thank you for sharing the details. Your dedicated VWO representative, will be in touch shortly to set up a time for this demo.
We're satisfied and glad we picked VWO. We're getting the ROI from our experiments.
Christoffer Kjellberg
CRO Manager
VWO has been so helpful in our optimization efforts. Testing opportunities are endless and it has allowed us to easily identify, set up, and run multiple tests at a time.
Elizabeth Levitan
Digital Optimization Specialist
As the project manager for our experimentation process, I love how the functionality of VWO allows us to get up and going quickly but also gives us the flexibility to be more complex with our testing.
Tara Rowe
Marketing Technology Manager
You don't need a website development background to make VWO work for you. The VWO support team is amazing
Elizabeth Romanski
Consumer Marketing & Analytics Manager