Website User Tracking: How to Track User Activity for Better Insights
You may know where your website traffic comes from, but do you know what happens after it arrives?
Sure, Google drives over 63% of all referral traffic across the web, making it the top traffic source for most websites. But high traffic means nothing if you don’t understand how visitors behave once they land. Where do they click? What draws their attention? What makes them drop off?
That’s the gap that website user tracking fills.
Just like a store owner observes customer behavior to improve layouts and boost sales, tracking user activity on your site helps you uncover friction points, optimize journeys, and make smarter, data-backed decisions.
In this guide, we’ll explore how to track user activity on your website using both traditional and behavioral analytics, so you can move beyond surface-level stats and start seeing your site the way your visitors do.
Let’s turn your traffic into insight, and your insight into impact.
What is website user tracking?
Website user tracking refers to the process of monitoring and analyzing how users interact with a website. It involves collecting sensitive data points such as page views, clicks, time spent on site, navigation paths, scroll depth, form submissions, and more.
At its core, user tracking aims to answer one vital question:
What do users do once they land on your site?
The goal? To understand user intent, enhance user experience (UX), optimize website performance, and ultimately achieve business objectives.
Common Elements Tracked Include:
- Pages viewed
- Clicks and taps
- Mouse movements and hovers
- Scroll depth
- Form interactions (fills, drop-offs)
- Session duration
- Navigation paths
- Device and browser usage
Benefits of website user tracking
Let’s imagine you run an online home décor store. Despite having a visually appealing site and decent traffic from your marketing campaigns, conversions remain inconsistent. What’s missing? Along with knowing who’s visiting your website, it’s just as important to understand what they’re doing once they arrive. That’s where real optimization begins, at the intersection of audience and action.
You decide to implement website user tracking, and suddenly, everything becomes clearer.
Here’s how tracking user activity on your website reveals opportunities across every layer of your business:
Improved user experience (UX)
By observing how visitors interact with your site, which sections they explore, where they get stuck, and how they move between pages, you can uncover friction points that aren’t always obvious.
For example, you might learn that users are dropping off from your category page because the filters are confusing or hidden. A simple UX tweak can instantly reduce bounce rates and help more visitors discover your products.
Conversion rate optimization (CRO)
Sometimes the biggest conversion killers are subtle: a misaligned button, a broken form field on mobile, or a vague call-to-action. User tracking reveals these small yet critical issues by showing exactly where users hesitate or exit.
In our store scenario, session recordings might reveal that users are getting stuck trying to apply a discount code on mobile. Resolving this single issue can lead to a measurable increase in completed purchases.
Personalization and retargeting
Not all users behave the same. Some may frequently browse Scandinavian lighting; others may prefer minimal furniture. By tracking browsing and interaction patterns, you can segment users more effectively and deliver personalized product recommendations or retargeted ads. This turns passive interest into meaningful engagement, and often, into repeat purchases.
Content effectiveness
Your store’s blog features articles like “Top 5 Living Room Layout Ideas” or “Choosing the Right Pendant Light.” You notice these pages bring in organic traffic, but users rarely browse products afterward. With scroll depth and session duration tracking, you find that most readers drop off halfway.
By restructuring your articles, adding visual inspiration mid-way, and product links within the content, you keep users engaged and lead them toward relevant product pages, turning content from a passive asset into a conversion tool.
Smarter product decisions
Let’s say you launch a “Room Visualizer” tool on your website, but adoption is low. Rather than assuming it’s a failed feature, tracking may show that users aren’t even noticing it because of poor placement.
Moving it above the fold or integrating it within product pages might be all it takes to boost usage, and suddenly, it becomes a key driver of engagement.
Bug and glitch detection
Not all visitors will report bugs; most will simply leave. Website tracking can help you identify abnormal drop-offs or error-triggering actions. For instance, if Safari users are abandoning your cart page disproportionately, it could point to a browser-specific script issue. By detecting and resolving such issues early, you protect both revenue and brand trust.
More effective marketing campaigns
You’ve been running Instagram ads promoting a curated collection of boho-style rugs. While the ad gets a good number of clicks, sales from this campaign are underwhelming. User tracking reveals that visitors land on a generic homepage with no direct connection to the rug collection.
You create a dedicated landing page featuring the exact products shown in the ad. Post-launch, you see a sharp drop in bounce rate and a significant increase in purchases from ad traffic.
Consent optimization and data integrity
Some users visiting your store from Europe decline cookies, limiting your ability to analyze their behavior or retarget them with offers. By tracking how users interact with your cookie banner, you notice that many ignore or close it without reading.
You revise the design and messaging, highlighting benefits like personalized recommendations or saved preferences. As a result, more users opt in, allowing you to collect richer behavioral insights while maintaining transparency and compliance.
By using website user interaction tracking methods strategically, you go beyond surface-level analytics and dive into the why behind user actions. It’s not just about tracking user behavior; it’s about understanding it, responding to it, and creating an experience users enjoy.
Different ways websites track user activity
Tracking user activity with traditional analytics
Traditional analytics tools, like Google Analytics, Adobe Analytics, and Mixpanel, focus on the customer journey from a macro perspective. They help collect sensitive data about user traffic, acquisition, and goal completions. What paths users follow across sessions and channels, and how they eventually convert (or don’t).
Explore this curated list of top digital analytics tools to find the right fit for tracking your customer journey more effectively.
This method is ideal for tracking high-level performance metrics like:
- Where does your traffic come from
- Which pages or campaigns drive conversions
- How different segments behave over time
Here are the key features, explained more clearly:
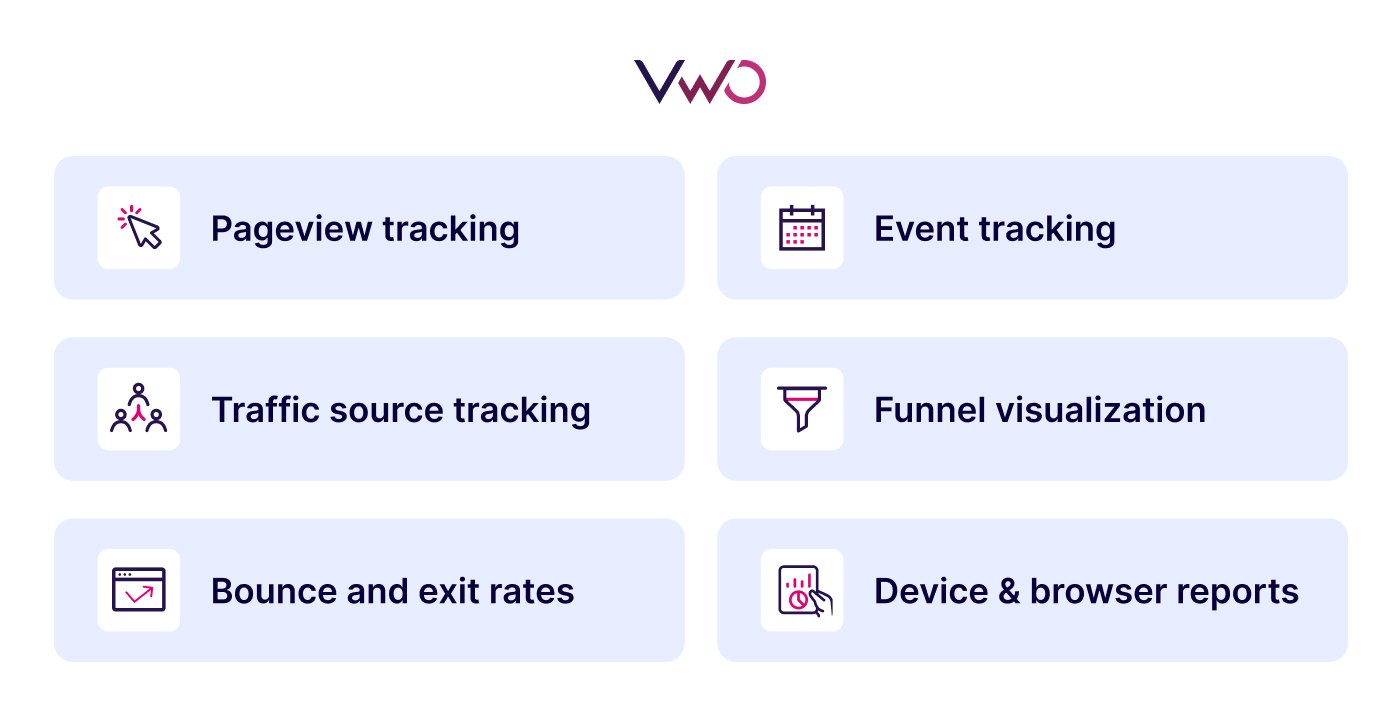
Pageview tracking
This shows which pages users visit and how often, helping you understand which content is popular, underperforming, or acting as entry or exit points. It gives a baseline view of what’s being seen.
Traffic source tracking
Tracks where users are coming from, such as search engines, social media, paid ads, or referral sites. This helps evaluate which marketing channels are driving the most valuable traffic.
Bounce and exit rates
Bounce rate indicates users who leave after visiting only one page, while exit rate shows which page was the last visited in a session. These metrics help you spot weak spots in the customer journey.
Event tracking
Captures specific actions like button clicks, video plays, form submissions, or file downloads. You can set these up manually using Google Tag Manager or programmatically for deeper insights into user engagement.
Funnel visualization
Shows the step-by-step path users take through key flows, such as a checkout or signup process. It helps identify where users drop off and which steps need optimization.
Device and browser reports
Breaks down user activity by device type, operating system, and browser. Useful for ensuring your site works smoothly across all platforms and for spotting issues tied to specific tech environments.
These tools offer structured, high-level insights that are great for understanding overall performance, identifying top-converting channels, and evaluating marketing ROI.
Tracking user activity with behavior analytics
Behavior analytics tools, such as VWO Insights, zoom in on the user journey, offering a micro-level view of how users interact with your website during a session.
Instead of showing how they got there, these tools show what they did once they arrived, where they clicked, how far they scrolled, what they ignored, or where they got stuck.
This approach is perfect for uncovering:
- User friction
- Confusing layouts
- Missed CTAs
- UX bugs
- Emotional cues like frustration or drop-offs
Key features include:
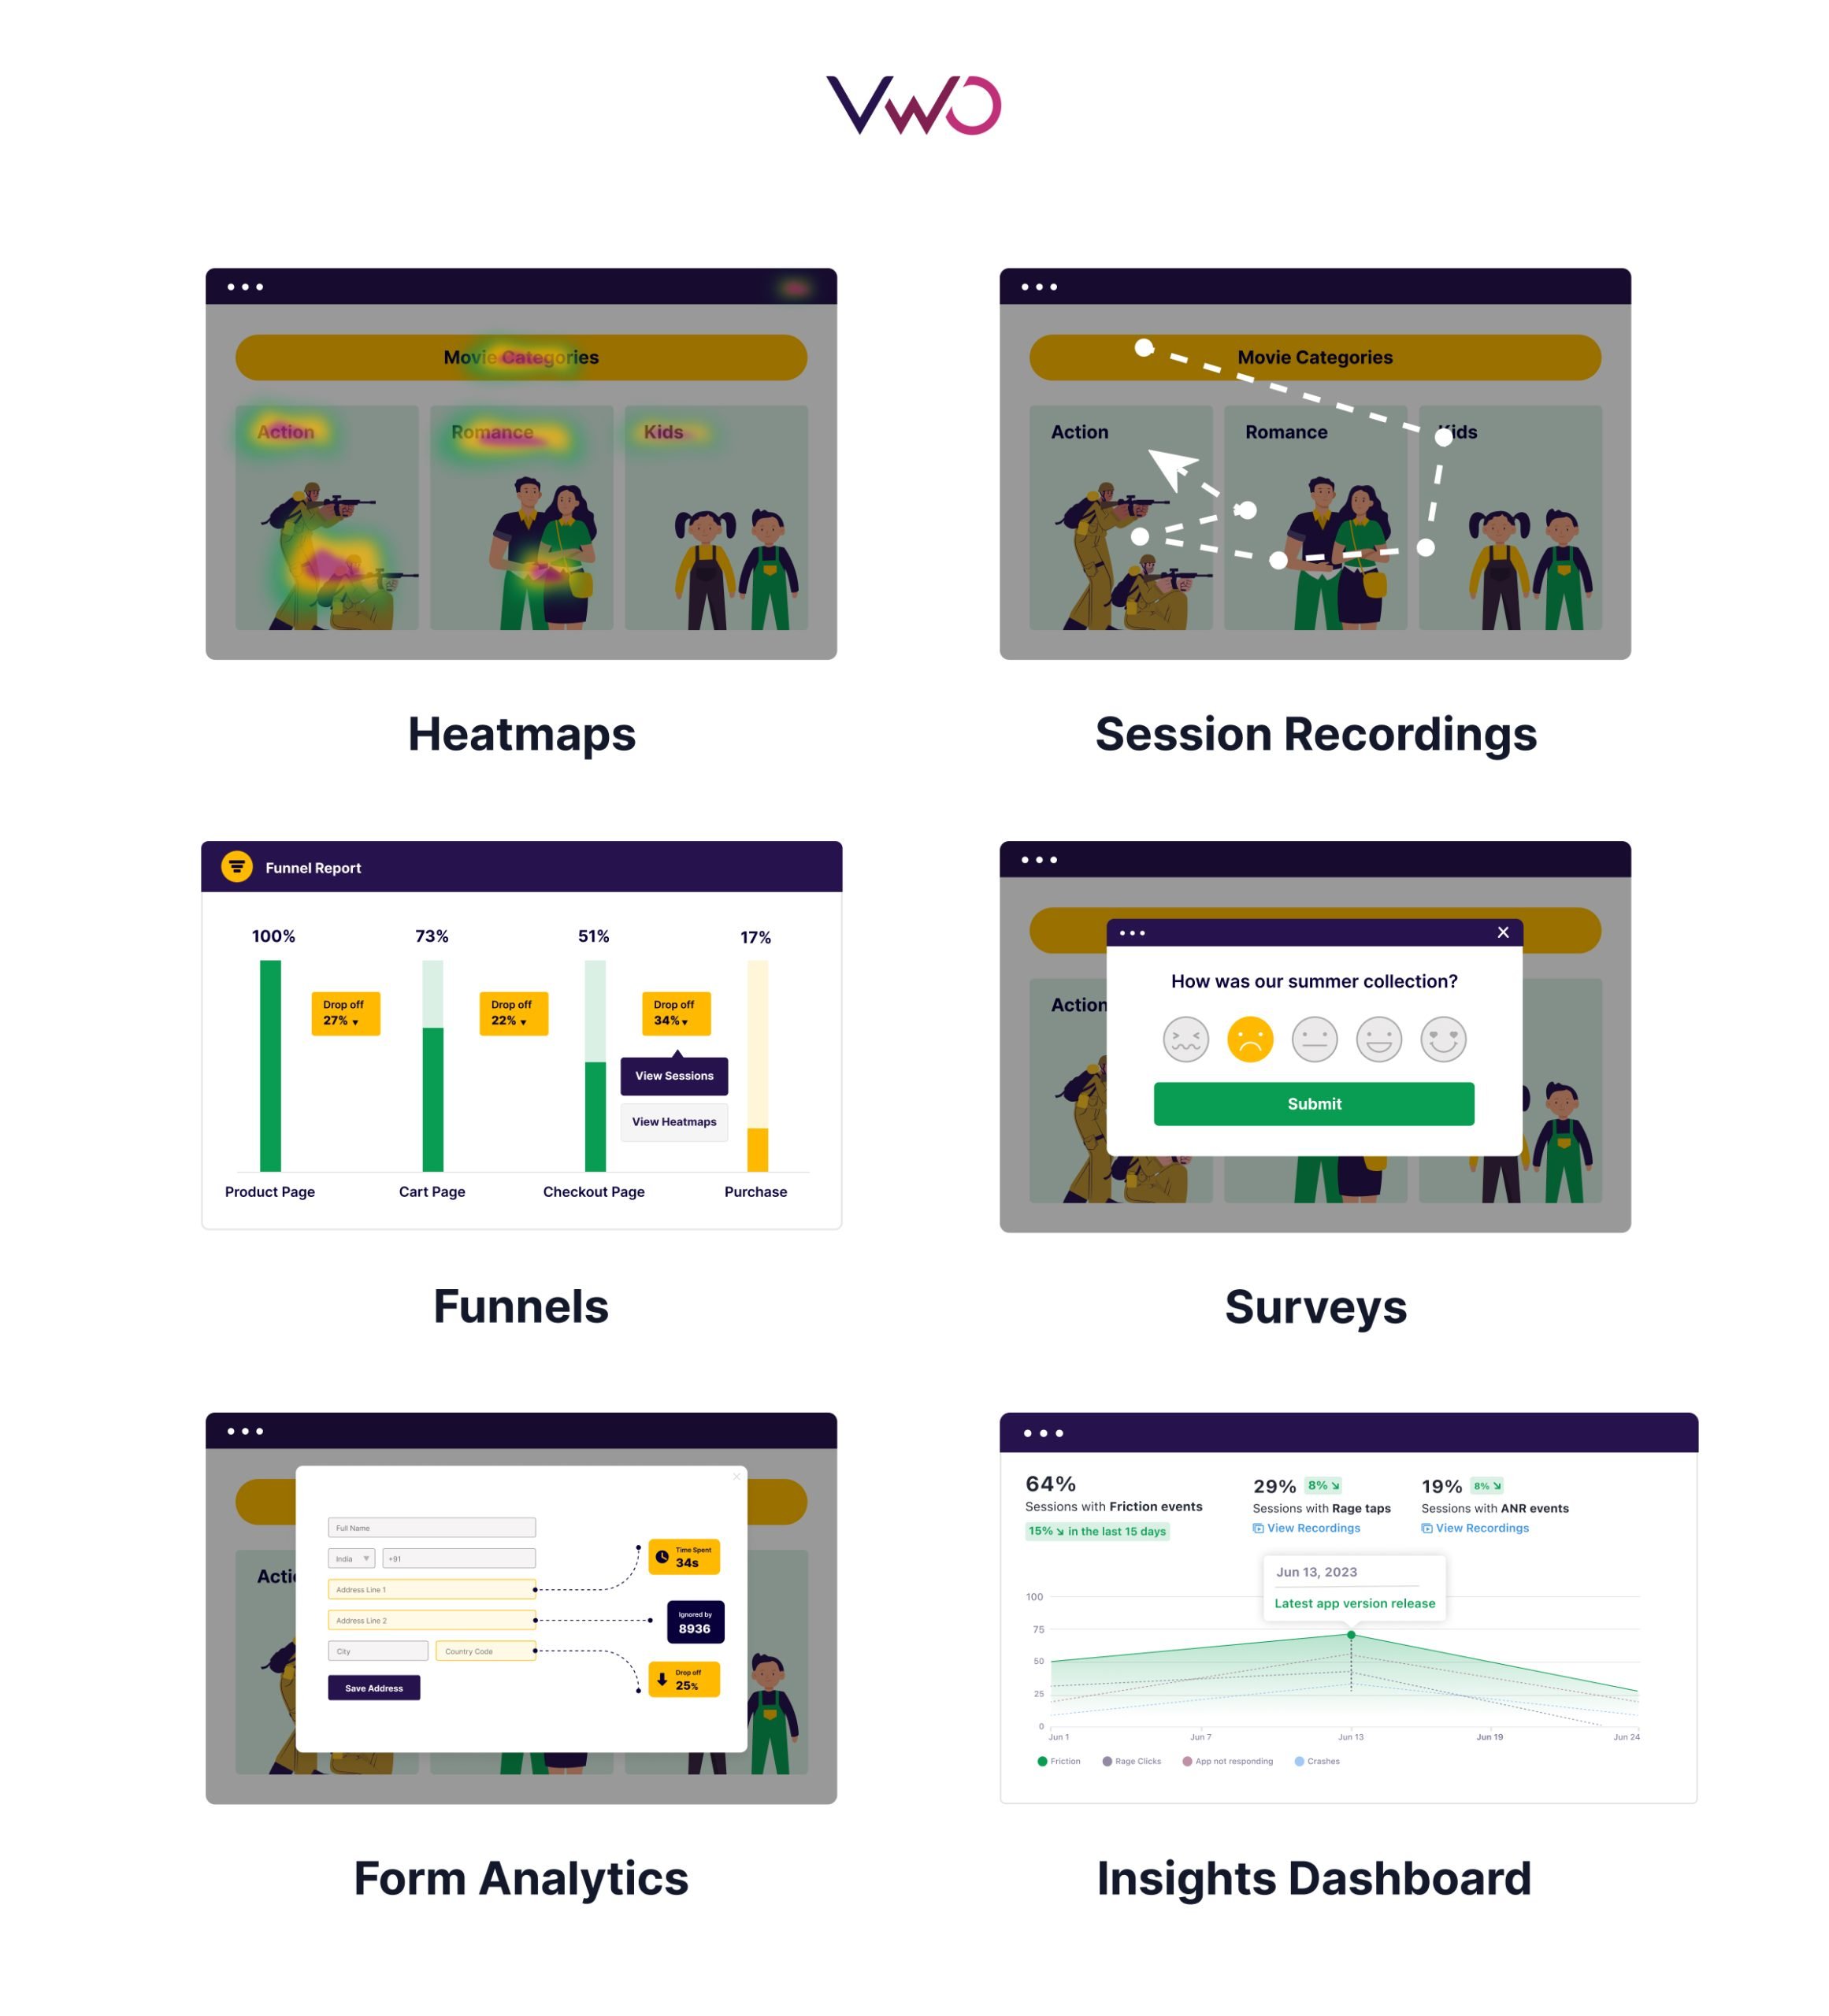
Heatmaps
Heatmaps provide a color-coded visualization of where users click, tap, or move their mouse most frequently. This helps you instantly identify high-attention areas, ignored sections, and misplaced elements on any page.
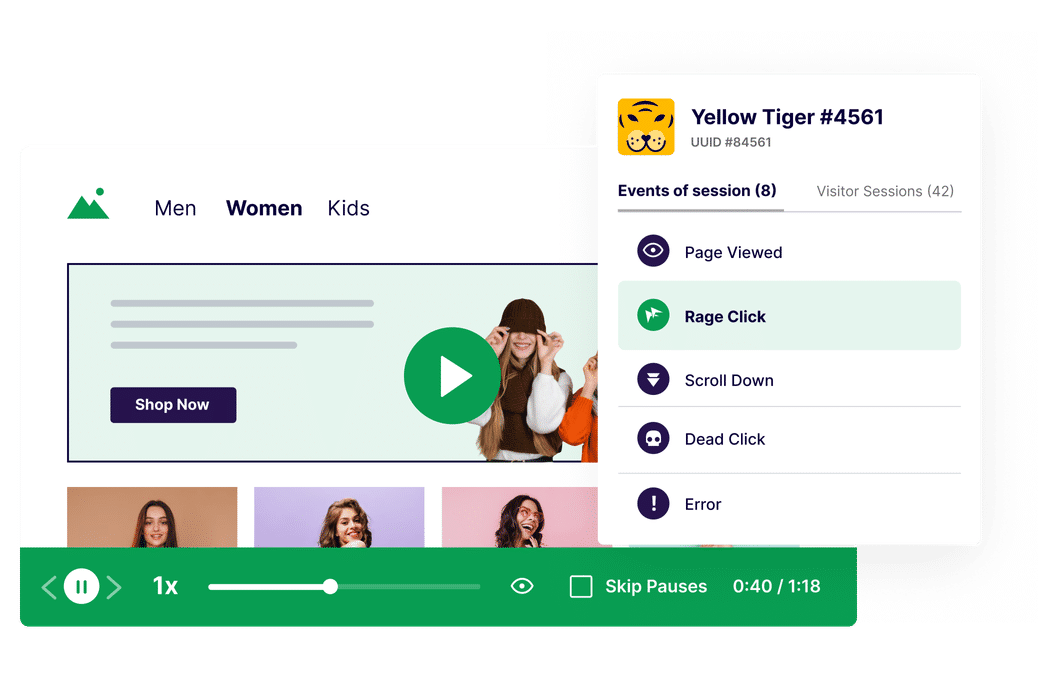
Session recordings
Session replays let you watch real-time visitor journeys, including every scroll, click, and pause, as if you’re looking over their shoulder. It’s a powerful way to spot hesitation, confusion, or technical issues that analytics numbers alone can’t explain.
Scroll depth tracking
This feature shows how far down users scroll on a page, revealing whether they’re seeing key content like CTAs, pricing, or product descriptions. It’s especially useful for optimizing long pages or landing pages.
Form analytics
Form tracking reveals which fields cause users to hesitate, drop off, or make errors. You can see where users abandon forms and optimize those areas to improve conversions and reduce friction.
Rage click detection
When users repeatedly click an element out of frustration or confusion, it’s logged as a rage click. This helps you identify broken buttons, non-responsive elements, or misleading links that frustrate users.
Each of these features adds a qualitative layer to your analytics stack, helping you design experiences that are not just data-driven but user-informed.
How behavior analytics helps track user activity
Traditional analytics might tell you that users dropped off on a certain page or never completed a form, but it won’t explain why. That’s where behavior analytics comes in, offering a deeper, more visual lens into the user experience.
With tools like VWO Insights – Web, you can track not just what users do, but how they interact in real-time and use those observations to create faster, more effective optimizations across your website.
Heatmaps
One of the most accessible ways to begin analyzing user behavior is through heatmaps. They offer a visual breakdown of where users are clicking, how far they’re scrolling, and which parts of the page are drawing attention, or being ignored entirely.
With VWO’s heatmaps, you can easily identify underperforming CTAs, missed content sections, or misleading elements that may look clickable but aren’t. With heatmap comparison, you can instantly view two heatmaps side-by-side, perfectly aligned for synchronized scrolling and effortless visual analysis.
Whether you’re comparing control vs. variation from an A/B test or analyzing the same page across different audience segments, this feature removes guesswork and brings immediate clarity.
It also enables deeper insights by letting you compare user behavior across segments (like new vs. returning visitors) or devices (desktop vs. mobile), helping you spot interaction patterns, friction points, and optimization opportunities with precision.
Read our extensive blog to know more about VWO Heatmaps.
Session recordings: Data visualization
When surface-level metrics raise questions, session recordings provide the answers. Watching real user sessions helps you detect hidden friction, such as hesitation in navigation, dead clicks, or broken paths.
VWO’s session recordings allow you to view not just individual actions but the entire journey across segments, devices, and even returning sessions. For instance, you might spot users repeatedly hovering over a product menu but failing to click through, pointing to navigational confusion that isn’t captured in standard click reports.
Want to learn how to set up session recordings, read them effectively, and turn insights into action? Dive into our detailed guide for everything you need to know.
Use VWO Copilot for automated analysis of heatmaps and session recordings. The AI-powered assistant identifies interaction patterns, summarizes friction points, and recommends precise page optimizations, saving you from hours of manual playback or heatmap interpretation and letting you focus on high-impact improvements.
Behavior analytics also helps you capture emotional signals, moments of frustration that hint at underlying UX issues. With VWO, indicators like rage clicks, repeated interactions, or quick exits are flagged and quantified. You can then correlate these behaviors with specific page elements or visitor segments to prioritize what needs fixing first.
Funnels
For teams managing intricate journeys, onboarding, checkout, and lead capture, VWO Funnels shows exactly where users drop off at each step. Map every milestone, spot the stage losing the most visitors, and jump straight into the session recordings for that step to understand why. With drop-off metrics and behaviour replays side-by-side, you can tackle the precise friction points that block conversions.
On-page surveys
User feedback also plays a vital role in behavior tracking. VWO’s on-page surveys, powered by generative AI, make it easy to ask the right questions at the right time, whether it’s after a few minutes of inactivity or just before exit. The platform not only helps you deploy these surveys with tailored triggers but also summarizes responses intelligently, saving hours of manual analysis.
For instance, a team struggling with low engagement on a content-heavy site might use surveys to discover that users prefer more visual content. Acting on that insight could lead to a noticeable improvement in time-on-site.
Learn how to create, customize, and launch effective on-site surveys using VWO with our step-by-step guide.
Form analytics
Another layer of insight comes through form analytics. It’s not just about knowing that users abandon a form, but understanding which fields cause the most hesitation or confusion. VWO captures field-level behavior, highlights drop-off patterns, and surfaces mobile-specific issues. This is especially helpful when optimizing longer forms or sensitive input areas, such as financial applications or address fields.
Insights dashboard
To bring it all together, VWO’s Insights Dashboard gives you a unified view of performance across heatmaps, recordings, forms, and surveys. You can filter by segments, flag low-performing pages, and zero in on patterns like high error rates or friction hotspots, without needing to jump between multiple tools. Whether you’re testing new designs, fixing bugs, or refining copy, this consolidated view speeds up your analysis and keeps your entire team aligned.
See how Greyson Clothiers used VWO Insights to deeply understand user behavior and improve their digital storefront. By leveraging heatmaps and scrollmaps, they identified which content users engaged with and optimized page layouts. Session recordings revealed friction points, especially on mobile, helping them enhance CTA usability. Through these insights and targeted A/B tests, they achieved a 10.5% increase in revenue and improved overall user experience.
Start exploring these insights for yourself with VWO’s 30-day free trial. It’s a hands-on way to see how behavior-driven decisions can transform your website experience from the ground up.
FAQs
Absolutely. You can track anonymized visitor activity such as traffic sources, time on site, navigation behavior, and interactions using analytics and tracking tools.
By placing tracking scripts on your website, you can monitor user sessions, clicks, scrolls, and interactions, often visualized through analytics dashboards or behavior maps.
Websites use cookies, tracking pixels, JavaScript-based scripts, and third-party tools like Google Analytics or VWO to monitor visitor behavior across pages and sessions.
You can track clicks, scroll depth, mouse movements, page views, time spent, navigation paths, form interactions, CTA engagement, and more, depending on the tool used.
Combining traditional analytics (like Google Analytics for traffic and funnels) with behavior analytics tools (like VWO for heatmaps, session recordings, and form analysis) offers the most complete view.
Popular tools include Google Analytics, VWO, Hotjar, Microsoft Clarity, and FullStory, each offering different levels of behavioral and performance insights.
Yes, but it must comply with privacy laws like GDPR or CCPA. This typically requires obtaining user consent and clearly stating your data collection practices in a privacy policy.
Yes. Users can use privacy-focused browsers, enable tracking protection, reject cookies, use ad blockers, or browse in incognito/private mode to reduce tracking.
Categories:


![10 Best Enterprise Analytics Platforms [2026]: Expert Picks with Reviews and Comparisons](https://static.wingify.com/gcp/uploads/sites/3/2025/08/Feature-image-10-Best-Enterprise-Analytics-Platforms_-In-Depth-Reviews-and-Comparisons.jpg?tr=h-600)