Imagine if you had instant answers to what’s working and what’s not in your product.
“Users keep dropping off after onboarding—time to fix that!”
“This feature is a hit, but half your customers aren’t using it—boost engagement!”
“Churn is rising for monthly plans, but annual subscribers are sticking around—rethink pricing?”
Sounds like a dream, right? Well, that’s exactly what SaaS analytics tools do – they help uncover these insights, helping you enhance your product and hit crucial metrics.
But not all analytics tools measure the same things. Some track user behavior, while others focus on subscription metrics and churn prediction. Picking the right one is key to meeting your SaaS business objectives.
In this guide, we’ll explore the 7 best SaaS analytics tools, comparing their key features, use cases, and must-track metrics to help you find the perfect fit. Let’s get started.
What is SaaS analytics?
SaaS analytics enables software-as-a-service companies to track, analyze, and interpret data across the customer journey, leading to smarter, data-driven decisions. By monitoring key user metrics, businesses gain actionable insights that help improve products, enhance engagement, and boost retention.
SaaS analytics is designed specifically for subscription-based businesses, uncovering trends that impact growth. It helps companies with:
User behavior trends – Understand how customers interact with the product, which features drive engagement, and where users drop off.
Churn & retention insights – Identify why customers leave and develop strategies to improve retention.
Revenue & growth tracking – Monitor key SaaS metrics like MRR, ARR, churn rate, and CLV to assess business health.
Types of SaaS analytics tools needed by SaaS companies
Web analytics tools: Track website traffic, visitor behavior, and conversion rates to optimize marketing efforts and user acquisition.
User behavior analytics tools: Analyze how users interact with a product, including clicks, navigation paths, and engagement patterns, to improve UX and feature adoption.
Product analytics tools: Provide insights into feature usage, retention trends, and customer engagement within a SaaS product to enhance functionality and user satisfaction.
Customer journey analytics tools: Map the end-to-end customer experience across multiple touchpoints to identify friction points and optimize onboarding, retention, and support.
Revenue & churn analytics tools: Monitor key financial metrics like MRR, ARR, churn rate, and expansion revenue to assess business growth and reduce customer attrition.
Subscription analytics tools: Track recurring revenue, billing cycles, and customer lifetime value (CLV) to optimize pricing strategies and subscription management.
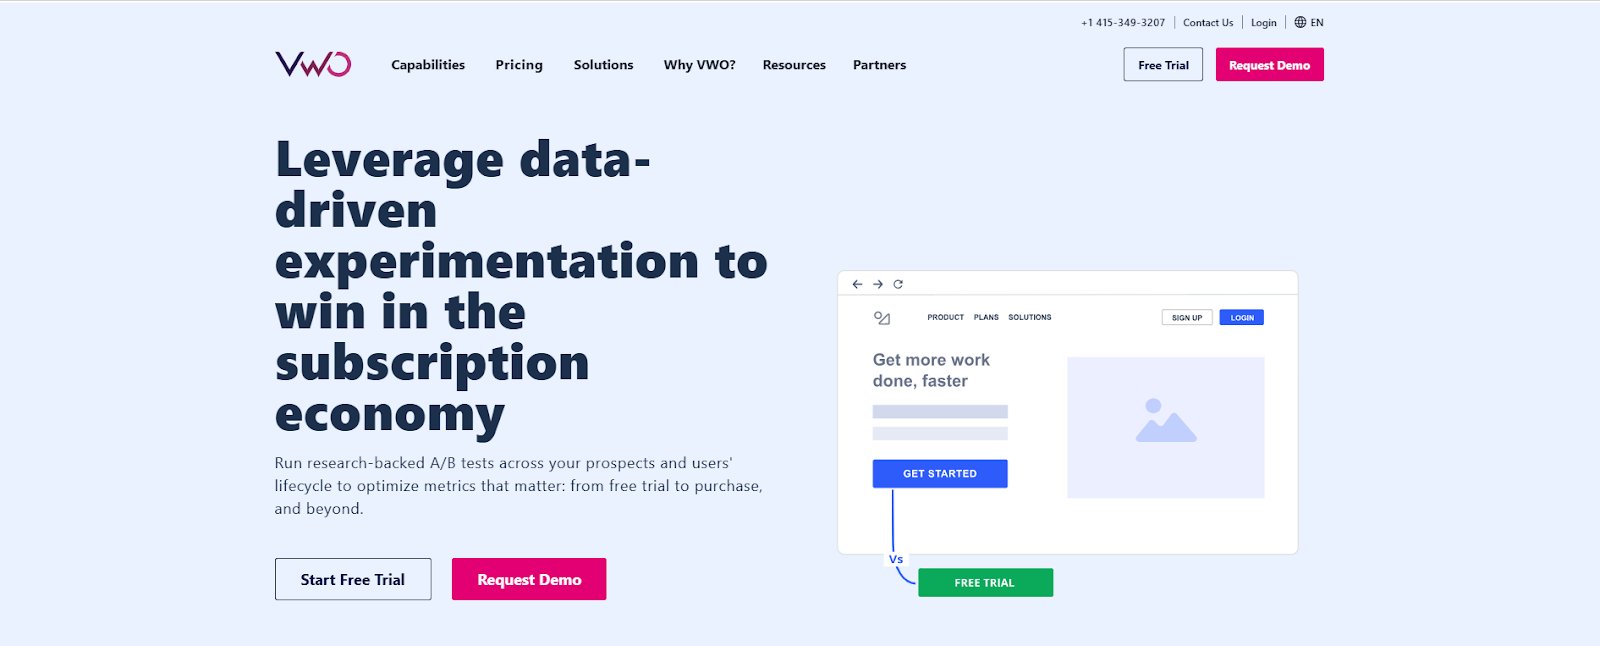
When choosing a SaaS analytics tool, businesses look for more than just tracking—they need actionable insights and the ability to experiment for data-driven improvements. While many tools specialize in either behavioral analytics or A/B testing, VWO brings both together, making it a powerful choice for SaaS companies aiming to understand user behavior and optimize for conversions simultaneously.
Deep behavioral analytics with VWO Insights
VWO Insights gives a clear view of user journeys, showing exactly where they click, navigate, and drop off. Heatmaps, session recordings, and funnels help SaaS teams uncover friction points—whether it’s a confusing CTA, an abandoned form, or an underutilized feature—allowing them to make informed improvements.
When conversion rates are low, VWO’s form analytics identify hesitation points in sign-up flows, revealing which fields users skip, refill, or abandon. On-page surveys further bridge the gap, gathering real-time feedback to explain why users behave a certain way. With advanced segmentation, businesses can analyze these patterns based on device type, traffic source, or user behavior, ensuring precise and targeted optimizations.
Beyond insights: Testing and experimentation with VWO
While many SaaS analytics tools stop at insights, VWO goes a step further by enabling experimentation, ensuring that optimizations are backed by real data, not assumptions.
SaaS businesses can leverage VWO based on their specific needs—VWO Testing for web experimentation, such as A/B testing landing pages, CTAs, messaging, and pop-ups to improve conversions and engagement. For deeper, server-side experimentation, VWO Feature Experimentation enables SaaS businesses to refine onboarding with guided tours, optimize pricing strategies through controlled tests, and launch features with confidence via staged rollouts, ensuring minimal risk before full deployment.
Pro Tip!
Maximize your optimization efforts with VWO Copilot—let AI handle data-backed hypothesis generation, test setup, segmentation, and analysis so you can focus on scaling conversions and driving growth faster.
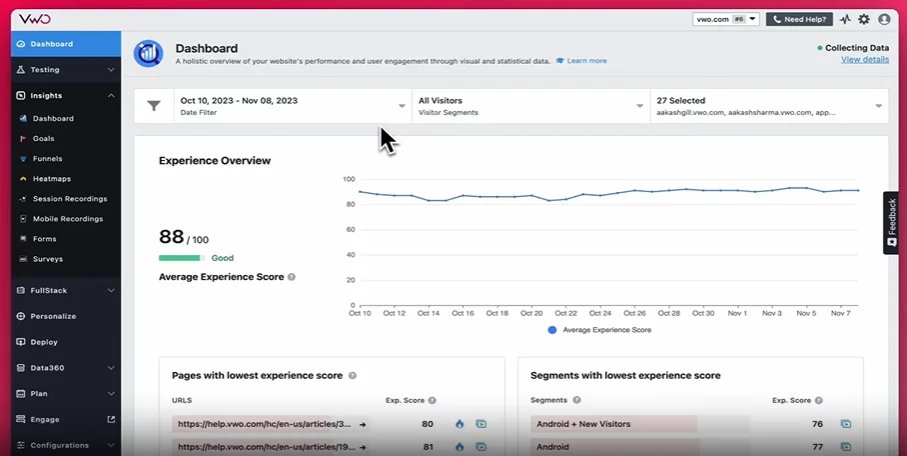
Dashboard overview:
The Insights Dashboard provides an experience score to pinpoint areas for improvement. With easy access to session recordings, heatmaps, and form and survey analytics, it streamlines user experience analysis by providing a centralized, visual breakdown of visitor behavior, eliminating guesswork and enabling quick, data-driven improvements.
Additional features
AI-powered Heatmap Generator and Surveys
Customer Data Platform
No-Code Editor
Enhanced SmartStats
Advanced Targeting
Pricing
Free trial: 30 days, inclusive of all features.
Paid: Offers customized pricing plans according to your business requirements.
Customer experience
Every A/B testing process aims to bring a significant raise in the conversion rates, and for a SaaS website like POSist, which targets niche restaurant industry, this was a 4 month long journey. After months of rigorous testing in between multiple variations of our website with VWO’s Split URL testing campaigns, we were able to register a 50% growth in our organic leads.
Ashish Tulsian Cofounder and CEO at Restroworks
For SaaS teams seeking a tool that does more than track numbers, VWO provides the perfect balance of insights and optimization, helping businesses make data-backed decisions that drive higher engagement, conversions, and revenue growth.
Quick note: Want to take your SaaS global? Learn proven monetization tactics and expansion strategies from Verifone’s APAC Sales Manager. Watch this 40-minute webinar to discover how to accelerate time-to-market, optimize payment systems, and navigate compliance risks while expanding internationally.
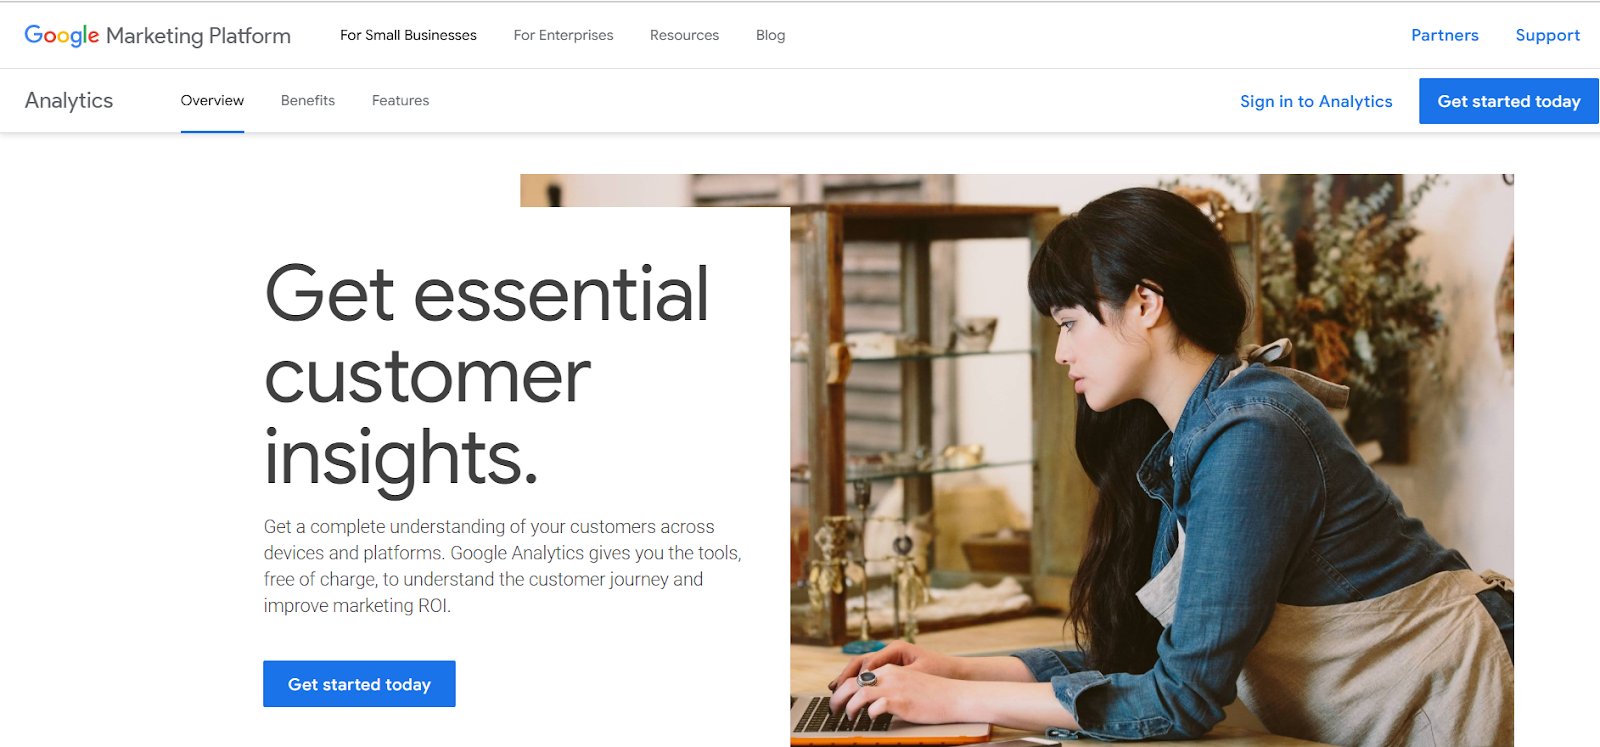
2. Google Analytics 4
Google Analytics 4 provides a complete event-based view of user interactions across websites and apps, providing a clear view of engagement, conversions, and drop-offs. With advanced reporting and machine learning, GA4 uncovers which channels drive results, where users struggle, and who is likely to convert or churn.
By integrating with CRM, POS, and first-party data sources, GA4 delivers a comprehensive customer view, enabling businesses to refine marketing, onboarding, and product experiences for sustained growth.
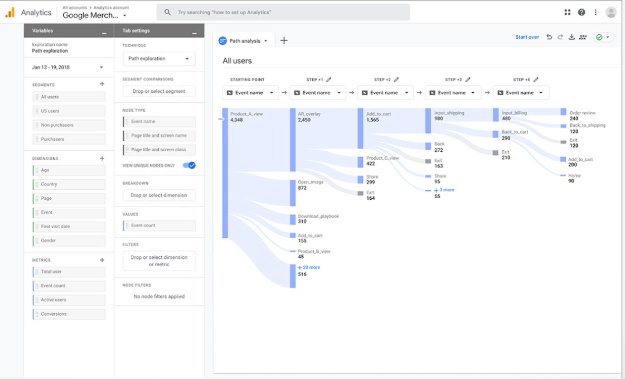
Dashboard overview:
Google Analytics 4 Dashboards give a quick visual snapshot of key metrics, making it easy to track performance and uncover insights in real time. With customizable widgets—like charts, tables, and numeric displays—you can tailor dashboards to your needs, share them with your team, and export reports effortlessly for seamless collaboration.
Features
Built-in Automation
Predictive Analytics
Real-Time Reporting
Funnel Analysis
User Exploration using segmentation
Pricing
Google Analytics 4 is free for all.
Pros & cons
Pros
A clear view of website analytics, displaying key metrics like user engagement, active users, real-time visitors, and traffic sources.
It is easy to integrate by simply pasting a code into the website’s header, making setup quick and hassle-free.
Cons
Advanced customization requires technical expertise, making it less accessible for non-technical users.
The user interface in GA4 can be overwhelming for beginners due to its complexity and numerous features.
“Usingthe virtual analysis features and solutions from GoogleAnalytics has greatly enhanced my ability to analyzecustomer data and improve user experience.” – Lydie Daulier, Content Editor and Designer at a Small Business
3. Kissmetrics
Kissmetrics is a user behavior analytics platform that helps SaaS companies track and analyze user behavior, tying every action to an individual for a complete view of customer interactions. It provides insights into active users, feature adoption, and page views, helping businesses optimize engagement and retention.
With churn tracking, LTV calculation, and revenue analysis, Kissmetrics enables data-driven decisions to maximize growth. It also tracks acquisition sources and user activity across sites and products, offering a clear path to improving conversions and customer success.
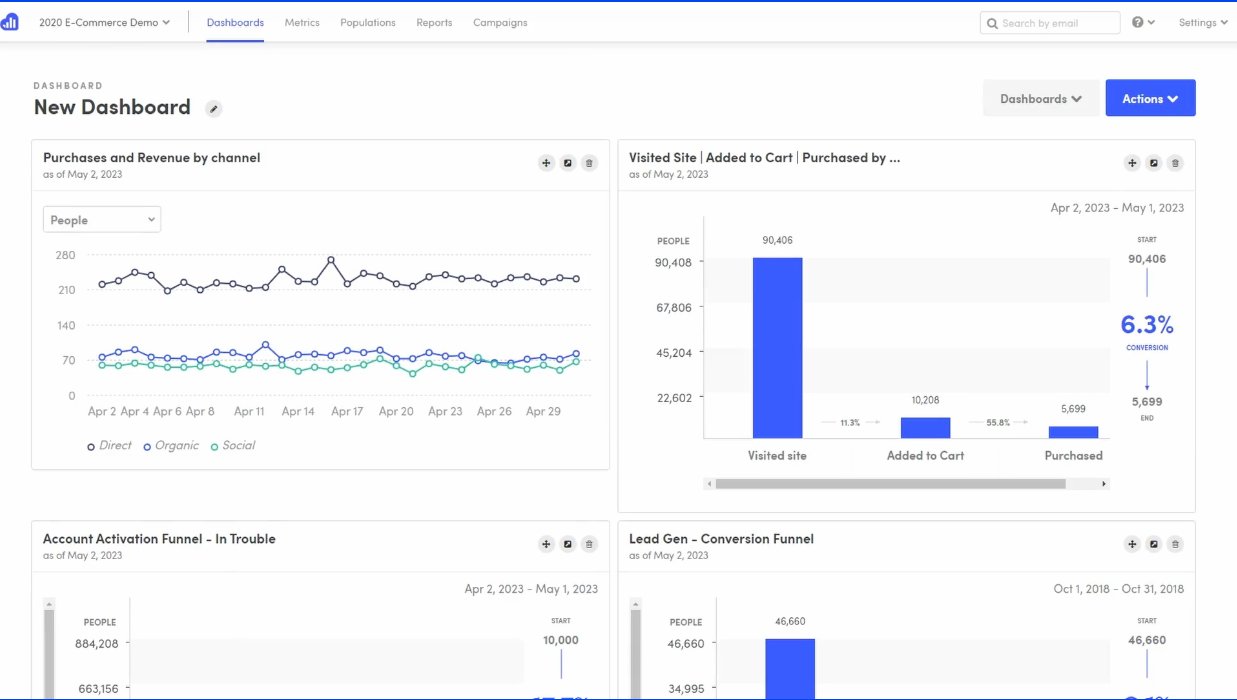
Dashboard overview:
Kissmetrics offers a user-focused dashboard that connects every action to an individual, providing reports on acquisition sources, feature usage, top customers, and churn risk. With real-time insights, teams can analyze behavior, identify bottlenecks, and refine growth strategies in one intuitive interface.
Features
Funnel Visualization
Cohort Analysis
Customer Segmentation
Advanced BI Reporting
Pricing
Small teams: $299/month, billed annually
Medium-sized teams: $499/month, billed annually
Large teams: Custom
Pros & cons
Pros:
It allows quick data analysis and identifies key insights through statistical distribution frequencies.
The user-friendly interface makes data visualization simple and intuitive.
Cons:
Kissmetrics requires additional costs for some advanced features.
It has a learning curve that takes time to adapt and master.
“Kissmetrics excels in its features. The ability to track, analyze, and segment our customers’ online behavior is unparalleled. Additionally, Kissmetrics allows us to integrate data from multiple platforms, making it a comprehensive solution for all our analytics needs.” – Matt Saricicek, Founder at Biyo
4. Userpilot
Userpilot is a comprehensive platform that integrates product analytics, user onboarding, in-app surveys, and feedback collection, helping businesses track user trends, measure feature popularity, and refine product experiences.
Through trend and funnel analysis, companies can pinpoint drop-off points, identify friction in the user journey, and optimize feature adoption—enhancing retention, streamlining workflows, and driving revenue growth while reducing tech stack complexity and costs.
Dashboard overview:
Userpilot’s customizable product analytics dashboard tracks key metrics like product usage, activation, adoption, and retention, with options to build from scratch or use templates. Teams can drag and drop reports, integrate survey responses, and share insights effortlessly to drive data-driven decisions.
Features
Trend Analysis
In-app Surveys,
Funnel Analysis
Session Replay
Event Autocaptur and Path Analysis
Pricing
Free trial: 14 days for all plans.
Paid: Starts from $249/month, billed annually.
Pros & cons
Pros:
Userpilot enables the easy setup of surveys, NPS measurements, user flows, and banners without developer support.
Its intuitive interface and no-code builder allow quick deployment and optimization of in-app experiences.
Cons:
The analytics dashboard could offer better clarity and more advanced insights into user behavior.
Customization for flows, the resource center, and surveys could be expanded for greater flexibility.
“We currently use Userpilot mainly for in-app messaging (tooltips, modals, etc), in-app surveys, and NPS. The UI is very easy to use, so that also eliminates the need for development to step in. Last, the insights portion is nice and very intuitive.” – Dylan Caraker, Senior Customer Marketing Manager at GrowthZone
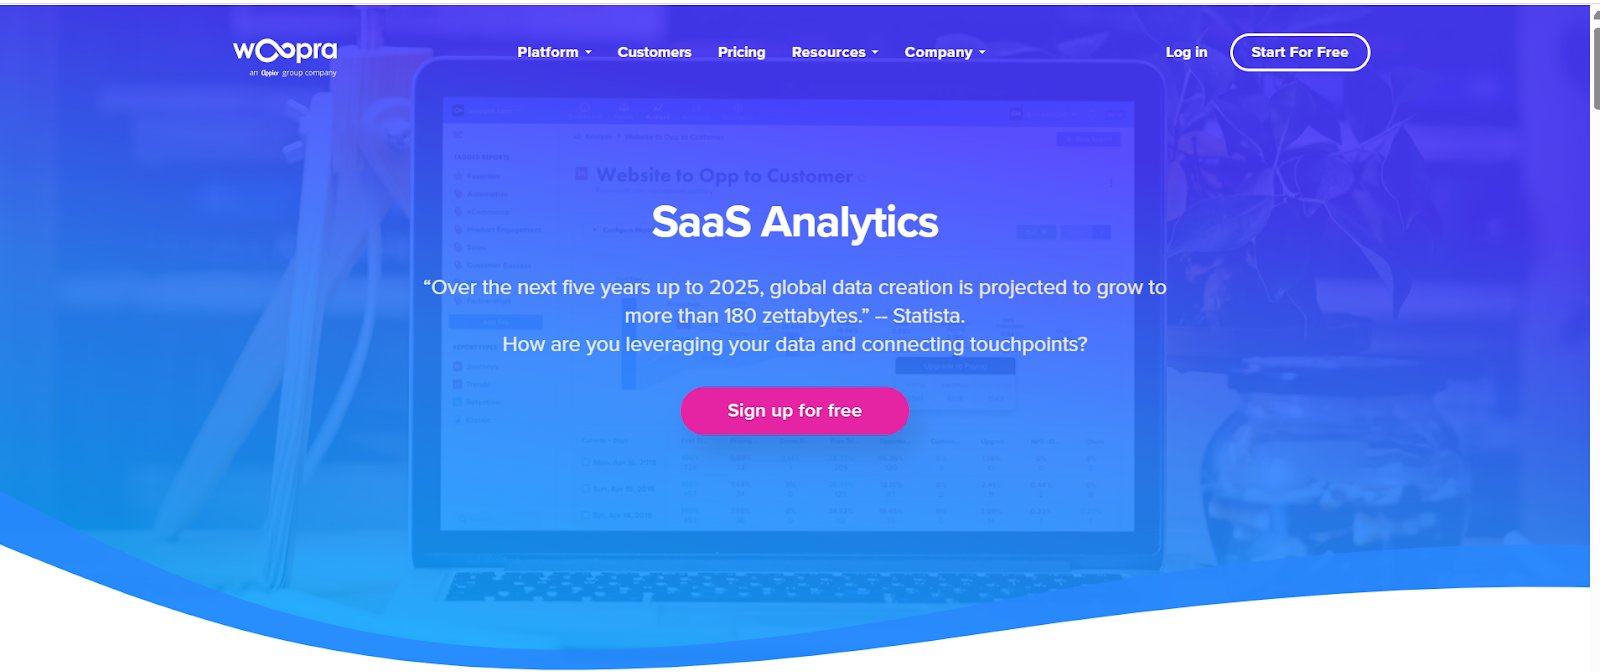
5. Woopra
Woopra provides SaaS analytics solutions that track and optimize the entire customer journey—from acquisition to retention. Unlike traditional tools, Woopra provides non-linear, omnichannel insights by integrating with CRM, marketing, and support platforms to unify customer data and enable smarter, automated actions.
Woopra’s Journey Reports map multi-channel user interactions, helping businesses identify drop-offs, optimize onboarding, and improve retention. With segmented, real-time insights, it pinpoints whether churn stems from marketing, product issues, or support gaps—empowering teams to act fast.
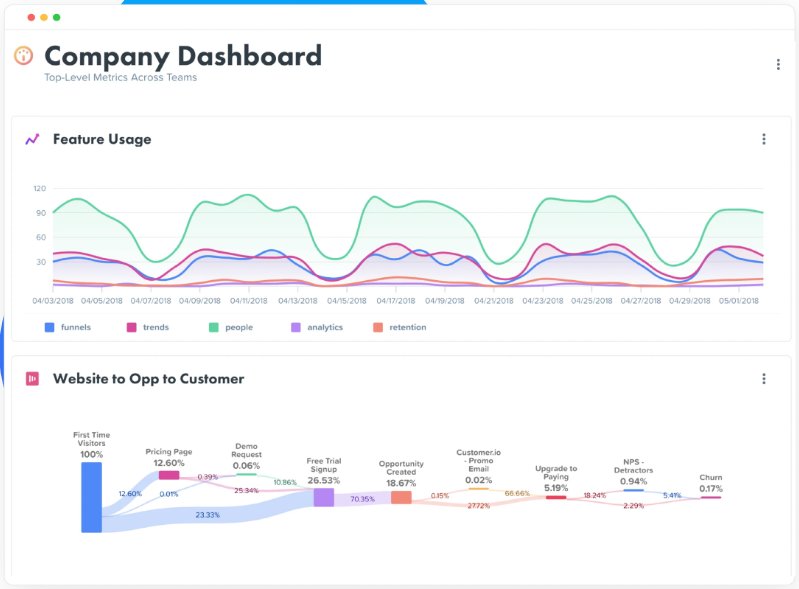
Dashboard overview:
Woopra’s dashboard provides a variety of reports to evaluate user behavior and performance. It features Customer Journey Reports to track visitor interactions across different stages, Metric Trend Reports for visualizing key trends over time, Cohort Reports to analyze growth within specific user segments, and Retention Reports to measure long-term visitor engagement.
Features
One-click Integrations
Behavioral Segmentation
Real-time Triggers
Dynamic Journeys
Trends & Subscription Reports
Full Funnel Campaign Attribution
Pricing
Free trial: 14 days for the paid plans.
Free: Learn & experiment with 10k actions/month.
Paid: Starts from $49/month.
Pros & cons
Pros:
Helps understand user requirements and priorities while offering an intuitive interface and easy setup.
Effectively tracks solutions and monitors all clients with valuable, ready-to-use metrics while remaining lightweight for end users.
Cons:
Requires developer support for certain tasks and downloading complex reports.
Some inconsistencies in user records can make accurate data tracking challenging.
“Our company uses Woopra daily to gather unique insights that we can’t find through other sources. We combine custom journey reporting, which tracks the pages users interact with, alongside user attributes merged from Stripe, BigQuery, and several other sources. This valuable information helps us make important business decisions on an ongoing basis.” – Andrew Kerr, Senior Marketing Technologist at PetFriendly
6. ChartMogul
ChartMogul is a subscription analytics platform that helps SaaS companies track, analyze, and optimize revenue by normalizing billing data in real time. It provides accurate insights into key SaaS metrics like MRR, ARR, churn, and retention, along with benchmarking tools that compare performance against 2,500 SaaS companies, enabling businesses to refine their growth strategies, scale efficiently, and make data-driven decisions.
Its advanced data auditing tools ensure precise subscription tracking by allowing businesses to remove false churn events, merge customer records, track refunds, and audit every MRR movement for full financial control.
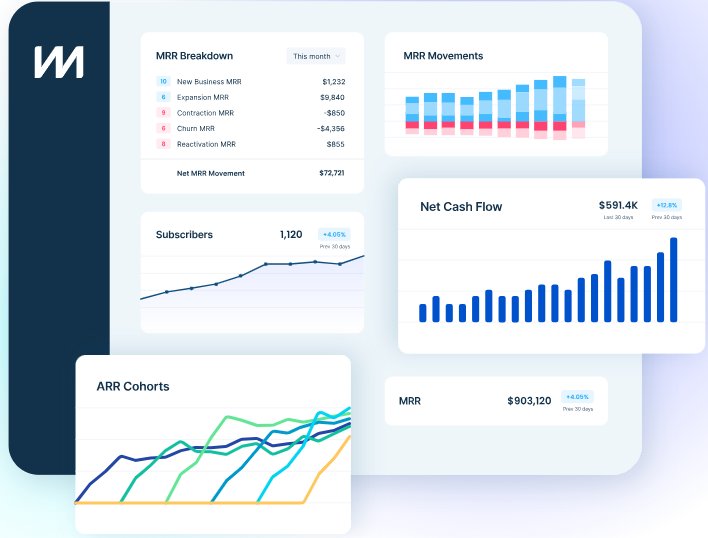
Dashboard overview:
ChartMogul’s customizable dashboards transform billing data from multiple sources into visual insights, tracking ARR, LTV, retention, and churn in real time. By comparing trends with historical performance, businesses can identify patterns, refine strategies, and drive subscription growth.
Features
Segmentation
Cohort Analysis
Customer Reports
Pricing
Free trial: 14 days for the Pro plan.
Free: For early-stage companies with less than $10k MRR.
Paid: Starts from $99/month, billed annually.
Pros & cons
Pros:
Offers fast reporting, easy data exports, and API integration for custom dashboards.
Seamlessly generates all key business and finance metrics for SaaS companies.
Cons:
Lacks built-in separation for New vs. Recurring MRR and forecasting.
Managing larger datasets would be more efficient with support for a custom data source and data lake infrastructure.
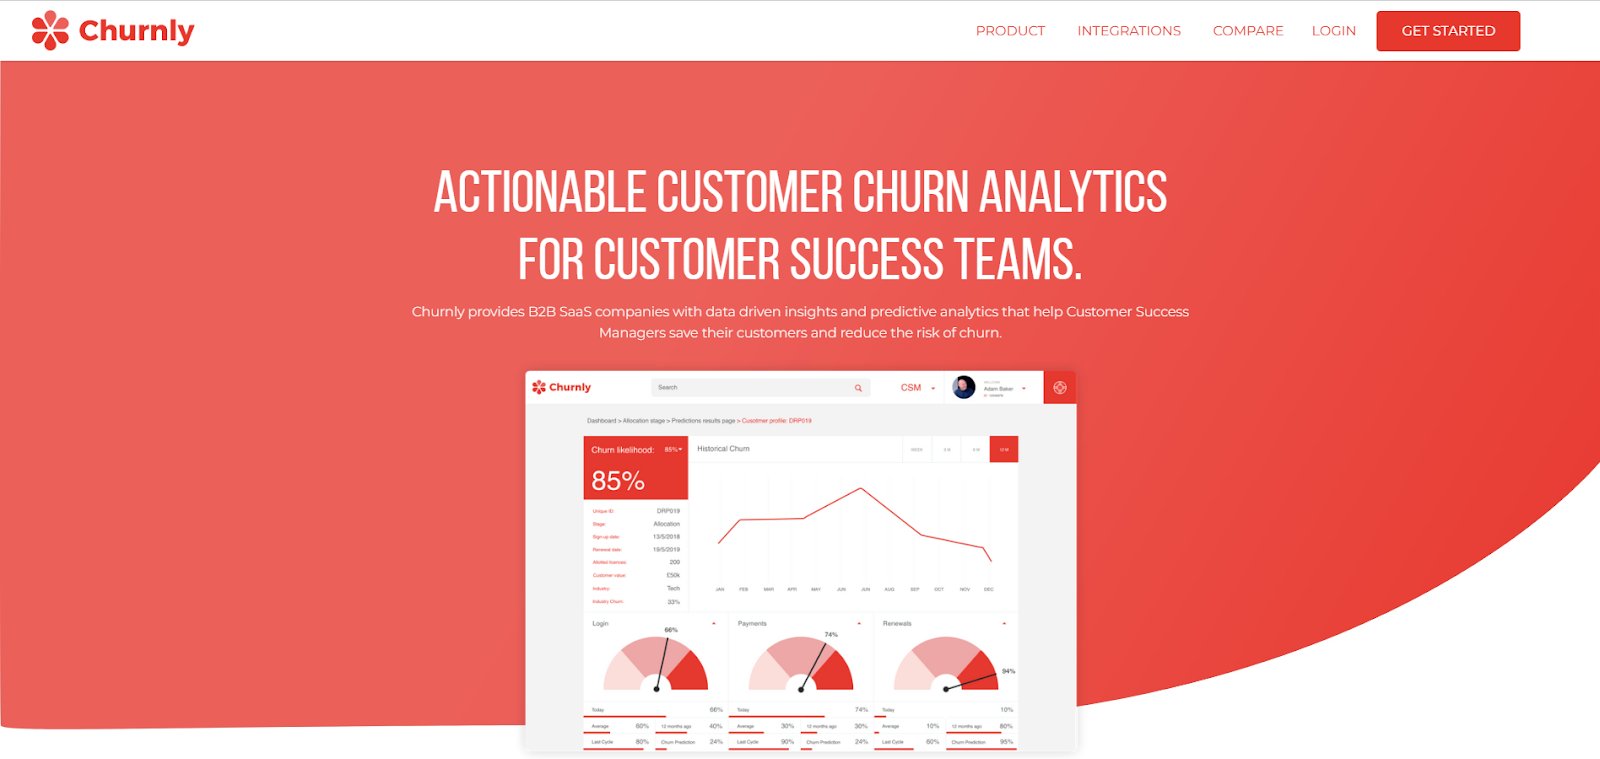
Churnly is a churn management software that helps B2B SaaS companies predict and prevent churn with AI-driven insights and 92-96% accurate forecasts. It analyzes millions of data points to identify churn triggers, providing real-time visibility into product adoption, engagement, and renewal patterns.
With proactive alerts and predictive analytics, Customer Success teams can intervene early, retain customers, and reduce revenue loss. By leveraging AI-powered insights, Churnly enables SaaS businesses to maximize customer lifetime value and drive sustainable growth.
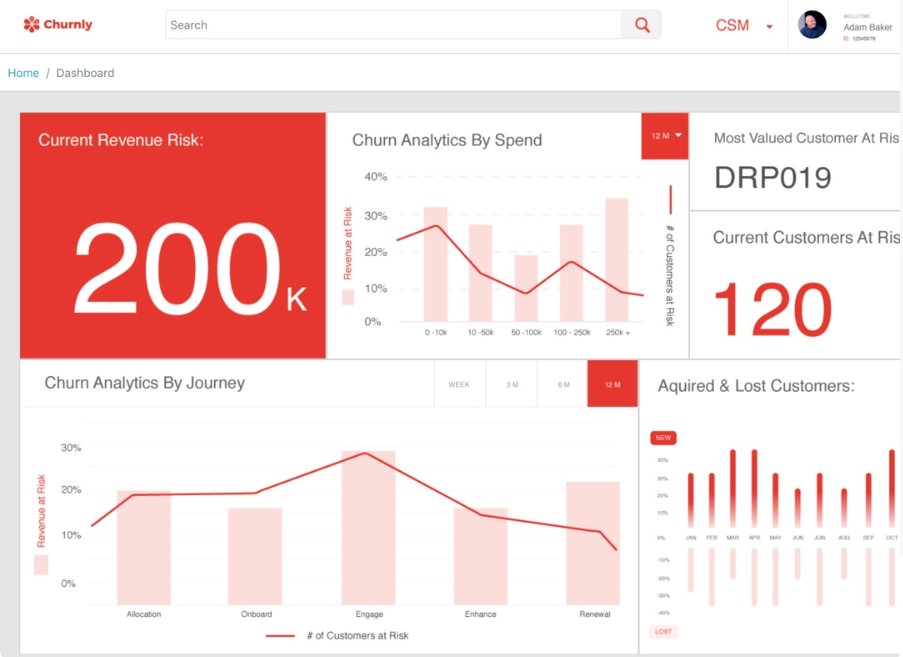
Dashboard overview:
Churnly’s intuitive dashboard visualizes churn analytics, highlighting customer journeys, spending trends, acquired vs. lost users, and at-risk customers. With real-time insights, businesses can identify retention risks, prioritize high-value users, and take proactive steps to reduce churn.
Features
Actionable Predictions
Powerful Integrations
Custom APIs
Filtering Tools
Pricing
Plans are not available on the website.
Pros & cons
Pros:
Makes it easy to track at-risk customers, allowing for proactive retention strategies.
Cons:
Only compatible with Windows, limiting use on other operating systems.
“What I like best about it is how incredibly easy it is to alert us to at-risk customers, enabling proactive engagement, like tracking customer retention.” – Cheyanne Biddle, Advocate
Key features to look for while selecting SaaS analytics tools
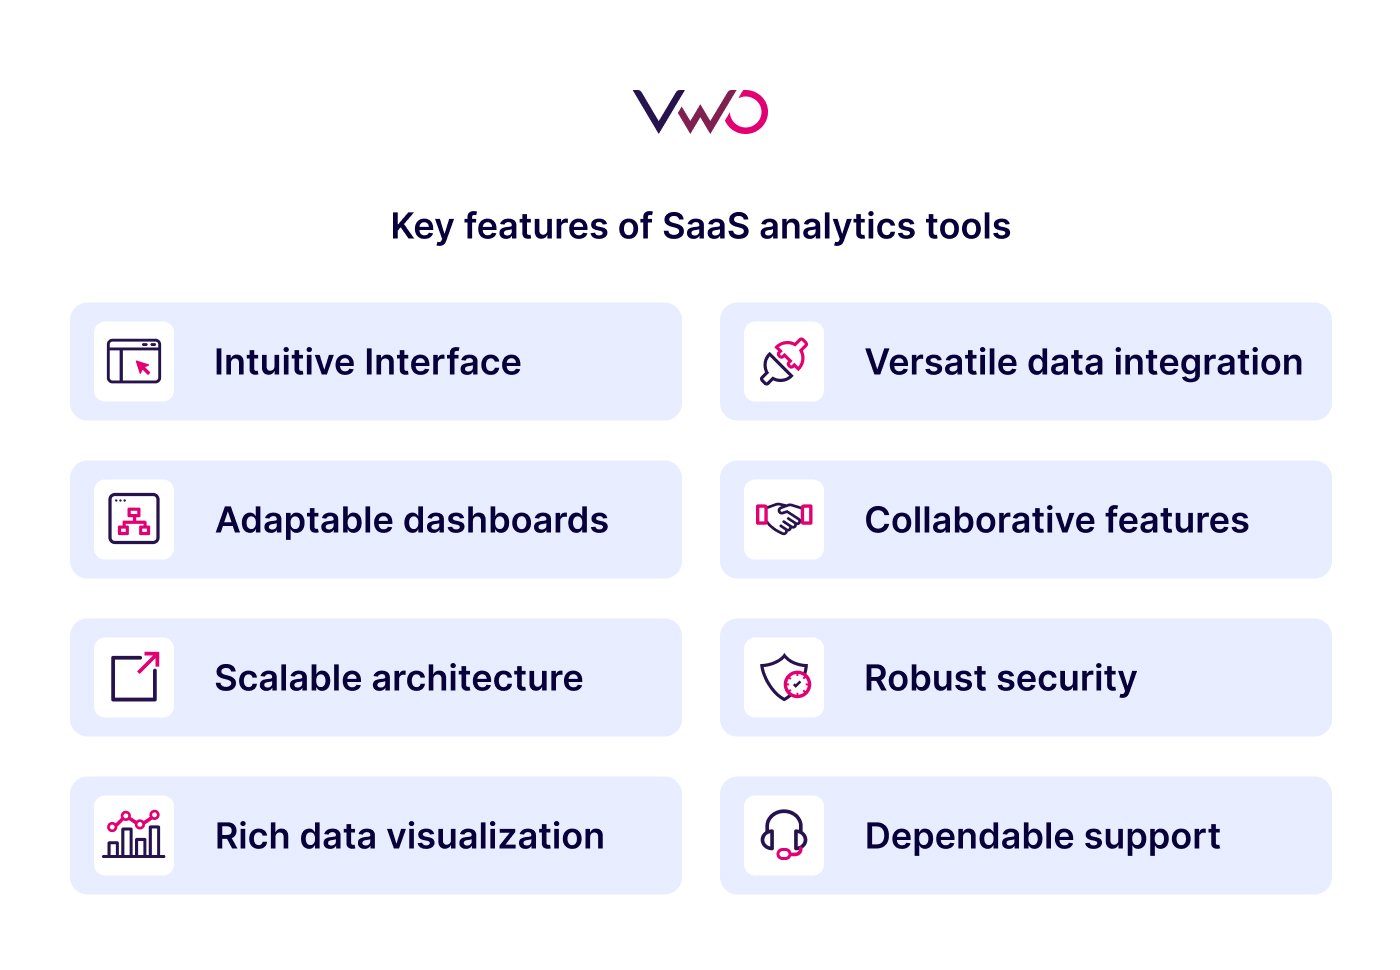
When selecting SaaS analytics tools, it’s essential to consider several key features to ensure you choose the right one for your business needs. Here are some important aspects to look for:
Intuitive interface: The tool should be easy to navigate, allowing users to quickly understand and use its features.
Adaptable dashboards: The ability to customize dashboards ensures that users can focus on the metrics that matter most to them.
Scalable architecture: As your business grows, the tool should be able to handle increased data loads and user numbers without compromising performance.
Rich data visualization: Effective data visualization options help in making complex data easily digestible through various chart types and interactive graphics.
Versatile data integration: Seamless integration with other software and data sources, such as CRMs, ERPs, and marketing platforms, is crucial for comprehensive analytics.
Collaborative features: Tools that support teamwork by enabling easy sharing and commenting on reports and dashboards can enhance decision-making processes.
Robust security: Ensuring data protection through encryption, access controls, and compliance with relevant standards is essential for safeguarding sensitive information.
Dependable support: Access to knowledgeable and responsive customer support can be invaluable when troubleshooting issues or optimizing the use of the tool.
Key SaaS metrics & KPIs to track with analytics tools
For a SaaS business to scale successfully, tracking the right metrics is crucial. By analyzing key performance indicators (KPIs), companies can identify opportunities, address challenges, and refine strategies to drive long-term sustainability and maintain overall business health.
Below is a breakdown of the most important SaaS metrics, categorized to help businesses focus on the areas that matter most.
1. Revenue metrics
Monthly Recurring Revenue (MRR) – Measures predictable monthly subscription revenue, providing a clear view of business growth.
Annual Recurring Revenue (ARR) – Tracks yearly recurring revenue from subscriptions, offering a long-term perspective on financial stability.
Customer Lifetime Value (CLV/LTV) – Estimates the total revenue a customer is expected to generate throughout their relationship with the company.
Customer Acquisition Cost (CAC) – Calculates the cost of acquiring a new customer, helping businesses assess the efficiency of their sales and marketing efforts.
2. Retention and growth metrics
Churn Rate – Tracks the percentage of customers who cancel their subscriptions, indicating retention challenges.
Net Revenue Retention (NRR) – Measures revenue retention, including expansion revenue from existing customers, offsetting churn.
Retention Rate – Calculates the percentage of customers who continue using the product over a specific period, reflecting customer loyalty.
Expansion Revenue – Tracks additional revenue generated from existing customers through upsells, cross-sells, and add-ons.
3. Product and engagement metrics
Product Adoption Rate – Measures how quickly and effectively customers start using key features within the product.
Customer Engagement Score – Assesses how frequently and deeply customers interact with the product, indicating overall engagement levels.
Conversion Rate – Evaluates the percentage of trial users or leads who convert into paying customers.
Average Revenue Per User (ARPU) – Calculates the revenue generated per active customer, helping businesses assess pricing effectiveness.
4. Customer satisfaction metrics
Net Promoter Score (NPS) – Gauges customer loyalty by measuring how likely users are to recommend the product.
Customer Satisfaction Score (CSAT) – Collects direct user feedback to assess overall satisfaction with the product or service.
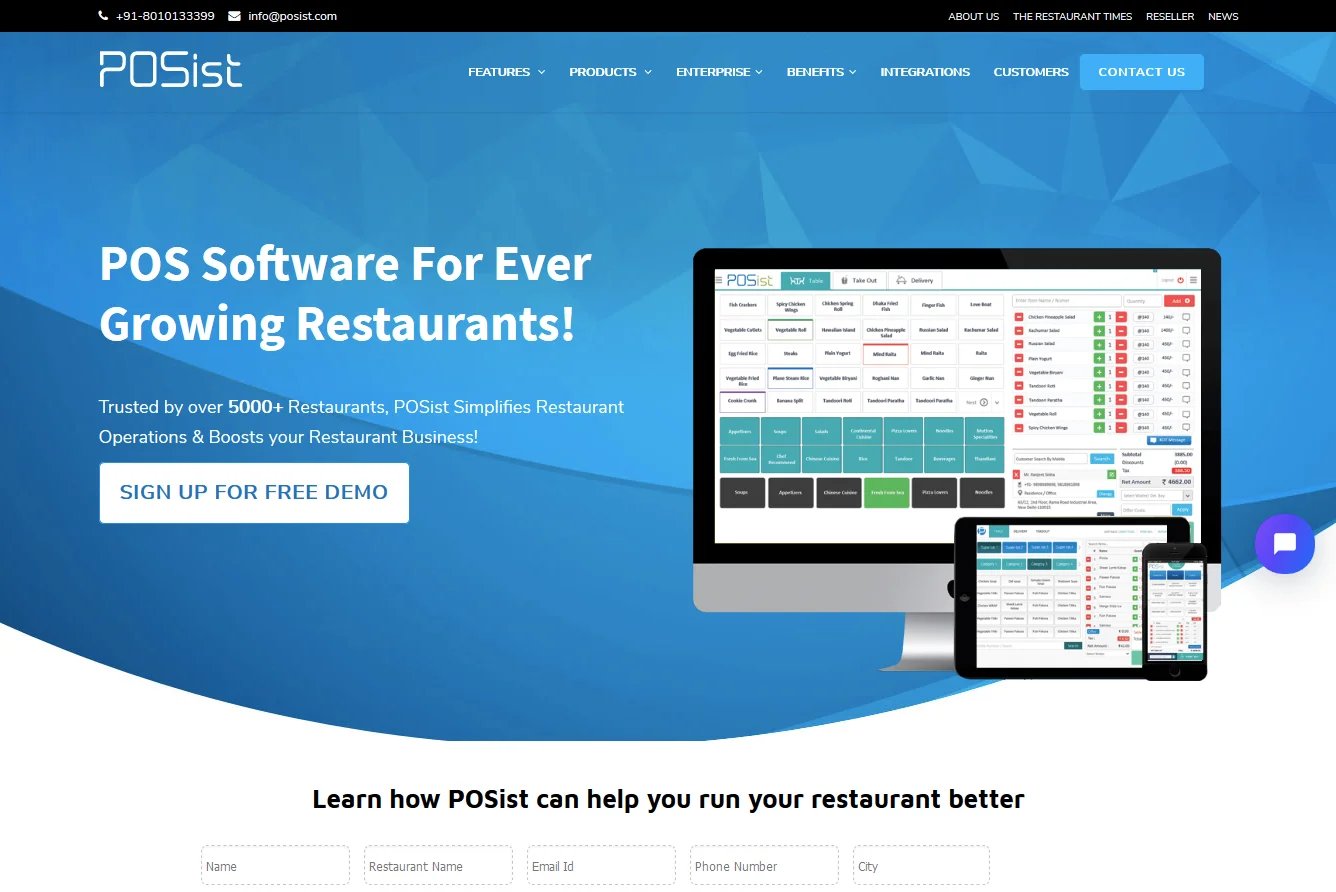
How VWO helped RestroWorks improve Demo requests by 52%
Restroworks, a SaaS-based restaurant management platform, sought to increase demo sign-ups by optimizing its Home and Contact Us pages. Using VWO’s Experience Optimization Platform, they identified friction points and improved conversions.
Challenge & solution:
VWO Insights’ heatmaps and session recordings revealed low engagement and high drop-offs on key pages. To optimize conversion rates, Restroworks conducted multiple A/B tests over 12 weeks, testing:
Refined messaging and CTAs to improve Home-to-Contact page visits.
Used customer logos and testimonials to build trust and credibility.
Form optimization using VWO Form Analytics to reduce abandonment.
A distraction-free Contact Us page by minimizing exit points.
PoSist – Control PoSist – Variation 1PoSist – Variation 2
Results:
By continuously testing and optimizing, Restroworks achieved a 52% increase in demo requests in just one month, boosting its overall website conversion rate by 25%, reaching 3.4%. Encouraged by these results, the team has rolled out the winning designs across other product pages to replicate success.
VWO helps you understand how users behave on your SaaS platform so you can make smarter decisions that boost sign-ups and demos. Want to see how it works? Sign up for a free demo.
FAQs
Q1. What is SaaS analytics?
SaaS analytics involves tracking key performance metrics like revenue, customer engagement, and retention to optimize growth and decision-making in subscription-based businesses.
Q2. What are SaaS analytics tools?
SaaS analytics tools provide insights into customer behavior, product engagement, and revenue performance. By analyzing real-time data, they help businesses track trends, reduce churn, and optimize growth strategies.
Q3. What does a SaaS analyst do?
A SaaS analyst monitors and interprets SaaS metrics, identifies trends, assesses customer behavior, and provides strategic recommendations to improve retention, revenue, and overall business performance.
Q4. How do SaaS analytics tools improve business decision-making?
They provide real-time insights into customer engagement, churn risk, and financial health, enabling data-driven strategies for retention, marketing, and product development.
Q5. What features should I look for in a SaaS analytics tool?
Key features include real-time reporting, customizable dashboards, revenue tracking (MRR/ARR), churn analysis, user behavior insights, segmentation, and third-party integrations.
Q6. What are the key SaaS metrics to track?
Important metrics include Monthly Recurring Revenue (MRR), Annual Recurring Revenue (ARR), Churn Rate, Customer Lifetime Value (LTV), Retention Rate, Net Promoter Score (NPS), and Conversion Rate.
Q7. What are the benefits of using SaaS analytics over traditional analytics tools?
SaaS analytics tools offer real-time data, automation, predictive insights, and subscription-specific metrics, unlike traditional analytics, which may focus on general business KPIs without SaaS-specific insights.
Q8. How do I choose the right SaaS analytics tool for my business?
Consider your business size, budget, required integrations, and whether you need product analytics, revenue tracking, or customer behavior insights. Look for ease of use, scalability, and automation capabilities.
Q9. Which is the best tool for SaaS analytics?
The best tool depends on your needs. Popular options include Mixpanel (product analytics), ChartMogul (subscription metrics), Google Analytics (web analytics), and Userpilot (user onboarding & behavior tracking).
I've worked as a writer and editor in the B2B SaaS space for over 6 years. I read and write on all things CRO and experience optimization.
I'm a chai fanatic and a paranoid parent. When I'm not copyediting or working on marketing projects, I love to spend my time reading. Besides B2B content, my passion lies in modern, behavioral astrology. I'm a dreamer and wish to write stories for children someday :)
Uncover hidden visitor insights to improve their website journey
One of our representatives will get in touch with you shortly.
Awesome! Your meeting is confirmed for at
Thank you, for sharing your details.
, you're all set to experience the VWO demo.
I can't wait to meet you on at
Account Executive
, thank you for sharing the details. Your dedicated VWO representative, will be in touch shortly to set up a time for this demo.
We're satisfied and glad we picked VWO. We're getting the ROI from our experiments.
Christoffer Kjellberg
CRO Manager
VWO has been so helpful in our optimization efforts. Testing opportunities are endless and it has allowed us to easily identify, set up, and run multiple tests at a time.
Elizabeth Levitan
Digital Optimization Specialist
As the project manager for our experimentation process, I love how the functionality of VWO allows us to get up and going quickly but also gives us the flexibility to be more complex with our testing.
Tara Rowe
Marketing Technology Manager
You don't need a website development background to make VWO work for you. The VWO support team is amazing
Elizabeth Romanski
Consumer Marketing & Analytics Manager