You manage a mobile app and work tirelessly to grow it.
App store optimization is one of the growth levers, but your biggest bet should be optimizing your mobile app’s user experience.
With millions of mobile apps competing for attention, how do you ensure your app stands out and thrives? The real challenge begins here.
Today, a typical mobile user spends over four hours daily using apps.
Not just the time invested, but in 2023 alone, consumers spent $171 billion on apps. That’s the kind of opportunity we’re talking about.
Yet, without the right strategies, mobile apps can quickly become abandoned. Every year, 1.86 million mobile apps in stores are abandoned.
The key to avoiding this fate lies in understanding your users’ behavior—what they want, how they interact with your app, and what keeps them coming back.
That’s where mobile analytics come in.

This guide will give you everything to get you started in the world of mobile analytics: what it is, why it matters, and how to use it to drive success.
Along the way, you’ll discover mobile analytics tools that make tracking and improving your app a breeze. So, without further ado, let’s begin.
What is mobile analytics?
Without mobile analytics, every decision is based on gut or guesswork.

With mobile analytics, every decision is data-backed and more likely to be right.
Mobile analytics is a way to track and understand your app’s user data. It involves collecting, analyzing, and using data to improve users’ journeys.
With app analytics, you can find answers to simple but important questions. For example:
- How many people are using my mobile app?
- What features are popular, and what features are ignored?
- Where do users drop off, and why?
- Are my app’s users facing difficulties? Are there any design issues or technical glitches?
In short, mobile analytics help you determine what’s working and what isn’t, making it easier to create an app experience that users love.
Why is mobile analytics important?
1. Grow active users
An average user has dozens of mobile apps installed but actively engages with only a few.
You need precise insights to succeed in this selective usage pattern.
Mobile analytics help you go beyond vanity metrics like downloads and focus on active user growth by understanding engagement patterns.
For example, analytics might reveal that users who complete the onboarding tutorial are twice as likely to become active daily.
With this knowledge, you can refine your app onboarding process, making it shorter or more interactive to ensure users complete it.
Mobile analytics also lets you segment mobile app users geographically or demographically, allowing you to prioritize regions or personas that drive higher user engagement.
A ride-sharing mobile app might discover that a surge in active users coincides with local festivals, allowing it to time promotions perfectly to increase relevance and engagement.
2. Increase customer lifetime value (CLV) through retention
Retention isn’t just about keeping users—it’s about building loyalty that translates into long-term revenue. Analytics provides the clarity to dig deep into retention trends.
For example, analyzing cohorts might show that users who add three friends within the first week are more likely to remain active. This insight could guide you in introducing friend-referral incentives as a feature during the onboarding phase.
Mobile analytics tools also help you uncover pain points in user journeys that drive churn. For instance, a food delivery app might find users abandoning orders just before the payment stage.
Addressing these issues with faster payment gateways or offering guest checkout options can significantly improve retention. But before doing this, do check why users abandon.
Funnel analysis coupled with session recordings could help you check why users abandon apps.
3. Maximize the conversions and revenue
The leap from free user to paying customer is often small but decisive. Mobile app analytics uncovers the triggers that make users convert, enabling you to optimize for revenue growth.
For example, a subscription-based fitness app might notice that users who track workouts for seven consecutive days are 70% more likely to subscribe.
With this data, the app could send personalized nudges, like a progress milestone notification, on day six to encourage users to complete the streak.
Another powerful use case is understanding feature adoption and its impact on revenue.
For instance, a gaming app might find that players who engage with a specific in-app purchase feature tend to spend 30% more on average.
The app could make this feature more prominent during gameplay or test different price points to maximize revenue.
Additionally, user behavioral insights can help refine pricing strategies for freemium users, offering time-limited trials or discounts to high-potential users based on their activity levels.
4. Build roadmaps aligned with user choices
In app development, every decision has a cost—time, resources, and user goodwill. Mobile analytics helps prioritize what matters most by providing a clear, data-driven roadmap.
Moreover, analytics enables precise A/B testing. Imagine a shopping app introducing a new feature like a wishlist.
Instead of a full rollout, the mobile app tests two versions: one that adds wishlist items to the checkout flow and another that sends reminder notifications.
A travel booking app might use analytics to discover that users searching for flights also frequently book hotels within 24 hours.
Armed with this data, the app can integrate cross-sell offers directly into the search results page, boosting revenue and simplifying the user journey.
Analytics isn’t just a tool; it’s a strategy.
It transforms your mobile app from a static product into a dynamic experience, constantly shaped by valuable insights.
Whether growing your user base, increasing CLV, optimizing conversions, or guiding development, app analytics is your competitive advantage in a crowded market.
Before exploring the steps to analyze your mobile app, it’s important to understand the different types of app analytics available.
Tools support each type with varying levels of sophistication, and a single mobile analytics tool may cater to one or multiple types.
Types of analytics
Let’s clarify the differences by emphasizing what each type of analytics does and how they progress logically from one to the next. Let’s take a food delivery app example:
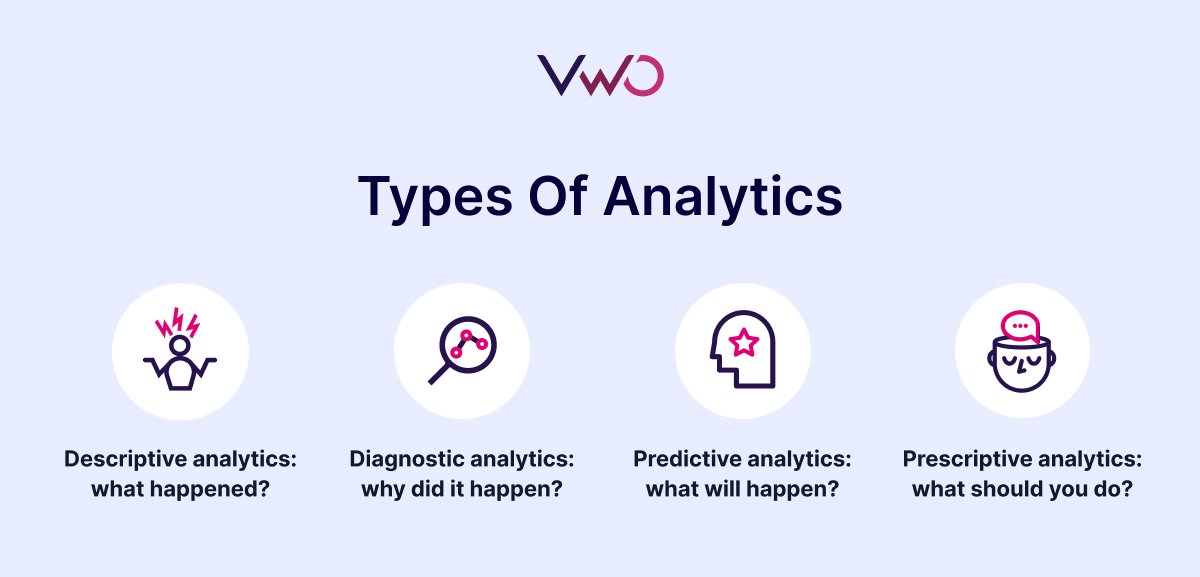
1. Descriptive analytics: what happened?
This is purely about reporting past events, with no analysis or predictions. It gives you a snapshot of the data.
“Orders increased by 15% last month compared to the previous month. Most orders were placed on weekends.” It summarizes what happened but doesn’t explain why or what to do next.
2. Diagnostic analytics: why did it happen?
This digs into the data to find reasons behind the patterns or trends observed in descriptive analytics.
“The 15% increase in orders happened because of a weekend promotion offering 20% off on pizza. Also, competitor downtime drove more users to our app.” It explains the reasons behind the observed increase (the promotion and competitor issues).
3. Predictive analytics: what will happen?
This uses patterns from past data to forecast future outcomes. Importantly, it doesn’t suggest actions—it only predicts based on trends.
“If you run a similar weekend promotion this month, orders will likely increase by 10%. If discounts on beverages are added, the average order value may increase by 20%.” It provides probable future outcomes but doesn’t tell you what to do. The decision-making still rests with you.
4. Prescriptive analytics: what should you do?
This not only predicts outcomes but suggests specific actions to achieve optimal results. It combines prediction with actionable recommendations.
“To maximize revenue, allocate a $5,000 budget to run a weekend ad campaign offering a 15% discount on desserts. Use push notifications at 6 PM to drive engagement.” It goes beyond predicting and tells you exactly what steps to take for the best results.
All four types of analytics—descriptive, diagnostic, predictive, and prescriptive—are most effective when tied to a specific business problem.
Analytics doesn’t exist in isolation; it aims to provide clarity, insights, and actions to resolve challenges or seize opportunities.
That’s why following a clear framework for addressing business problems through analytics is crucial. Let’s talk about one in the following section.
A framework to use mobile analytics
Mobile analytics insights become valuable as soon as you make your app live.
Early data tracking allows you to uncover your app’s strengths and weaknesses, helping you make informed improvements.
It also provides a clear view of your progress and growth as a company over time.
Analyzing your mobile app involves a structured process that blends quantitative and qualitative data. Here’s an expanded guide with an added focus on defining measurable metrics:
1. Identify the business problem
Start by pinpointing the specific issue you want to address. Without a clear problem, analysis can become unfocused.
A fitness mobile app notices that users download the app but do not complete any workouts after onboarding. The business problem is low engagement and retention among new users.
Defining the problem helps prioritize where to focus efforts.
Make sure what you notice is a problem you should be solving. Benchmarking helps here.
Let’s understand with an example. Retention rates differ across industries—business and shopping apps tend to retain users longer than leisure or tourism apps.
For instance, if the average retention rate in your industry is 30% but your app’s retention rate is only 10%, it signals a potential issue.
But you need to rethink if you are already at 40%, outperforming the competition, and think it is low.
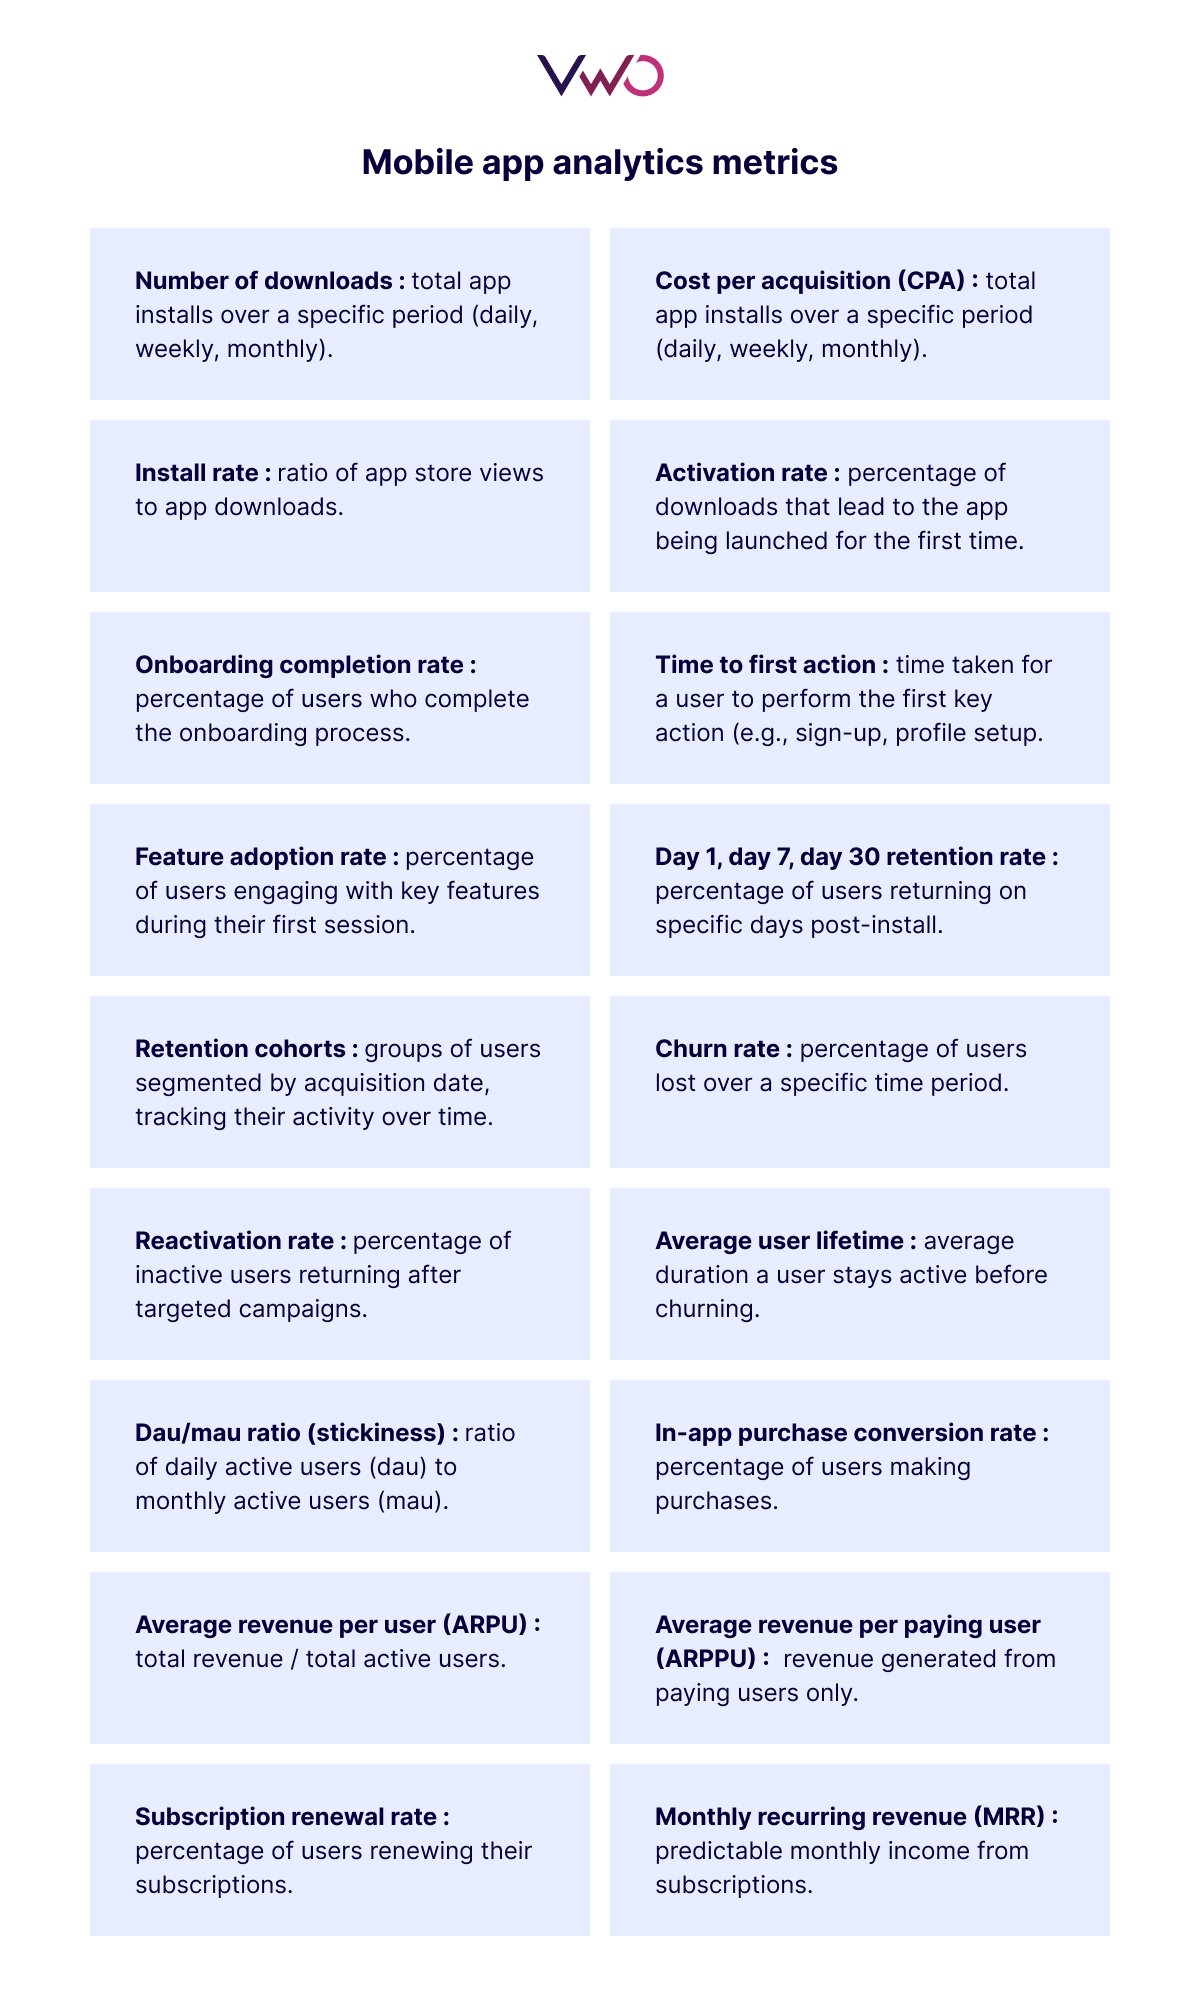
2. Add metrics to the business problem
Attach measurable metrics to track progress for every problem identified. This ensures clarity about what needs improvement and provides a baseline.
Taking our previous example of the Fitness app, the following metrics might be useful
- Onboarding Completion Rate: Percentage of users completing the onboarding flow.
- First Week Retention Rate: Percentage of users opening the app after their first week.
- Workout Completion Rate: Number of users completing their first workout session.
Metrics transform abstract problems into actionable, measurable goals.
3. Develop questions to solve the business problem
Formulate questions that guide your data collection and help diagnose the root cause. Here are a few examples. If you are:
trying to identify user engagement patterns,
- What times of day show the highest user activity?
- How frequently do users return to the app within a week?
assessing feature effectiveness,
- Which features lead to higher user retention?
- Are there features that users access once and then abandon?
understanding user demographics,
- What are the age groups of our most active users?
- Do usage patterns differ between geographic regions?
evaluating user acquisition channels,
- Which marketing channels bring in users who stay active?
- Are there acquisition sources linked to higher churn rates?
analyzing in-app purchase behavior,
- What percentage of users make in-app purchases?
- Which items are purchased most frequently?
These questions ensure your analysis stays focused and targeted.
4. Track & analyze data
A key best practice before analyzing is to track user behavior using both quantitative and qualitative data for a comprehensive understanding. Each type of data plays a unique role.
Quantitative data:
- Event tracking shows where users drop off during onboarding. What was the last event triggered?
- Funnels measure the percentage of users completing key actions like goal-setting.
- Cohort analysis tracks user retention trends over time.
Qualitative data:
- Heatmaps show which parts of the app users interact with most.
- Session recordings highlight where users hesitate or encounter issues.
- User feedback uncovers specific frustrations or suggestions.
Examine patterns and trends in the data to uncover the root causes of the problem.
The fitness app notices from event tracking that 40% of users drop off at the “Set Your Goals” screen.
Session recordings reveal that users don’t understand how to select options effectively.
Combining both data types ensures you understand both what is happening and why.
5. Draw conclusions
Summarize findings to propose solutions or next steps.
The fitness app concludes that simplifying the goal-setting process and making the “Help” button more prominent will improve onboarding completion rates and app engagement.
Conclusions bridge the gap between analysis and action.
6. Test and learn
Implement changes based on your findings and measure their impact. This iterative process ensures continuous improvement.
The app redesigns the onboarding flow, reduces steps, and renames the “Help” button to “Need Assistance?” Post-launch analysis shows a 20% increase in onboarding completion and a 15% boost in first-week engagement.
Testing ensures that improvements are data-driven and effective.
Key things to remember
Focus on relevant metrics
Not all metrics are equally useful, so focus on those directly influencing your app’s goals.
For example, if your app’s core goal is improving user engagement, you can prioritize metrics like Daily active users (DAU), feature adoption rate, or session duration.
Avoid vanity metrics such as total app downloads, which don’t provide actionable insights into user behavior.
For example, a fitness app may track the percentage of users who complete at least three workouts a week.
If the goal is to drive long-term fitness habits, this metric aligns with the app’s mission and helps measure success more meaningfully than total downloads.
The app can tweak features like workout reminders or gamification to boost engagement by identifying a drop-off in workout sessions.
Cohort analysis
Segment your users into cohorts based on shared characteristics such as signup date, geography, or usage behavior.
Analyze each group’s behavior to understand retention trends, feature adoption, and spending habits.
A food delivery app might find that users who place their first order within a day of downloading have a higher retention rate than those who wait longer.
To capitalize on this insight, the app can offer limited-time discounts or free delivery for first-time users who order within the first 24 hours.
Cohort analysis also helps uncover regional preferences—like users in one city preferring healthy options while others favor fast food—enabling the app to customize promotions accordingly.
Listen to users & continuously optimize
Leverage user feedback alongside data insights to refine your app continuously. Conduct A/B testing to validate changes and measure impact.
Integrate an A/B testing tool like VWO to test user flows, UI elements, algorithms, and more.
The updated features that users value most address common pain points quickly.
A language learning app may notice complaints about its progression in lesson difficulty.
Session recordings reveal that new users struggle with advanced vocabulary in the early stages.
The app improves its onboarding experience by introducing a simpler tutorial and providing adaptive lesson difficulty.
Post-update analytics might show a 25% increase in retention during the first month.
Regularly scheduled updates, like monthly feature enhancements or quarterly usability reviews, ensure your app remains competitive and relevant.
Protect user privacy
Be transparent about your data practices, offering users control over their share.
Adopt privacy-first design principles by minimizing data collection to only what is necessary for the app to function effectively.
A financial management app requires sensitive user data like income and expenses.
To build trust, the app clearly explains why this data is collected (e.g., to provide budgeting insights) and encrypts sensitive information to prevent breaches.
Users can also delete their data anytime, ensuring compliance with regulations like GDPR.
Proactively communicate updates to your privacy policies and include a dashboard for users to review or modify their permissions.
Building trust can increase user satisfaction and retention, as users feel secure using your app.
By applying these principles—tracking meaningful metrics, segmenting users with cohort analysis, iterating based on feedback, and prioritizing privacy—you can create a user- and data-driven app.
This approach not only keeps users happy but also ensures long-term business growth.
Mobile analytics tools you can use
Firebase (with Google Analytics)
Firebase is a comprehensive and free platform offering a suite of tools beyond analytics, including crash reporting and performance monitoring. Its seamless integration with other Google services makes it an all-in-one app development and management solution, especially for those already within the Google ecosystem.
Mixpanel
Mixpanel specializes in detailed event-based tracking, allowing you to understand user actions and optimize conversions. Its advanced segmentation capabilities enable personalized user experiences and targeted marketing campaigns.
Amplitude
Amplitude focuses on product intelligence and provides deep behavioral analysis and cross-platform insights to help you build better products. It empowers data-driven decision-making for product roadmaps and feature prioritization.
AppsFlyer
AppsFlyer excels in mobile attribution and marketing analytics, accurately measuring campaign performance and optimizing user acquisition. Its fraud prevention tools protect your budget and ensure accurate data for informed marketing spending decisions.
Countly
Countly is an open-source platform offering complete control over your data and unlimited access. Its comprehensive suite of tools eliminates the need for multiple platforms, making it a cost-effective solution for businesses prioritizing data privacy and customization.
Moengage
Moengage is a customer engagement platform that leverages real-time insights to drive personalized user experiences across multiple channels. It helps you understand customer behavior, segment audiences effectively, and optimize communication for increased engagement and retention.
VWO
VWO focuses on qualitative data, providing session replays and heat maps to visualize user behavior and identify pain points within the app. This allows for a deep understanding of user interactions and facilitates targeted improvements to the user experience. Request a demo today.
Wrapping up
Your success hinges on more than just downloads. It’s about creating meaningful, data-driven experiences that keep users engaged and coming back.
Mobile analytics empower you to make informed decisions, improve user satisfaction, and drive business growth.
Whether you’re enhancing app onboarding, boosting retention, or maximizing revenue, app analytics provides the clarity to act with purpose.
Remember to focus on relevant metrics, respect user privacy, and iterate continuously. With the right approach, your app can survive and thrive in the app economy.
Start leveraging mobile analytics today and turn your app into a success story.





![7 Top Performance Reporting Software in 2026 [Expertly Curated] + How to Choose the Best](https://static.wingify.com/gcp/uploads/sites/3/2025/04/Feature-image-7-Top-Performance-Reporting-Software-How-to-Choose-the-Best-One.jpg?tr=h-600)
![5 Best Free App Analytics Tools in 2026 to Boost App Performance [Research-Backed Picks]](https://static.wingify.com/gcp/uploads/sites/3/2025/04/Feature-image-5-Top-App-Analytics-Tools_-Solutions-to-Improve-Your-App-Performance.jpg?tr=h-600)


