The Hidden Metrics That Drive Growth: Complete Funnel Visibility for SaaS, Finance & Retail
Conversion tracking has evolved. It’s no longer just about how many people click CTA buttons.
Successful businesses need granular visibility into each stage of their conversion funnel, from the moment a visitor lands on their site to their long-term retention as a loyal customer.
Why?
Because growth isn’t won at a single step, it’s the outcome of dozens of micro-decisions users make across the funnel.
Yet, only 26% of businesses effectively track lead journeys from first touch to final purchase. This blind spot isn’t just a measurement failure. It’s actively undermining your revenue performance.
The result?
Optimization efforts that deliver incremental gains instead of creating a substantial impact.
This guide shows you how to fix that. Learn which metrics truly move the needle across the funnel, tailored for three key industries, and how VWO helps you capture and act on them effortlessly.
Industry-specific metrics that drive growth
Every industry has a different funnel and faces unique challenges in its conversion pathways. So the metrics you track and where you track them need to align with your user journey.
1. SaaS
The standard SaaS user flow generally looks like this:
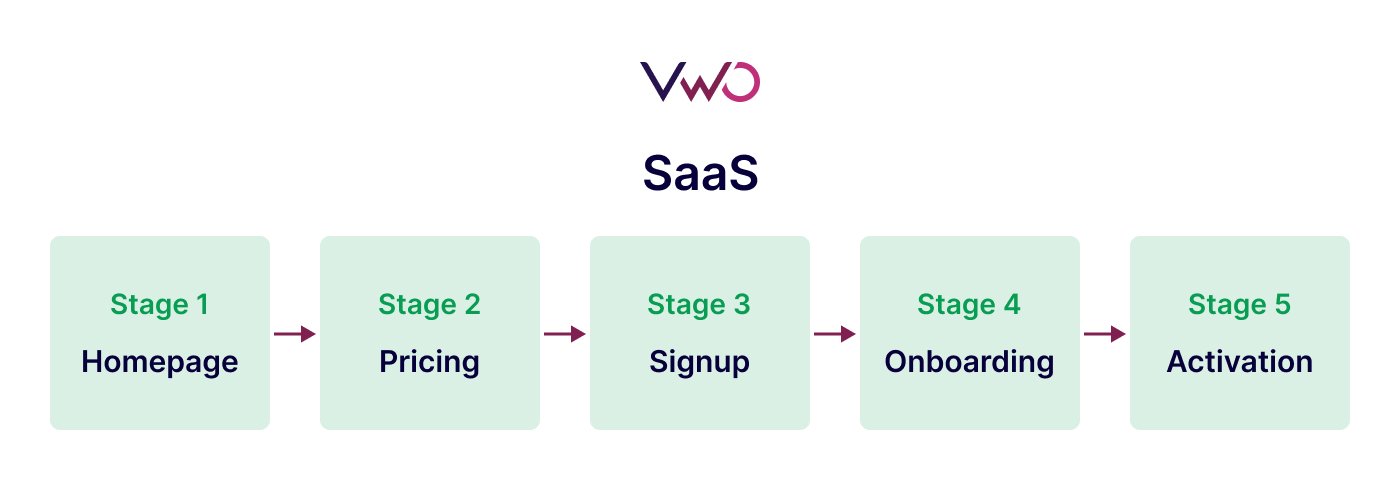
Stage 1 – Homepage
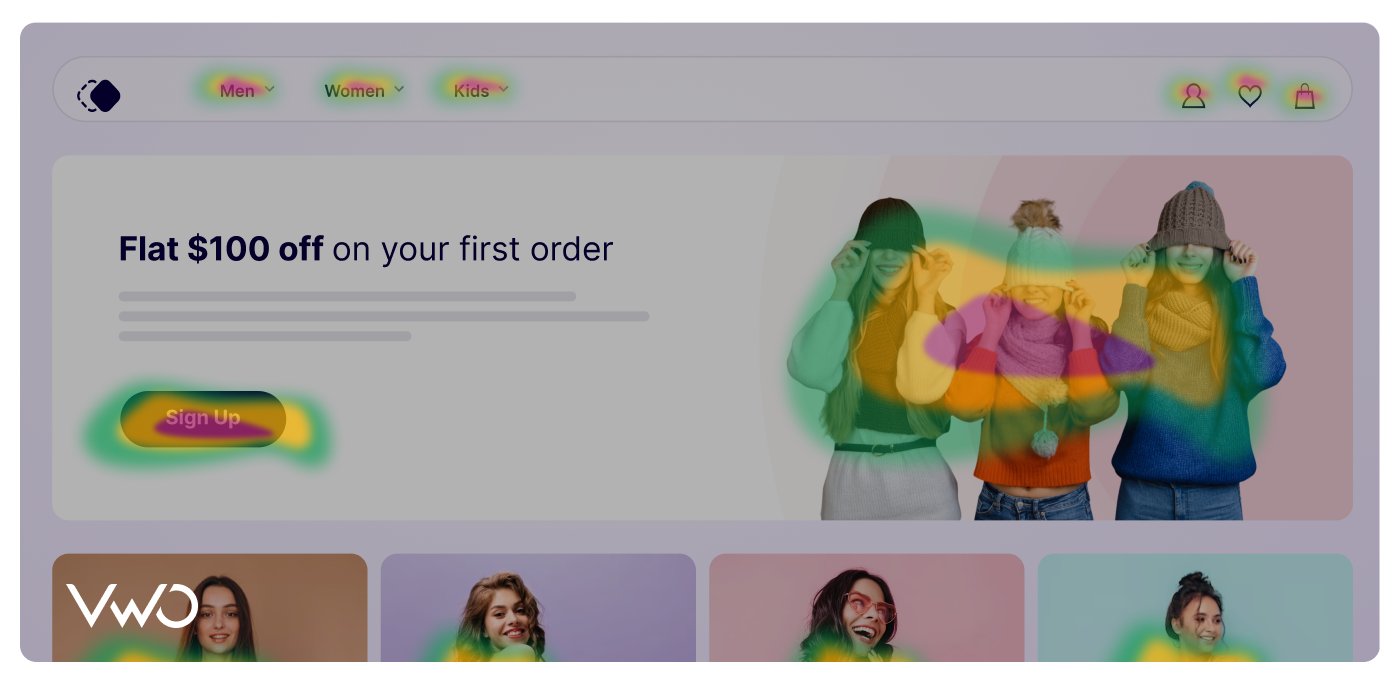
Primary metric: CTA click-through rate
What it measures: The percentage of visitors who click on primary call-to-action buttons (such as “Get Started,” “Try Free,” or “See Pricing”).
Why it matters: This metric reveals how effectively your homepage communicates your value proposition and drives visitor engagement. A high click-through rate signals strong message-market fit and user intent, while a low one could indicate friction, confusion, or weak positioning.
After landing on your homepage, curious users often take the next logical step, i.e., checking your pricing. This makes the pricing page a critical moment, where clarity, value framing, and trust can make or break their decision.
Stage 2 – Pricing
Primary metric: Sign-up rate
What it measures: The percentage of pricing page visitors who initiate signup.
Why it matters: Since people often compare options with several tabs open, your pricing page must go beyond simply listing plans. It needs to clearly justify the value, remove hesitation, and make signing up feel like a confident next step. Improving this rate means more of your high-intent visitors are choosing you instead of moving on.
Stage 3: Sign-up page
Primary metric: Form submissions
What it measures: How many users successfully complete and submit the form.
Why it matters: Form submissions are a direct signal of user intent and a critical step in lead generation. While additional fields can lower completion rates by up to 13% per field, not all fields can be removed. The key is to continuously analyze and optimize your forms to balance data collection with user experience.
Stage 4: Onboarding
Primary metric: Onboarding completion rate
What it measures: The percentage of new users who successfully complete all core onboarding steps
Why it matters: Onboarding is the user’s first real interaction with your product’s value. A higher onboarding completion rate often leads to stronger trial-to-paid conversions, better early retention, and higher lifetime value. Drop-offs at this stage usually signal friction, whether from a confusing flow, unclear value delivery, or excessive effort. Improving onboarding directly impacts early retention, conversion rates, and lifetime value.
Stage 5: Activation
Primary metrics
- Feature adoption rate: Percentage of users engaging with core product features within a defined time period (typically the first week or two).
- Trial-to-paid conversion: Percentage of trial or freemium users who convert to paid customers
Why they matter:
The activation stage is when users experience your product’s core value. It’s the turning point between casual exploration and meaningful engagement. High feature adoption rates signal product stickiness and are strong predictors of long-term retention.
Trial-to-paid conversion rate, on the other hand, reflects how well your product delivers on its initial promise. It directly affects revenue growth and customer acquisition efficiency, making it a key signal of product-market fit.
2. Finance
A digital banking or lending funnel is usually mapped out like this:
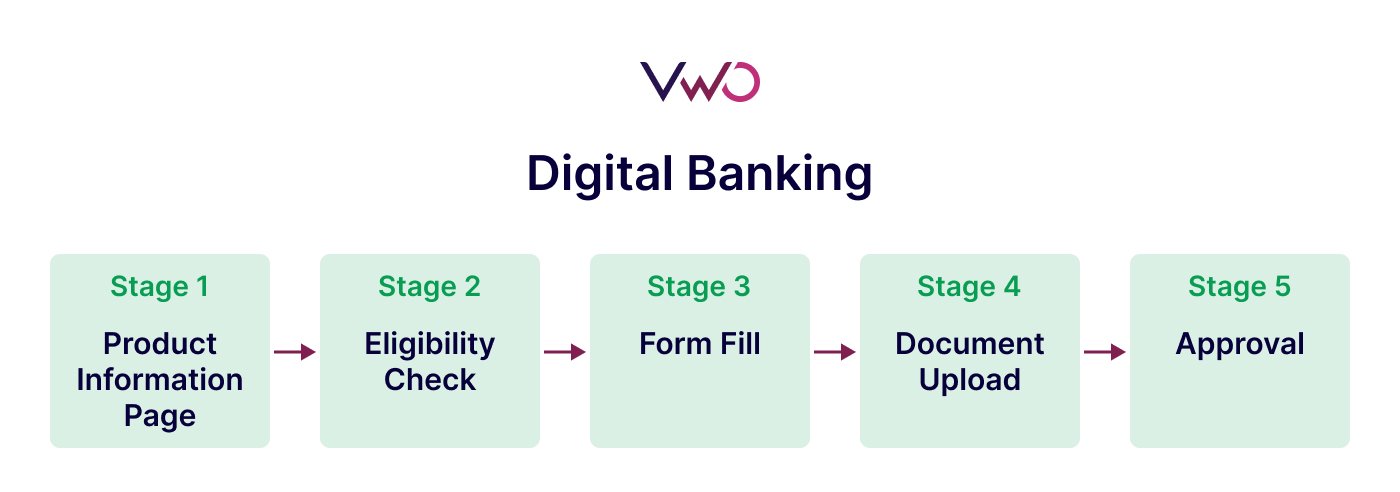
Stage 1: Product information page
Primary metric: Eligibility check initiation
What it measures: Tracks the percentage of product page visitors who begin the eligibility assessment process.
Why it matters: Initiating an eligibility check is a strong signal of intent. It means the user is considering your offering seriously enough to explore if they qualify. If this rate is low, it often points to confusion, lack of clarity around benefits, or hesitation rooted in perceived complexity or commitment.
Stage 2: Eligibility check
Primary metric: Pre-application continuation rate
What it measures: The percentage of eligible users who proceed to the formal application after completing the eligibility assessment.
Why it matters: This metric helps you identify whether your funnel is losing high-potential applicants due to poor UX or misaligned messaging. Closing this gap turns qualified interest into real conversion momentum. It also ensures your acquisition efforts don’t go to waste by catching drop-offs when users are already halfway invested.
Stage 3: Form fill
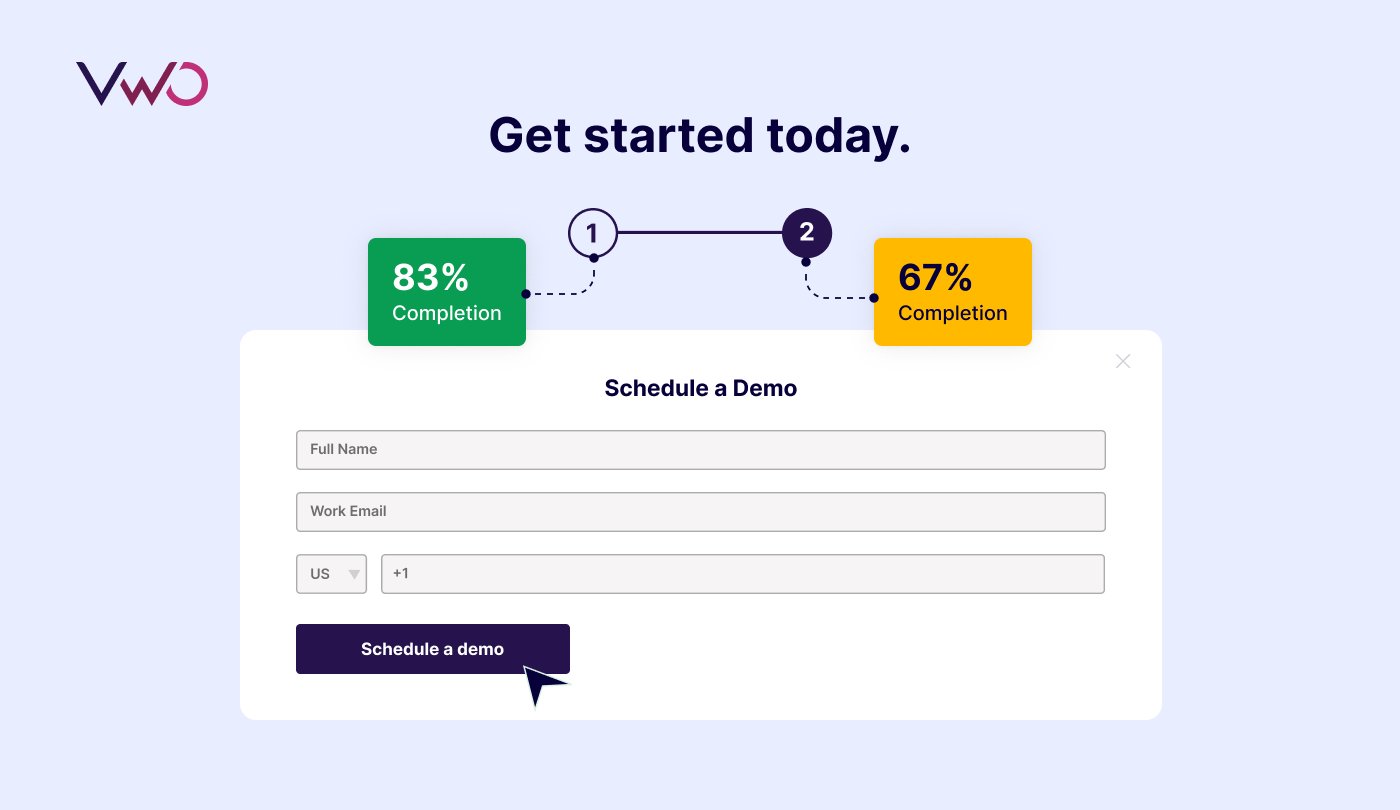
Primary metric: Form completion rate
What it measures: The percentage of started applications that reach the submission stage.
Why it matters: Since financial applications often require detailed personal and financial information that users may not be comfortable sharing, drop-offs are more common.This metric helps identify specific form elements causing friction and abandonment, which directly impacts customer acquisition.
Stage 4: Document upload
Primary metric: Documentation completion rate
What it measures: The percentage of applicants who successfully upload all required documents.
Why it matters: Document collection is often the most friction-heavy part of financial applications, yet it’s critical for compliance and approval. This metric helps identify opportunities to streamline document submission while maintaining necessary verification.
Stage 5: Approval process
Primary metrics:
- Time-to-completion: Average time from application submission to final decision/approval.
- Credit approval rate: Percentage of completed applications that receive approval for the requested financial product.
Why they matter:
Time-to-completion metric is crucial because speed plays a major role in user experience and conversion.
When customers are comparing financial products, a quicker decision-making process keeps them engaged and less likely to abandon or switch providers. Tracking this metric helps highlight friction points that can be optimized—whether through faster verification, clearer documentation requirements, or improved internal workflows.
The final credit decision is the responsibility of the bank, based on its risk policies and underwriting standards. However, this metric still offers important insight into how well marketing efforts are attracting qualified applicants.
A low approval rate often points to poor alignment between acquisition and credit teams and can indicate issues with targeting, messaging, or eligibility screening. Understanding this rate enables better coordination across teams and more efficient customer acquisition.
3. Retail
The typical online shopping journey consists of the following stages:
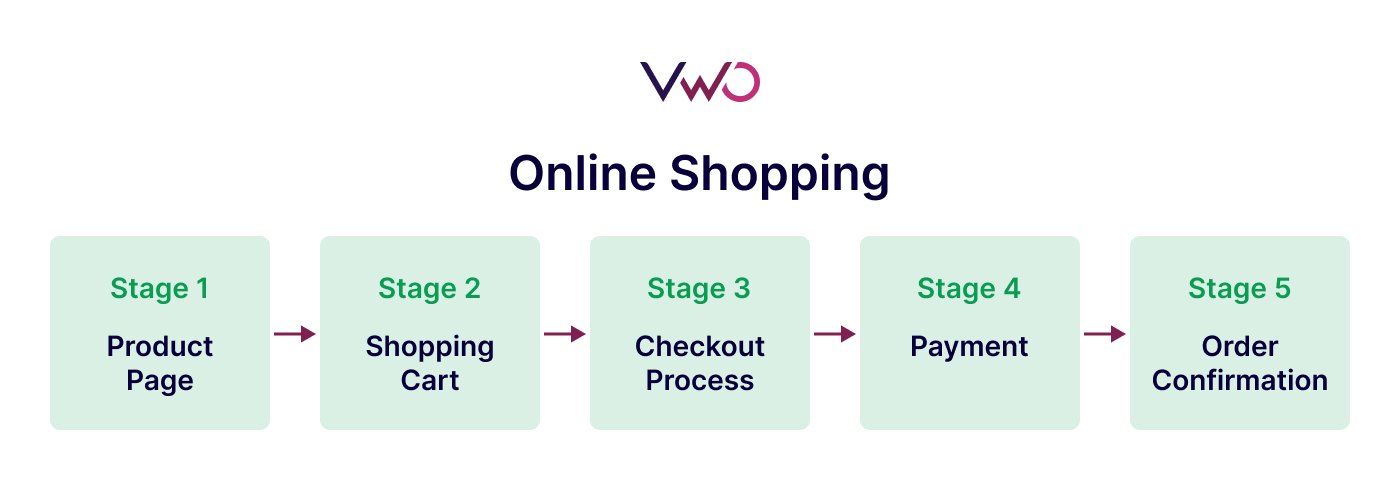
Stage 1: Product page
Primary metric: Add-to-cart rate
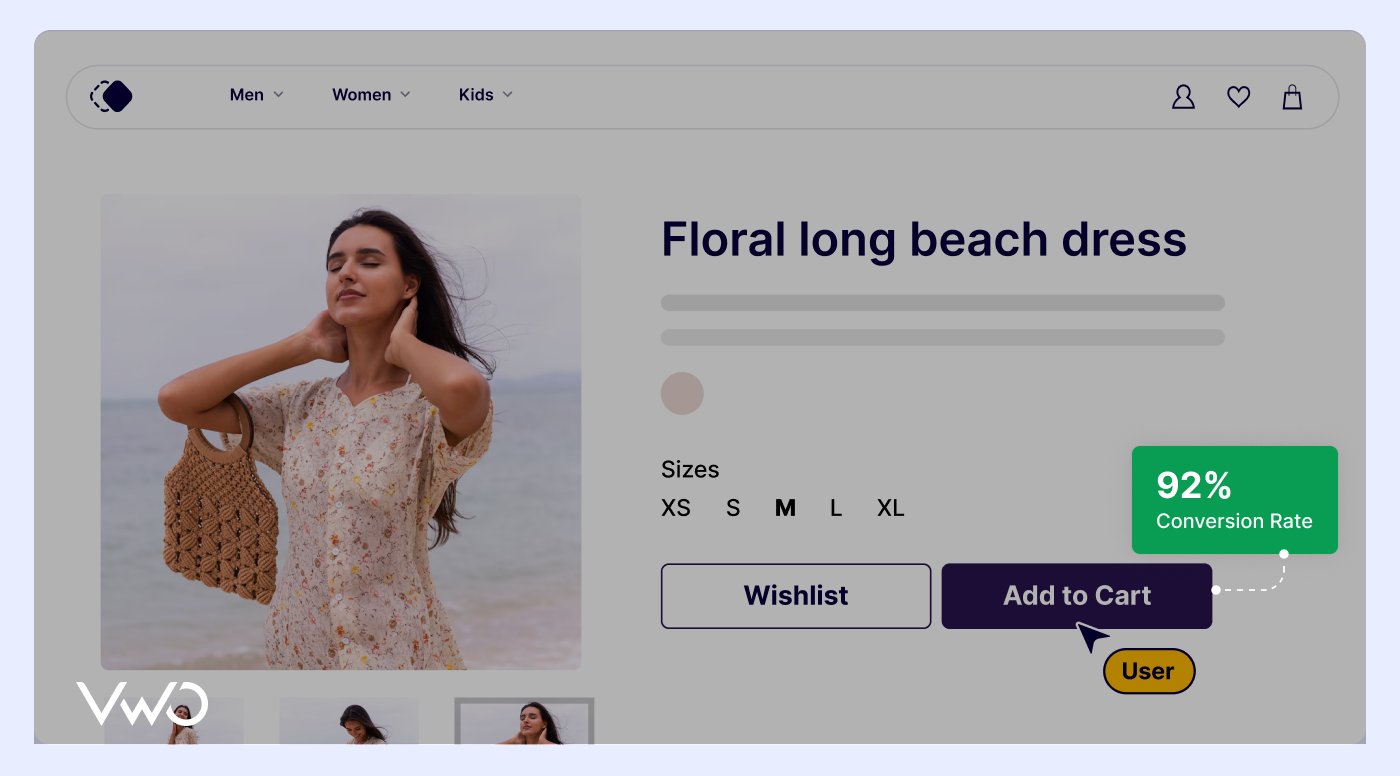
What it measures: The percentage of product page visitors who add the item to their shopping cart.
Why it matters: Add-to-cart rate reflects how well your product page builds trust and drives intent. It captures user motivation in real-time. When it dips, it often signals friction in pricing, messaging, or visuals. Optimizing this rate not only boosts sales opportunities but also improves the efficiency of remarketing and downstream funnel performance.
Stage 2: Shopping cart
Primary metric: Checkout initiation rate
What it measures: The percentage of cart sessions that proceed to checkout by clicking “Proceed to Checkout” or similar CTAs.
Why it matters: Checkout initiation is a key moment of purchase intent. A low rate often signals hesitation, triggered by surprise costs, lack of trust badges, or inconvenient shipping details. Improving this metric means reducing uncertainty and reaffirming value, which directly boosts conversion rates and lowers cart abandonment.
Stage 3: Checkout process
Primary metrics:
- Checkout step progression: Percentage of users who advance through each step of the checkout process.
- Shipping method selection: Breakdown of shipping options selected by customers during checkout and the impact of these choices on conversion.
Why they matter: Each additional step in the checkout process creates potential for abandonment. This metric helps identify specific friction points in the purchase process, enabling targeted improvements.
Shipping method selection directly impacts customer satisfaction, operational costs, and margin. This metric helps identify opportunities to better align shipping options with customer preferences and business needs.
Stage 4: Order & Payment completion
Primary metric:
Payment completion rate: Percentage of users who successfully complete payment after reaching the payment page.
Why it matters:
Abandonment at the payment stage represents the most costly conversion loss. Users have demonstrated high purchase intent by proceeding through the entire funnel. Measuring this metric helps uncover issues like trust concerns, payment failures, or last-minute hesitation, giving you a chance to fix what matters most when intent is highest.
Secondary metric:
Promo code utilization rate: Percentage of checkouts using promotion codes, discounts, or special offers.
Why it matters:
Promotional offers are powerful tools for driving conversions, but their effectiveness depends on visibility, relevance, and ease of use. This metric helps evaluate promotion strategy and identify opportunities to drive higher value conversions.
Stage 5: Order confirmation and post-purchase
Primary metric: Return customer rate
What it measures: The percentage of customers who make a repeat purchase within a defined period (typically 90 days).
Why it matters: Returning customers have higher conversion rates and higher average order values. A high return customer rate signals strong post-purchase experiences, trust, and brand affinity. Improving this metric means you’re not just acquiring customers but building lasting relationships that lower acquisition costs and boost lifetime value.
Success story: 125% conversion increase and 18X ROI
Flos USA, a premium lighting retailer, boosted their eCommerce performance by implementing complete funnel visibility. Rather than building an internal optimization team, Flos partnered with VWO to implement a data-driven strategy across their entire funnel:
Homepage > Listing Page > Product Page > Cart Page > Checkout
Using heatmaps, scrollmaps, and session recordings, they optimized each funnel stage. They ran 30 A/B test campaigns over 17 months, focusing on key metrics at every stage. The results were extraordinary:
- Homepage: 6.77% more category visits through better navigation
- Listing page: 47% more orders and 86% higher revenue with strategic CTAs
- Product page: 19.35% more add-to-cart actions with clearer color options
- Cart page: 36.97% higher add-to-cart rate through simplified information
These data-driven optimizations culminated in a 125% increase in checkout conversion rate and delivered an 18X ROI for Flos USA.
How VWO makes metric tracking powerful yet simple
VWO offers complete funnel tracking. Here’s how:
1. Track complete user journeys with funnels
VWO funnels visualize every step users take from first interaction to final conversion.
For example, in a funnel like,
Goal A → Goal B → Goal C → Goal D
- Visitors must complete each step sequentially to be counted as converted.
- Skipping any step marks them as dropped off.
- Each step can be treated as a goal that visitors must perform to complete website actions.
- You can apply filters like date ranges, revenue thresholds, or visitor segments to narrow down the data.
This gives clear visibility into which parts lose users and where to focus optimization efforts.
All funnels live in a centralized dashboard for easy management and monitoring with consolidated performance views.
Funnel reports display conversion rates, drop-off points, and performance trends, with clickable access to heatmaps and session recordings. You can filter these reports by date and segments to spot trends across specific cohorts. You can even log observations directly using the built-in “eye” icon when analyzing reports.
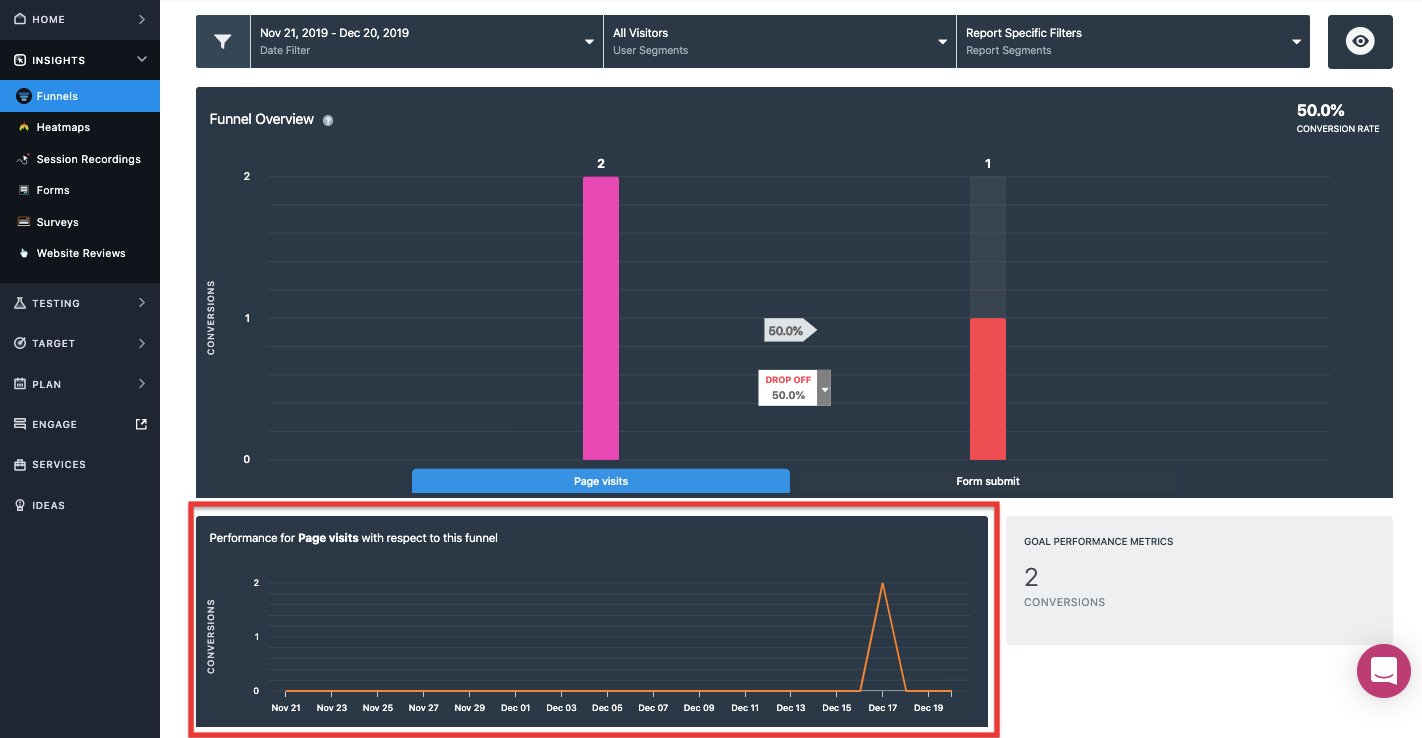
The funnel overview chart provides clear performance snapshots, visualizing user flow through each step. The funnel reports show goal performance metrics with day-by-day breakdowns over time.
Learn to create your VWO funnel with a step-by-step guide.
2. Track individual interactions through behavior analytics
Once you know where users are dropping off in the funnel, the next step is understanding why.
VWO helps you dig deeper into user behavior by tracking every interaction leading up to that exit point. You can track clicks, scrolls, rage clicks, form hesitations, and more across web and mobile experiences.
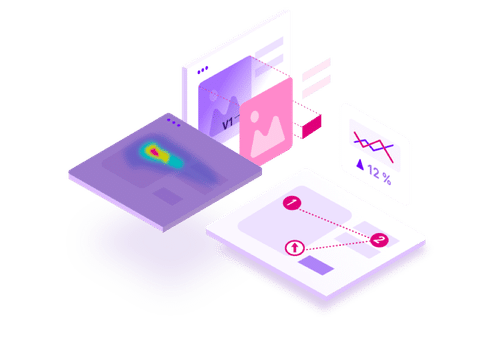
- Session recordings show real user journeys filtered by funnel stage or traffic segment.
- Heatmaps reveal high-attention zones, ignored CTAs, and confusing layouts
- Form analytics uncovers friction-heavy fields like mobile number inputs or re-entries.
Additionally, the Insights dashboard adds crucial behavioral context with automated page analysis and behavioral scores like Experience and Friction. These scores flag friction-heavy zones caused by rage clicks or dead clicks.
Instead of manually stitching together insights from heatmaps and session recordings, VWO Copilot automatically analyzes behavioral data to highlight what’s causing users to drop off. It suggests specific testing ideas that directly address friction points. It also provides AI-suggested metrics to automatically identify the most impactful KPIs for your campaign success.
3. Comprehensive conversion tracking
VWO lets you track everything from standard metrics like page visits and button clicks to behavioral indicators like image hovers and video plays. You can measure conversion using unique visitors, interaction counts, or revenue-based custom values.
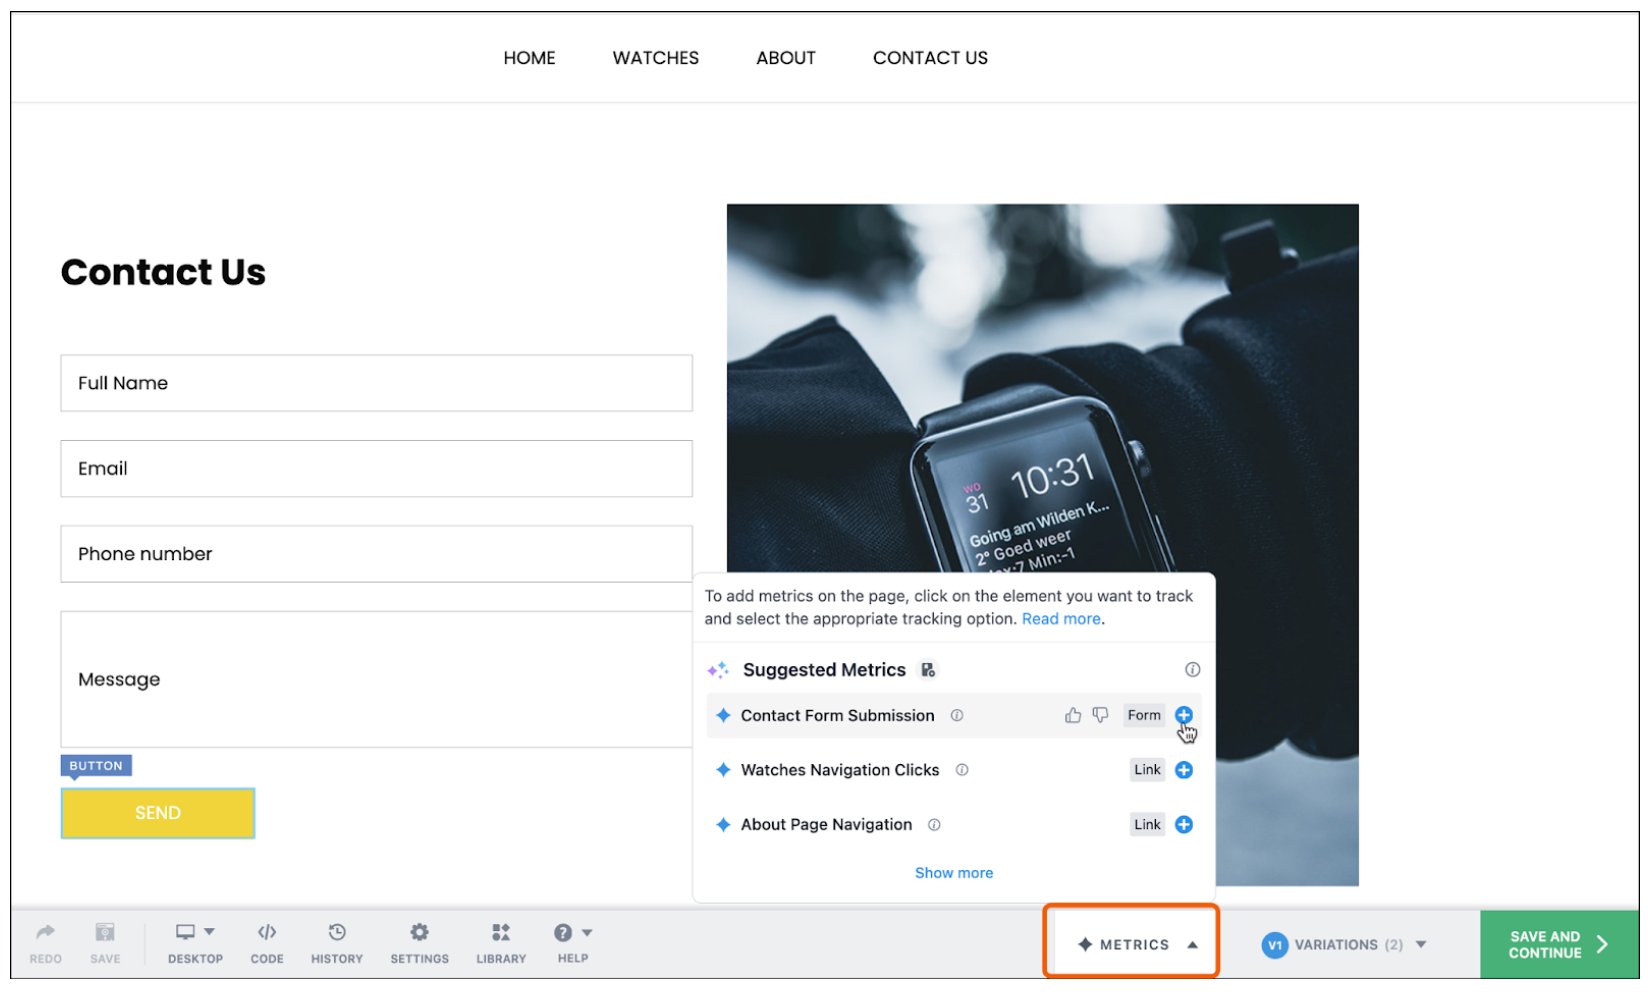
With the VWO Visual Editor, you can make design changes, like updating copy or CTAs, and instantly attach measurable goals to them. This ties every design update to a clear outcome.
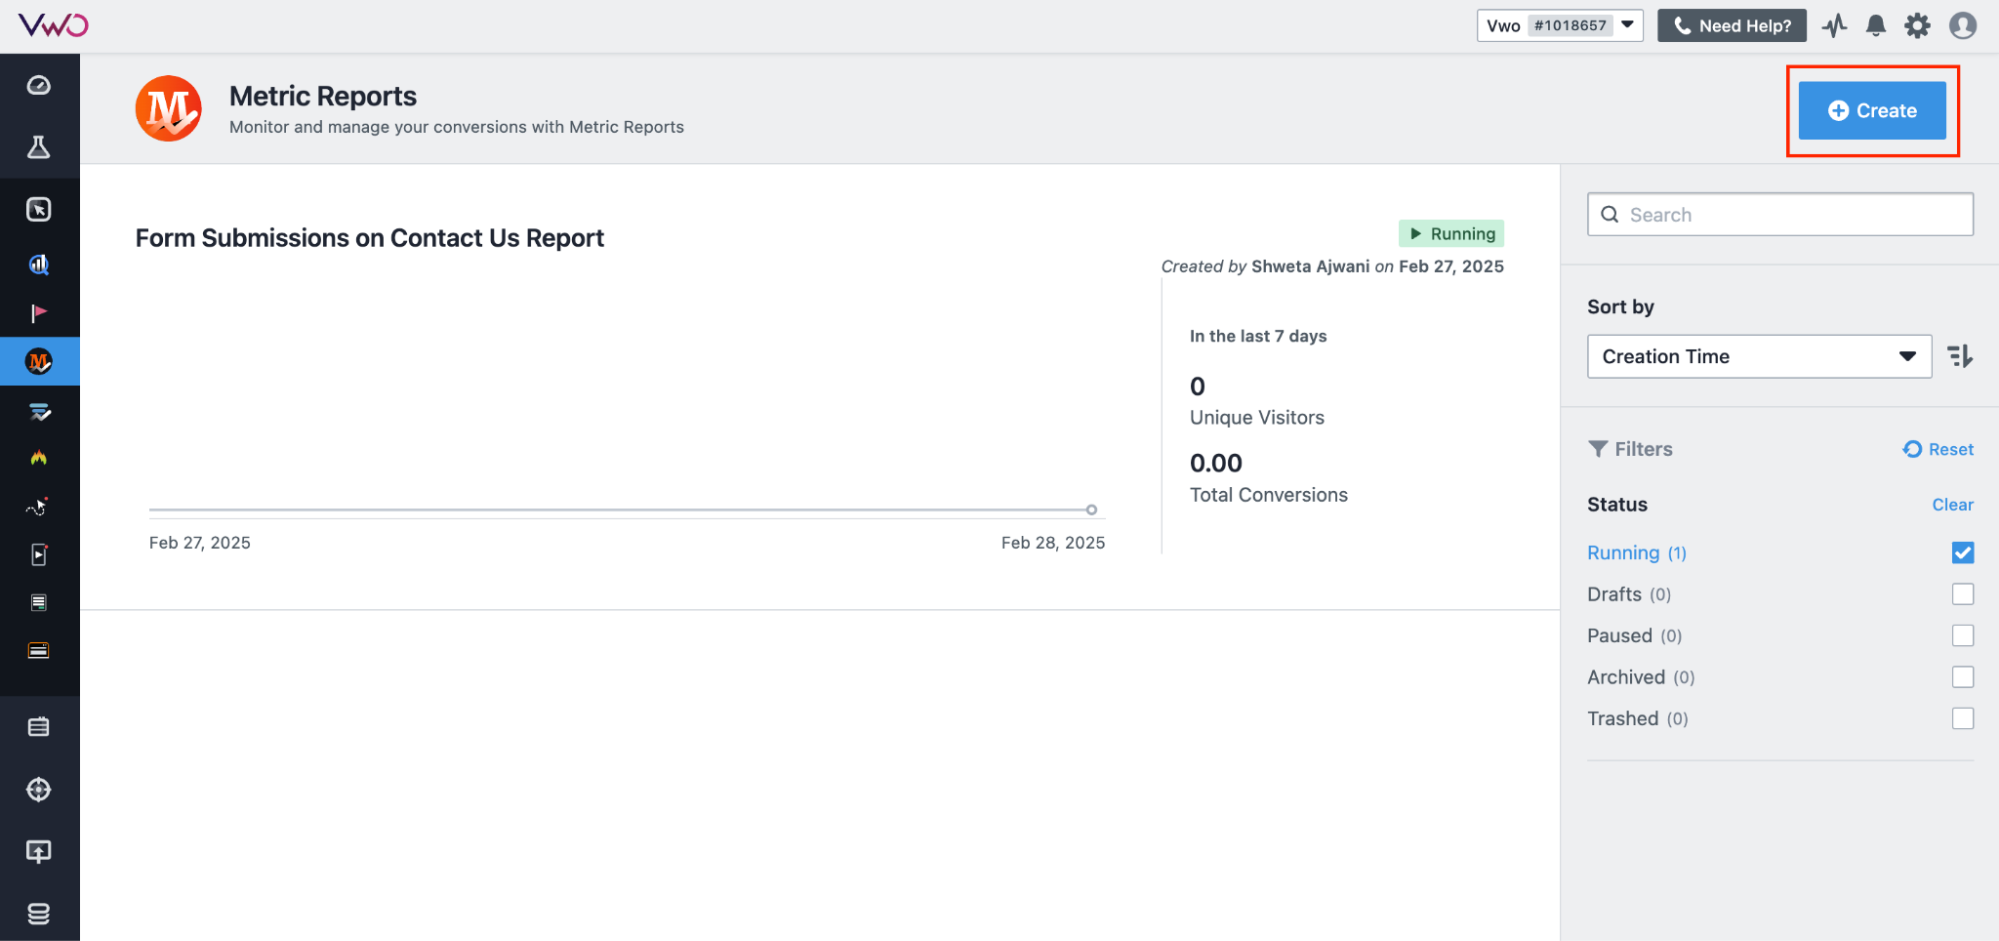
Finally, to bring it all together, VWO Metric Reports (currently in early access) offer a unified way to track and analyze standard, custom, and calculated metrics like revenue. These reports integrate seamlessly with heatmaps, session recordings, and funnels to provide deeper behavioral insights. This helps businesses identify trends, friction points, and optimization opportunities. To learn more, refer to this article.
Putting it all together
Complete funnel visibility gives you the power to optimize each stage of your customer journey, not just the final conversion point. By tracking these industry-specific metrics at each funnel stage, you’ll be able to identify exactly where visitors get stuck or drop off and prioritize optimization efforts based on impact potential. Because ultimately, funnel optimization is experience optimization, and great experiences drive business outcomes.
VWO makes implementing this comprehensive tracking simple and accessible. Start your free VWO trial today!
Categories: