What’s really happening on your website? How do customers interact with your content? Where are users clicking, dropping off, or getting stuck before converting?
The best part is, you don’t need expensive software to find out.
With the right free website analysis tool, you can uncover powerful insights, improve UX, and boost engagement—all without breaking the bank.
In this blog, we’ve handpicked eight free tools that help you track, test, and optimize your site’s performance.
Ready to find the one that fits your goals? Let’s dive in.
What are website analysis tools?
Website analysis tools evaluate, monitor, and optimize website performance across various metrics. These tools provide insights into how websites function, how users interact with them, and how they perform in search engines and competitive markets.
The primary capabilities include:
Traffic and performance analytics (page load speed, uptime, mobile responsiveness, traffic sources)
User behavior and experience analytics (session recordings, heatmaps, click tracking, conversion funnels)
SEO and competitive analysis (keyword tracking, backlink monitoring, competitor benchmarking, search visibility)
They enable businesses to analyze traffic patterns, user engagement, content effectiveness, and technical health of their websites through comprehensive data collection and reporting.
These tools transform complex website data into actionable insights that help improve user experience, increase search visibility, and optimize conversion rates for better business outcomes.
For teams that want to start with a structured review of their website’s usability, VWO AB Tasty offers a Website UX Audit tool that surfaces friction points and experience gaps without any cost or commitment.
How we evaluated these tools
This guide covers eight tools that represent the most relevant free options for businesses looking to understand and improve their website performance.
Our evaluation methodology is based entirely on secondary research. Each tool was assessed using official product documentation, publicly available feature information, and third-party user reviews from sources like G2.
The order in which tools appear and the way they are described reflects only what each tool actually offers based on these sources, with no bias toward any particular platform. We recommend taking advantage of free trials wherever available before making any final commitment.
Some tools were not included because they either require upfront payment or offer only limited free trials. This guide focuses on tools that provide a free tier.
Three dimensions guided the evaluation of every tool in this guide:
Free tier: How much value the free plan provides without requiring an upgrade
Feature breadth: The range of capabilities available, including analytics, behavior tracking, and reporting
Privacy and data ownership: Whether the tool offers self-hosted options or complies with major data protection standards
Quick picks: Best free website analysis tools by use case
Here is a snapshot of the strongest option for each use case based on the 8 free website analysis tools covered in this guide.
Category
Tool
Description
Best for comprehensive website analysis
Google Analytics 4
Comprehensive traffic, acquisition, conversion tracking, and predictive analytics at zero cost
Best for privacy and data ownership
Matomo
Open-source analytics with full data ownership, unsampled data, and self-hosted option
Best for qualitative behavior analytics
VWO AB Tasty
AI-powered behavior analytics combining heatmaps, session recordings, form analytics, and experimentation in one platform
Best for SEO and competitive analysis
Ahrefs
Free SEO auditing, backlink analysis, keyword tracking, and web analytics for verified website owners
Best for developer and product teams
PostHog
All-in-one product analytics with feature flags, session replay, and error tracking on a generous free tier
Developer-first product analytics and experimentation
7
Mouseflow
User behavior and experience analytics
Session replay, six heatmap types, friction scoring, form analytics, conversion funnels, exit-intent surveys
Free forever
500 recorded sessions per month
$25/month (billed annually)
No
Behavior analytics with 100% session recording and friction detection
8
Ahrefs Free
SEO and competitive analysis
Web analytics, site audit, site explorer, backlink analysis, keyword tracking, AI content helper
Free forever
5,000 site audit crawl credits per month
$29/month
No
Free SEO auditing and competitive analysis for website owners
8 Free website analysis tools: In-depth overview
Disclaimer: The pros and cons listed are based on reviews and feedback from third-party sites such as G2, TrustRadius, and other sources.
Traffic & performance analytics tools
1. Google Analytics 4
What it does
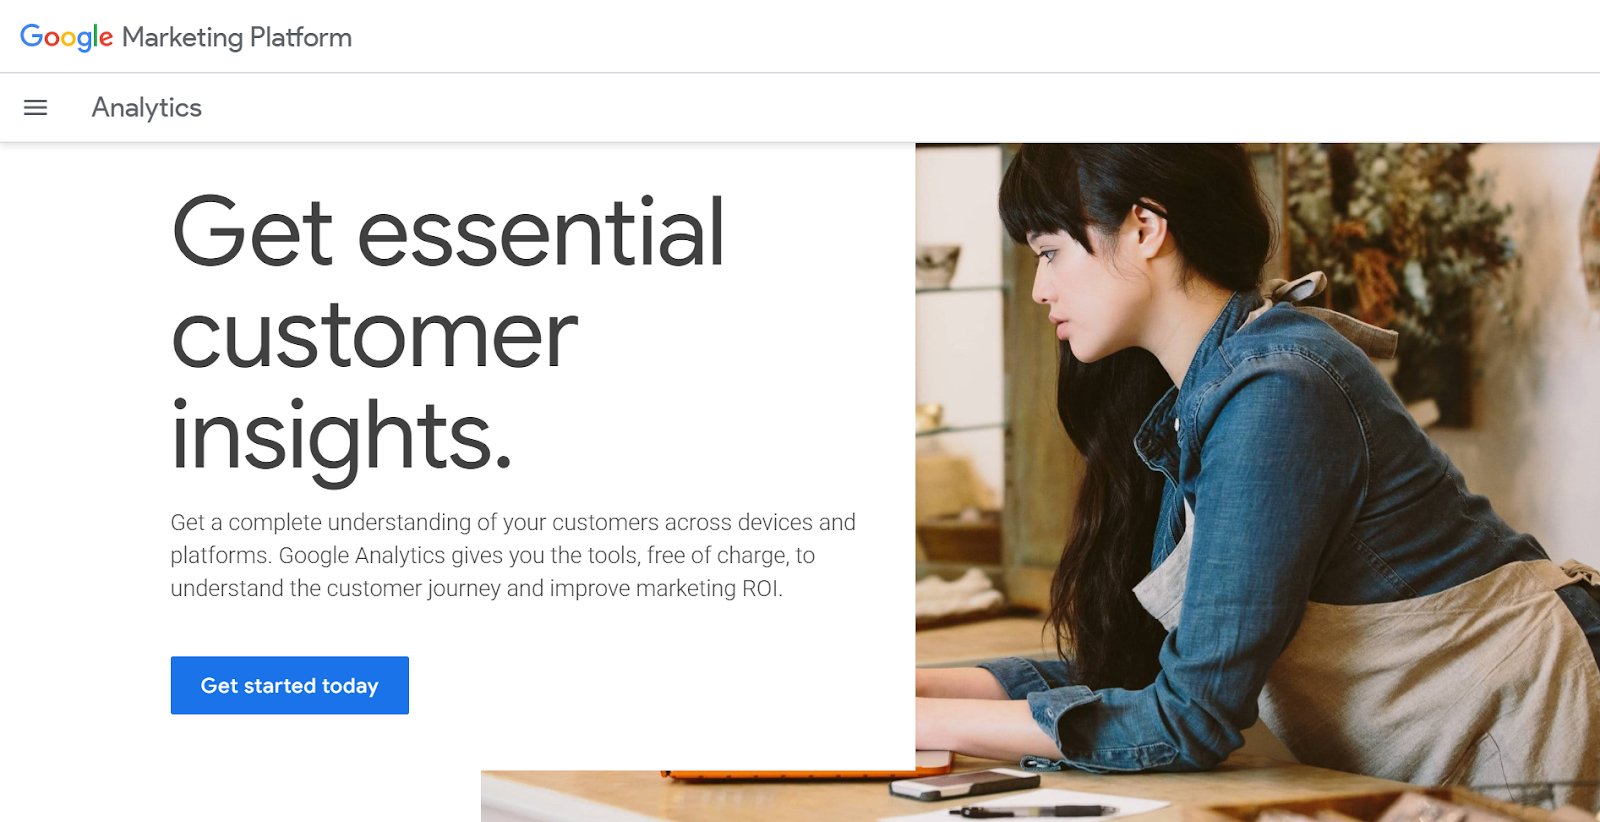
Google Analytics is a free web analytics platform that helps teams understand how users find and interact with a website or app across devices and channels. It tracks traffic sources, conversions, and user acquisition with cross-platform attribution, giving businesses a quantitative view of what is happening on their site.
Using Google’s machine learning models, it also predicts future user behavior such as purchase likelihood and churn probability, and surfaces generated insights automatically.
Key features
Real-time reporting for live visibility into traffic and user activity
User exploration through segmentation to analyze specific audience groups
Funnel analysis and path exploration to identify where users drop off during key journeys
Predictive analytics using Google’s machine learning to anticipate user behavior, including purchase likelihood and churn
Cross-channel budgeting with projection and scenario plans to forecast ROI at different spend levels
Task Assistant for guided setup and configuration recommendations based on current property setup
Engagement reports to understand how users interact with content
User and traffic acquisition reports to track where visitors come from
Cohort analysis to measure user retention and behavior over time
Integrations with Google Ads, Search Console, and other Google products
Pricing
Google Analytics 4 is available to everyone at no cost.
Google Analytics 360 starts at $50,000 per year for enterprise teams
Pros & cons
Pros
Cons
Easy to set up and use, with simple integration into websites and apps.
Setting up custom reports or tracking specific events can be a bit technical and may need developer help.
Makes it easy to identify which marketing channels bring in the most conversions and how users move through the site.
Customer support responses can sometimes take longer than expected.
A customer experience as per G2 reviews:
Easy to set up tool with customization available for the type of impressions you want to track. Easy access to reports. Integrations available to export analytics and the dashboards are also easy to comprehend – both for techies and business managers.
Laisha W. Lead ML engineer
2. Matomo
What it does
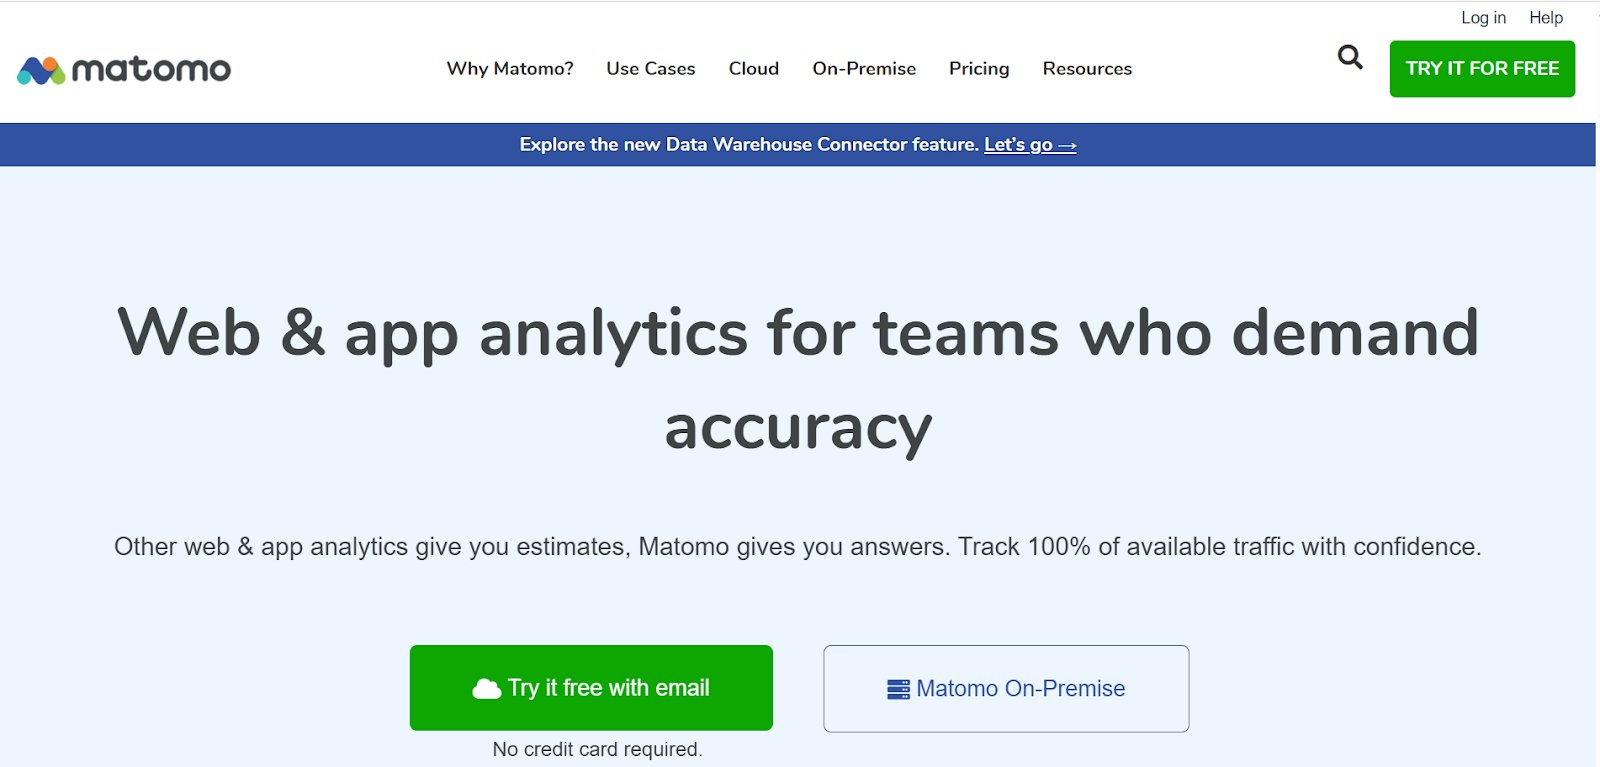
Matomo is an open-source web analytics platform that gives teams full control over their data with a strong focus on privacy and compliance. Matomo delivers unsampled, first-party data with no data loss, making it a more accurate and privacy-respecting alternative.
It offers cloud and on-premise hosting options, ensuring data is 100% user-owned and never shared with third parties, while still delivering the depth of insight needed to understand user behavior, optimize campaigns, and improve conversions.
Key features
Session recordings and heatmaps to visualize how users interact with pages
Funnel analysis and user flow tracking to identify where users drop off
User segmentation and cohort analysis for focused audience insights
Event and content tracking to monitor specific user interactions like clicks and downloads
Search engine keyword performance to understand organic traffic drivers
Form analytics to identify friction in form fields and improve completion rates
Tag Manager for flexible tracking configuration without developer dependency
Custom reports for tailored data views aligned to specific business goals
AI traffic tracking to understand how AI tools and chatbots discover and interact with your site
Pricing
Free trial: 21-day access to explore all features.
Free plan: Available for self-hosted (on-premise) setup.
Paid plan: Cloud hosting starts at $26/month or $260/year.
Pros & cons
Pros
Cons
Offers full control and flexibility, especially when hosted on a private server.
Some widgets are quite basic and don’t allow combining multiple metrics to uncover deeper user patterns.
Simple and intuitive to use, with accurate tracking and support for multiple domains.
At times, the visual dashboard may display data that doesn’t fully match what’s stored in the database.
3. Clicky
What it does
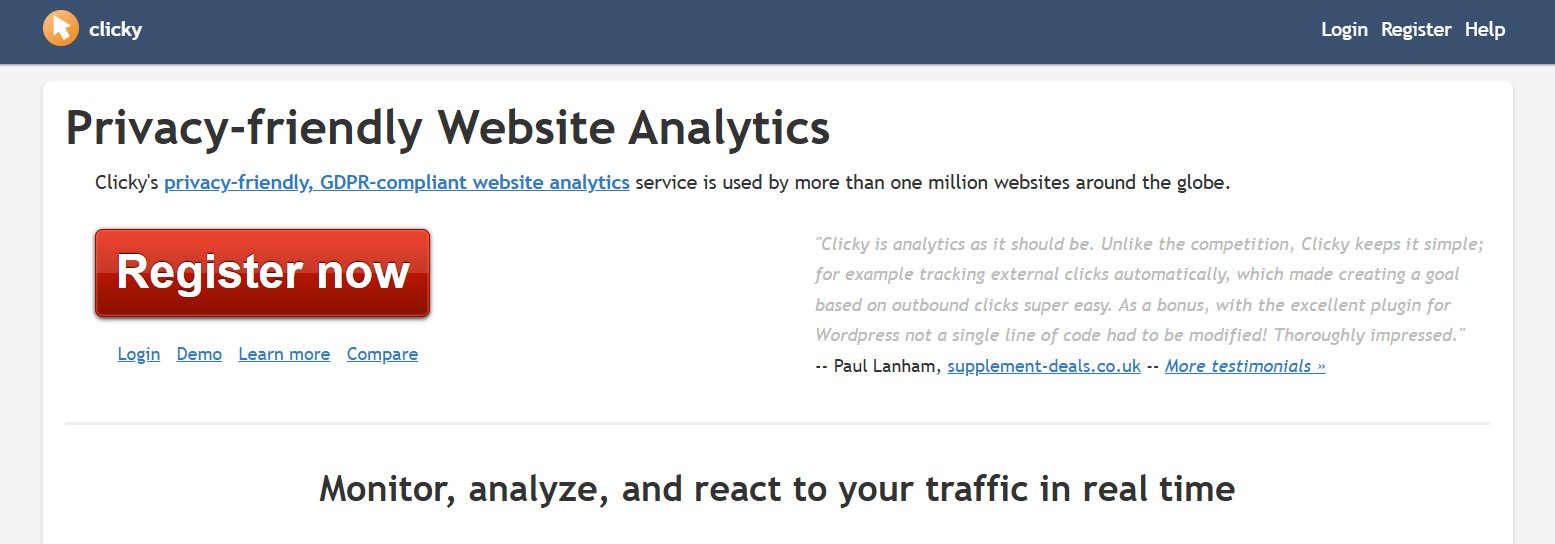
Clicky is a real-time, privacy-friendly web analytics platform used by more than one million websites worldwide. It gives website owners clear, actionable insights into visitor behavior in real time, with every page view and event visible.
With a simple interface, aggressive bot detection, and a GDPR-compliant, cookieless tracking approach by default, Clicky is built for teams that want accurate, privacy-respecting analytics without relying on invasive tracking methods.
Key features
Real-time visitor and action logs showing every page view and JavaScript event as it happens
Heatmaps logged at both page and visitor level with segment filtering for focused analysis
Aggressive bot detection and blocking to ensure traffic data is not polluted by bots or referrer spam
Uptime monitoring with alerts when a website goes offline, monitored from multiple global locations
Advanced filtering and segmentation to analyze specific subsets of visitors using combined filters
AI analytics that categorizes visits from AI chatbots and domains separately for easy analysis
Trend analysis to compare metrics against the previous day, week, month, or year
Pricing
Free trial: 21-day access to the premium features, with tracking for up to 3 websites and 1,000,000 daily pageviews across sites.
Free plan: Includes tracking for 1 website with up to 3,000 daily page views
Paid plan: Starts at $9.99/month or $79.99/year.
Pros & cons
Pros
Cons
Easy to set up using a simple tracking script, no advanced coding required.
It would be helpful if the visitor graph chart included data from more than two years ago.
Simple to use and makes it easy to visualize and analyze traffic data.
Response times from customer support could be improved, especially when users are waiting for assistance.
A customer experience as per G2 reviews:
Clicky is a good tool for website analytics. Its simplicity is combined with powerful features. Its interface, live data monitoring, and comprehensive visitor insights make Clicky an indispensable resource for enhancing online performance and empowering data-backed decision-making.
Sneha M. Marketing Head
4. Open Web Analytics
What it does
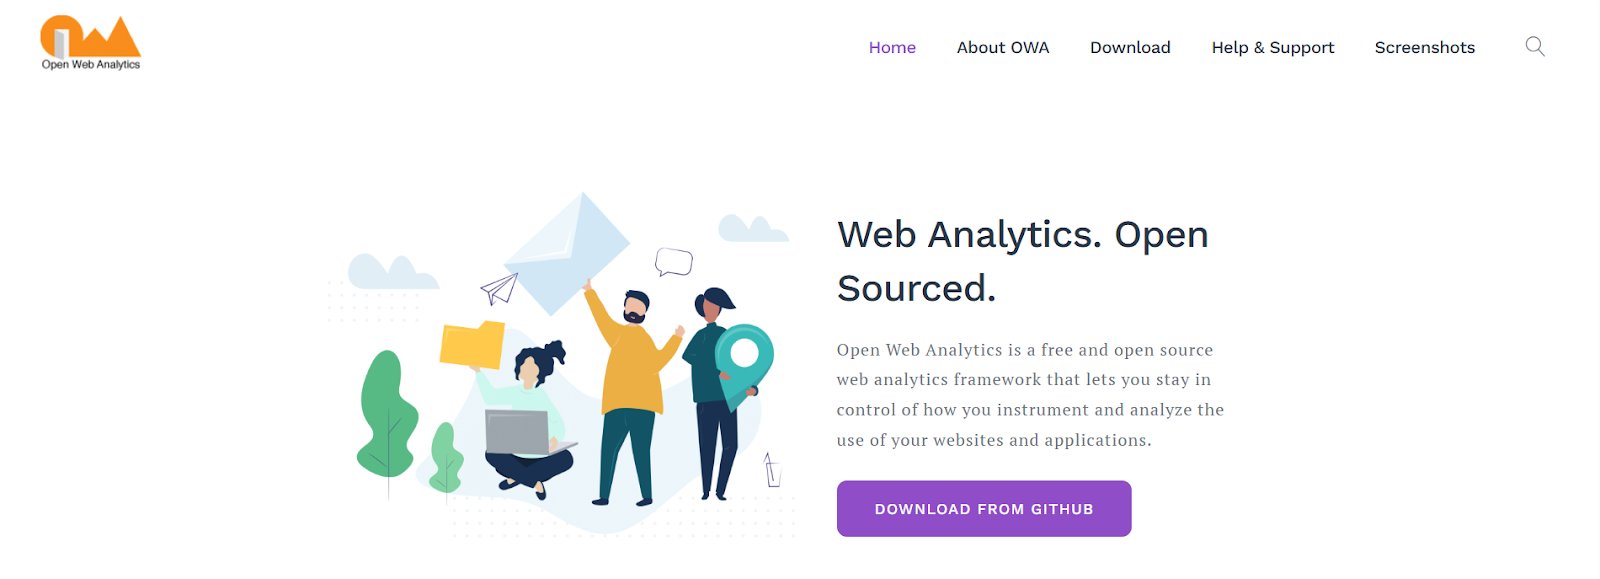
Open Web Analytics is a completely free, community-driven, open-source analytics platform built to combine traffic metrics with basic visual optimization tools. By prioritizing self-hosted deployment models, it empowers webmasters and developers to store operational data entirely within their own database stacks.
It features straightforward hooks for platforms like WordPress and MediaWiki, making it a powerful choice for independent digital projects.
Key features
Analytics dashboard for a centralized view of website performance and user activity
Click heatmaps to visualize where users click and engage on a page
Domstream session recording to record and play back mouse movements, keystrokes, and clicks
DOM element click tracking for granular insight into user interactions with specific page elements
eCommerce transaction tracking to capture conversion funnels, cart additions, and transaction revenues
Visitor aging to understand the frequency and patterns of repeat visitor behavior over time
SEO search terms tracking to understand how users find the site through organic search
Clickstream analysis to follow the path users take through a website
Pricing
OWA is free for all.
Pros & cons
Pros
Cons
It blends standard analytics with heatmap tracking to give a complete view of user behavior.
Adding a marketplace for custom add-ons could make the platform more flexible and useful.
Delivers fast, accurate tracking to help understand how users interact with web pages and apps.
Closer integration with Google Analytics features would enhance usability for those familiar with that platform.
User behavior & experience analytics tools
5. Microsoft Clarity
What it does
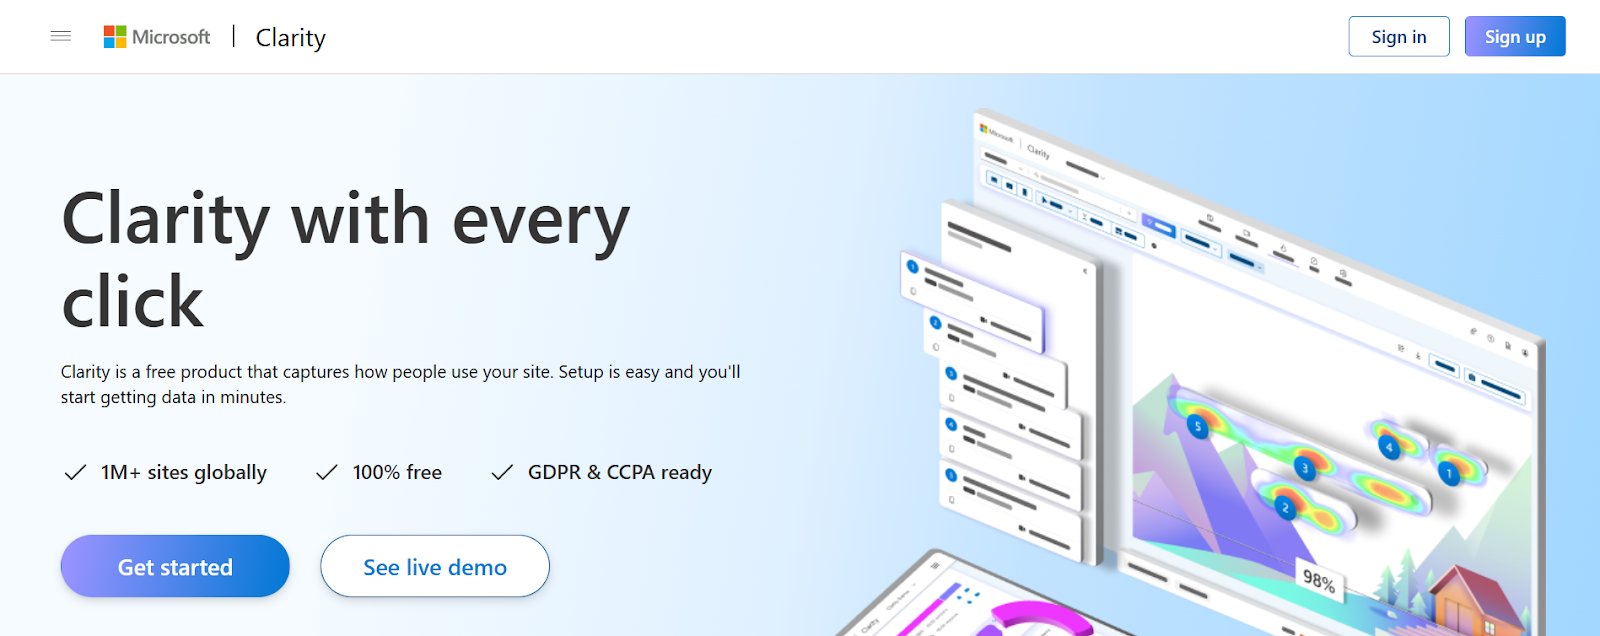
Microsoft Clarity is a free behavior analytics tool built to reveal the qualitative “why” behind user actions without data sampling constraints or cost barriers. It combines heatmaps, session recordings, and AI-powered summaries to show businesses exactly where visitors experience confusion, friction, or drop-offs.
Key features
Unlimited session recordings to watch actual user experiences and spot where people encounter page bugs, broken links, or visual glitches
Instant dynamic heatmaps that generate click, scroll, and area-based behavioral visualization maps across both desktop and mobile layouts
AI-powered session highlights using Copilot to scan long session logs and generate text-based summaries of core user actions
Frustration signal tracking that automatically flags rage clicks, dead clicks, and quick backs to surface user struggle patterns
Deep segmentation filters to analyze specific subsets of visitors by tags, operating system, geographical region, or referrer
AI chat data exploration allowing teams to converse directly with behavioral data to extract layout recommendations
Pricing
Clarity is free forever for all.
Pros & cons
Pros
Cons
The tool is quick to navigate, making it easy to access key insights.
Some session recordings may occasionally have technical glitches or slight delays that make it harder to analyze interactions.
Advanced filters allow you to monitor specific pages or elements on your website with precision.
The mobile experience in Clarity isn’t as smooth as the desktop version and may have occasional syncing issues.
A customer experience as per G2 reviews:
It gives us the customer journey on the website or landing page and where the customer is getting drop on the website. Where all the customers are clicking, and it will show real-time issues on the landing pages of the customer journey. easy to use and integrate with any tool.
Navin K. Digital marketing
6. PostHog
What it does
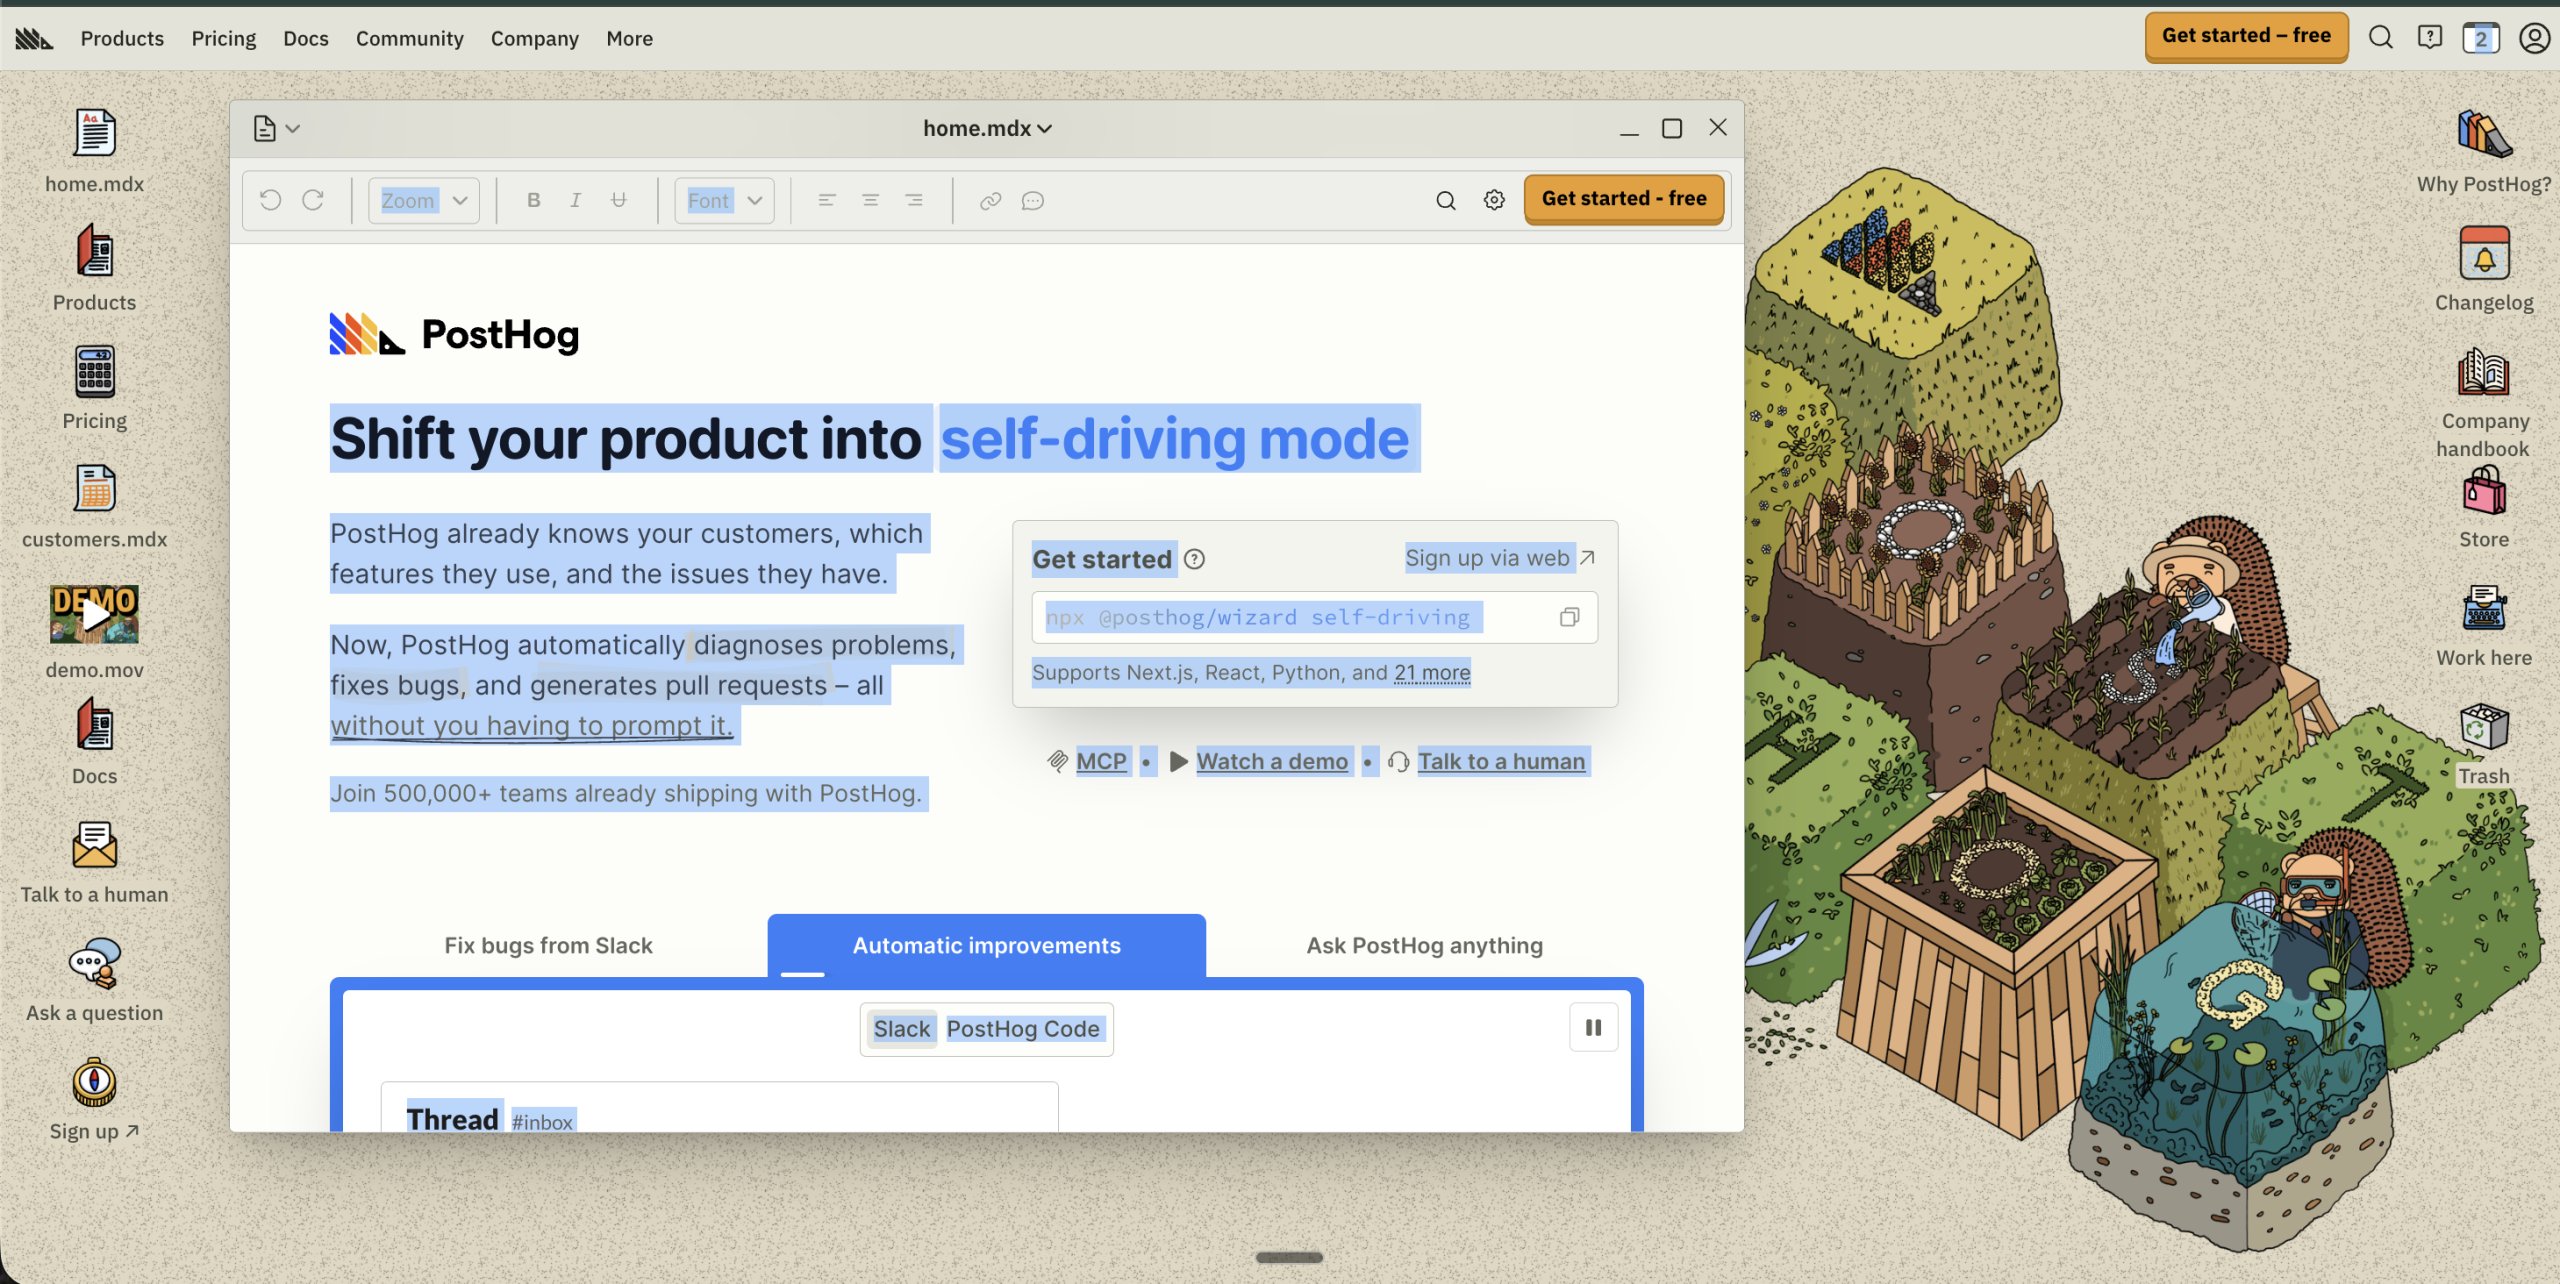
PostHog is a developer-centric product analytics platform that connects comprehensive event tracking directly with product deployment infrastructure. Built for engineering and product teams, it removes data silos by combining product analytics, session replay, feature flags, experiments, surveys, error tracking, and a managed data warehouse into a single platform. It is engineered for teams that need to understand how software changes affect customer behavior in real time without stitching together separate tools for each capability.
Key features
Full product funnel analytics with multi-stage retention curves and detailed path charts to map complex product usage journeys
Advanced feature flag management to remotely turn features on or off, launch targeted updates, and manage progressive code rollouts
Comprehensive session replay to record, filter, and review interface interactions across web and mobile app frameworks
Targetable user feedback surveys including NPS trackers and promotion feedback inputs with no code required
Integrated data warehouse that syncs out-of-app operational records like Stripe payments or Zendesk tickets to centralize user metrics alongside product data
Heatmaps, web analytics, AI observability, workflows, and CDP capabilities all within the same platform
Pricing
Free plan and paid plans start with usage-based scaling that applies after limits.
Pros & cons
Pros
Cons
Cohesive all-in-one platform that eliminates the need for separate tracking, survey, and feature-flag tools.
The platform can feel overwhelming for non-technical users or marketers due to its scale, and query rendering may slow down when handling large, raw datasets.
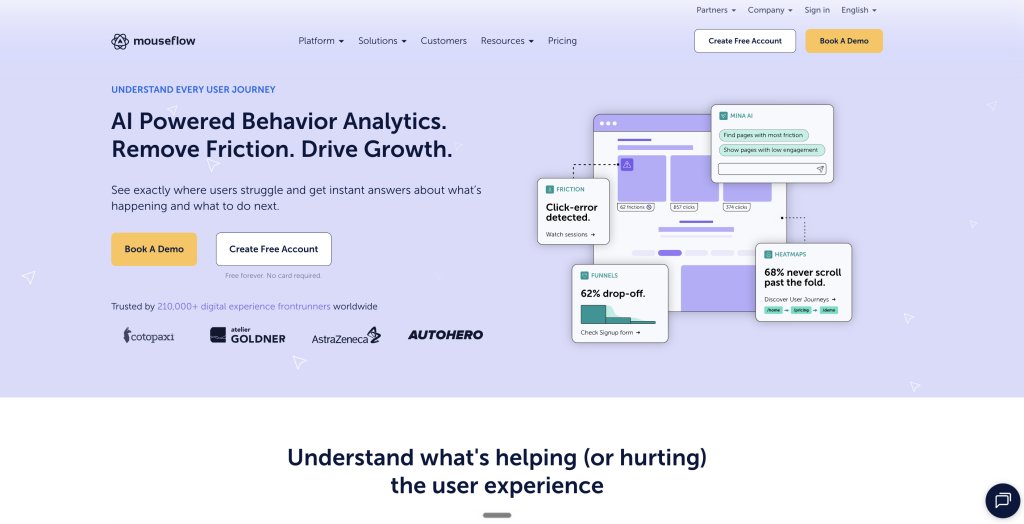
7. Mouseflow
What it does
Mouseflow is an AI-powered behavior analytics platform that locates user friction zones and fixes digital conversion pipelines. It records 100% of website sessions so when something breaks or users struggle, it is captured without gaps.
It combines session replay, heatmaps, friction detection, funnel analysis, form analytics, and feedback surveys in one connected platform.
Key features
Session replay with high-fidelity recordings capturing every click, scroll, hesitation, and rage click to show exactly how real users experience the site
Six visual overlay heatmaps covering click patterns, attention spans, mouse tracking, scroll reach, live element changes, and geographical profiles
Automated friction scoring engine that uses machine learning to isolate and rank troubled sessions, showing where users struggle most
Granular form field analytics that isolate exactly which input fields cause text corrections, formatting errors, or immediate page drop-offs
Multi-page visual funnels that build conversion paths across multiple URLs to locate abandonment points throughout the site
Targeted exit-intent surveys that automatically trigger feedback forms the moment a user moves their cursor to leave the page
User cohort comparison to analyze behavioral differences between new and returning visitors across specific layouts or devices
Mouseflow MCP Server to query session replays, funnels, and heatmaps directly with AI
Pricing
Free plan available with 500 recorded sessions per month for one website.
Paid plans start at $31 per month, billed annually.
Pros & cons
Pros
Cons
Users appreciate the readability of its heatmaps, making it easy to interpret where users focus and where they disengage.
Session recordings can occasionally cut off mid-session or experience slow loading during high-traffic events.
Automated user friction detection, including rage click tracking, helps pinpoint layout flaws instantly without manual session review.
Pricing tiers scale up quickly if site traffic surges, making costs unpredictable during high-traffic periods.
SEO & competitive analysis tools
8. Ahrefs
What it does
Ahrefs is a privacy-focused website analytics and SEO tool that gives website owners free access to three core Ahrefs capabilities: web analytics, site audit, and site explorer.
It positions itself as a privacy-friendly alternative to Google Analytics with no cookies by default and no personal data collected, while also filling the gaps left by Google Search Console with deeper SEO insights, more complete backlink data, and detailed technical audit capabilities.
Key features
Web analytics with a simple, privacy-focused interface showing top traffic sources, top pages, traffic locations, and browser clients, including traffic from LLMs
Site audit that scans websites for 170 or more technical and on-page SEO issues with a Health Score monitored over time and detailed fix recommendations
Site Explorer to see which keywords a website ranks for, which pages bring the most organic traffic, and which websites are linking to it
All known backlinks visible, including link type data such as nofollow, UGC, and sponsored links, going beyond the top 1,000 limit in Google Search Console
All known keywords visible with SEO metrics for pages and SERP features for every keyword
Domain and page-level SEO metrics with hreflang cluster analysis and broken links data for internal and external links
AI Content Helper for creating content discoverable in Google and AI search, with one free document per month
Pricing
Free for websites with verified ownership, with unlimited verified websites
Starter paid plan starts at $29 per month
Pros & cons
Pros
Cons
Backlink analysis and keyword research data is accurate and reliable, making it easy to base SEO decisions with confidence
Brand Radar metrics change retroactively when the index is updated, making historical AI visibility tracking inconsistent over time
Clean and user-friendly interface with a Health Score feature useful for ongoing site monitoring
The free plan does not offer keyword suggestions to help improve content for specific keywords, a feature available in some competing tools
How to choose the best and free website analysis tool
Choosing the right free website analysis tool depends on your goals, the kind of data you need, and how deep you want to go with optimization. Here are some key steps to guide your decision:
1. Define your objectives
Are you looking to improve SEO, track user behavior, optimize conversions, or monitor performance? Clarifying your goals helps narrow down tools that offer the right features.
2. Evaluate key features
Look for essential features like real-time analytics, heatmaps, session recordings, traffic sources, conversion tracking, and funnel analysis. Tools like VWO also offer form analytics, surveys, or A/B testing support, even in free plans.
3. Check data ownership and privacy
Tools like Matomo or Open Web Analytics offer self-hosted options for full data control, ideal if privacy is a concern. SaaS tools like VWO AB Tasty and Ahrefs follow widely recognized security standards such as GDPR compliance, SOC 2 certification, and data encryption to ensure secure and compliant data handling.
However, security features can vary across tools, so it’s always wise to review a platform’s privacy policy and security documentation before integrating it into your stack.
4. Ease of use and setup
The tool should have an intuitive interface and easy integration, especially important for small business owners, solo marketers, or small teams without technical support.
5. Scalability
Choose a platform that offers upgrade options as your business grows. Some tools have generous free tiers but also provide advanced features in paid versions.
6. Compare limitations
Understand the limits of the free plan: how many monthly tracked users, sessions, or page views it allows, access to historical data, and feature restrictions.
7. Support and community
Access to helpful documentation, community forums, or responsive customer support can make a big difference in troubleshooting and learning.
Go beyond basic with VWO AB Tasty’s visitor behavior analysis capabilities
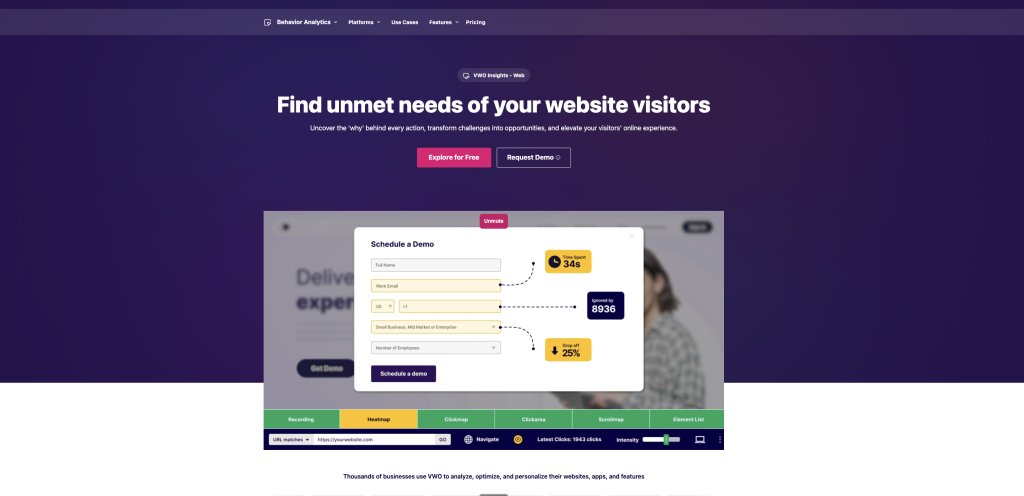
The free tools mentioned above are solid starting points for website analysis. But if you want to dig deeper and track frustration signals, hesitation patterns, engagement blockers, high-performing elements, and more, then you should go for Insights by VWO AB Tasty.
Insights combines heatmaps, session recordings, form analytics, funnels, and segmentation into one platform.
Teams can track clicks, scrolls, and taps, even on dynamic elements like modals or pop-ups, with heatmaps. Session recordings highlight moments of friction, such as rage clicks or drop-offs.
Pro Tip!
To get the best results from user behavior analysis, pair Insights with feedback collected through VWO AB Tasty Pulse surveys. While Insights shows you what users do, Pulse captures why they do it, giving you a complete picture before forming hypotheses.
Form analytics reveals where users skip, refill, or abandon fields, enabling teams to identify friction, fix it, and improve conversions. Funnel maps user journeys step by step to pinpoint where users exit.
When combined with segmentation filters like location, device type, or traffic source, the platform allows for precise targeting and more focused optimization.
Since the platform supports capabilities like A/B testing and Feature Management, you can seamlessly turn user insights into action by running experiments, refining experiences, or rolling out new features, all within the same platform.
Let’s look at a powerful example of how behavior-driven decisions can directly fuel growth:
By using Insights, Greyson Clothiers uncovered where users were dropping off through heatmaps and session recordings. These insights revealed hidden friction points, prompting the team to implement changes such as smarter filters and clearer mobile CTAs. A/B testing confirmed the changes were effective, showing increased engagement and reduced bounce rates. As a result, the team saw a 10.5% boost in revenue.
Here’s what their team had to say:
Using Insights has been a great resource for going beyond the data in our Google Analytics platform and diving more into the behavior of the users on our site. While GA data can point to user patterns, it is more difficult to see where those patterns have originated from – and VWO helps give a better look at this behavior. VWO has helped our team at Greyson Clothiers get a better understanding of how we can optimize different elements of our platform to make our shopping experience seamless, engaging, and unique.
Théo Münch UX Strategy Manager at Greyson Clothiers
Watch this webinar and learn how to analyze visitor behavior to create a strong hypothesis, understand visitor drop-off patterns, analyze different user segments, and develop a process for conversion optimization.
Key features
Heatmaps including click, scroll, hover, and zonal maps to visualize engagement and identify high and low interaction areas
Session recordings with advanced filtering options like rage clicks, drop-offs, and cohorts to diagnose friction points in real user journeys
Conversion funnel analysis to track multi-step user journeys and pinpoint exact drop-off stages
Form analytics to uncover field-level friction like hesitation time, drop-offs, and ignored inputs
Wandz, the AI capability, automatically detects patterns, summarizes behavior, and recommends optimization opportunities
Heatmap and behavior comparison across segments, devices, time periods, or test variations
Behavior segmentation by device, geography, campaign, and actions for deeper analysis of specific user cohorts
Pricing
Free Trial: 30-day full access to all features.
Paid plans: Customized to your business requirements.
The right website analysis tool elevates how you understand your users by turning unclear visitor patterns into actionable insights that drive real results. Start with one tool that matches your immediate needs, get comfortable with the data it provides, then expand your analytics stack as your optimization efforts grow.
If you want to choose a premium tool, VWO stands out as a complete experience optimization platform. It not only lets you analyze user behavior on your website but also includes testing and personalization capabilities under a single roof.
Take the 30-day free trial today to experience how VWO can help uncover user behavior, boost conversions, and elevate your website’s performance.
Frequently asked questions (FAQ)
Q1. How to do a website analysis for free?
Free website analysis typically begins with adding a tracking tool to the site, which requires a simple code snippet. Most teams begin with one tool that matches their immediate goal, get comfortable with the data it provides, and expand from there.
Q2. This list splits tools into three categories, do you need one from each, or can a single free tool cover everything?
A single tool rarely covers everything well. Google Analytics tells you where traffic comes from and what converted, but not how users behaved on the page. Ahrefs covers the SEO landscape but nothing about on-site behavior.
For most teams, one traffic analytics tool paired with one behavior analytics tool covers most website analysis needs without overcomplicating the stack. If the goal is a single platform that covers behavior analysis, funnel tracking to identify drop-offs, experimentation, and personalization, then VWO AB Tasty is the best option.
Q3. Which of these tools can show you traffic arriving from ChatGPT, Perplexity, and other AI assistants?
Several tools in this guide are building AI traffic tracking capabilities. Clicky categorizes visits from AI chatbots and domains separately for easy analysis.
Matomo has introduced AI traffic source tracking to identify visits from AI assistants and chatbots. Google Analytics can surface some AI referral traffic through its acquisition reports, though coverage depends on how AI tools pass referral data.
Q4. PostHog is product analytics, while Clarity and Mouseflow are behavior analytics, which does a marketing site actually need?
For a marketing site, behavior analytics is the more immediately relevant choice. Tools like Microsoft Clarity and Mouseflow show how visitors interact with landing pages, where they drop off, and what friction looks like in real sessions.
This directly supports improving page performance, reducing bounce rates, and optimizing conversion flows. PostHog is better suited to teams building software products that need to understand feature adoption and retention.
Q5. Can you run two or three of these tools on the same site without slowing it down or skewing each other’s data?
Running multiple tools on the same site is common and generally manageable, but it does come with trade-offs. Each tool adds a tracking script that loads on every page, which can affect page speed if not managed carefully. Using a tag manager like Google Tag Manager helps consolidate script loading and reduces the performance impact.
On data accuracy, different tools measure differently, so numbers will never match exactly across platforms. Session counts, bounce rates, and conversion figures will vary based on how each tool defines and counts these events.
Q6. A heatmap shows where users struggle; how do you prove your fix actually worked?
A heatmap identifies the problem but cannot validate the solution. The only reliable way to prove a fix worked is through experimentation. Running an A/B test allows a comparison of the original experience against the proposed change with real users simultaneously, measuring the actual impact on behavior and conversions.
VWO AB Tasty connects behavior analysis directly to experimentation in one platform, so teams can move from spotting friction to running a test that validates the fix.
Q7. Why isn’t Google Search Console on this list, do you still need it alongside the tools here?
Google Search Console was not included because it focuses specifically on how a site performs in Google search, covering impressions, click-through rates, index coverage, and Core Web Vitals.
The tools in this guide focus on what happens after a visitor arrives on the site. The two serve different but complementary purposes, and most teams benefit from using both. For a complete picture of website performance, Search Console is worth running alongside the other tools.
I'm a branding enthusiast, marketer, and B2B content professional with over 20 years of experience. I'm also a certified native advertising expert and trained in strategic thinking. Author of 'Managing Modern Brands: Cult Theory and Psychology', and three other books in diverse genres. I generally write on marketing trends, optimization, brand strategy, consumer psychology, CRO, cult theory, data, personalization, and content strategy. With a strong expertise in building and leading teams and cross-functional collaboration, I have driven demand through content creation, data, digital media, content marketing, and technology.
Uncover hidden visitor insights to improve their website journey
One of our representatives will get in touch with you shortly.
Awesome! Your meeting is confirmed for at
Thank you, for sharing your details.
-
, you're all set to experience the VWO demo.
I can't wait to meet you on at
Account Executive
, thank you for sharing the details. Your dedicated VWO representative, will be in touch shortly to set up a time for this demo.
We're satisfied and glad we picked VWO. We're getting the ROI from our experiments.
Christoffer Kjellberg
CRO Manager
VWO has been so helpful in our optimization efforts. Testing opportunities are endless and it has allowed us to easily identify, set up, and run multiple tests at a time.
Elizabeth Levitan
Digital Optimization Specialist
As the project manager for our experimentation process, I love how the functionality of VWO allows us to get up and going quickly but also gives us the flexibility to be more complex with our testing.
Tara Rowe
Marketing Technology Manager
You don't need a website development background to make VWO work for you. The VWO support team is amazing
Elizabeth Romanski
Consumer Marketing & Analytics Manager
Trusted by thousands of leading brands
Awesome! Your meeting is confirmed for at
Thank you, for sharing your details.
Your Roadmap to Better Results
1:1 Demo customized to your industry and optimization goals.
Feature deep-dive into the user behaviour tools you need most.
No-pressure advice on the best path forward for your team.




 ChatGPT
 Perplexity
 Gemini
 Claude
 Grok
Grok








![7 Best Website Monitoring Tools [2026]: Expert Insights to Help You Pick the Right One](https://static.wingify.com/gcp/uploads/sites/3/2025/02/Feature-image-7-Best-Website-Monitoring-Tools-How-to-Pick-the-Right-One.jpg?tr=w-300,h-150)