CRO Industry Insights from Our In-App Survey Results
5 years ago when our Founder, Paras Chopra, realized the opportunity gap for an “easy-to-use” A/B testing software in the industry, he didn’t know how big it’s going to be. He tried to solve a pain point and it worked: VWO is today a known name in the industry.
Now when we look back at how things have changed over time, testing has become a part of the culture for those who understand how powerful it is. No data-driven online business can ignore it.
Download Free: Conversion Rate Optimization Guide
A/B testing has become a small niche in itself. And we did a short survey in the VWO app to understand our industry (and specifically our customers) better. Here are a few key data points/insights that stood out for us:
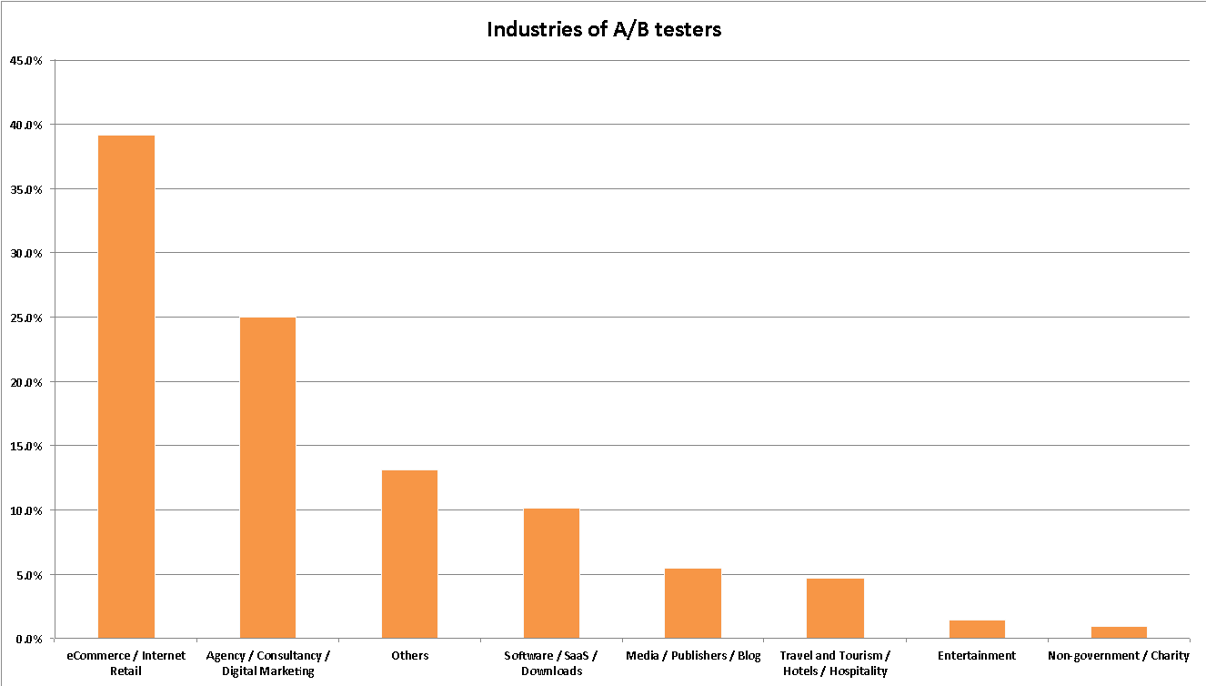
1. eCommerce industry is using A/B testing most actively. 39% of VWO customers are from the eCommerce industry.

Most active VWO users according to industry type
2. One in every seven A/B tests is a winning test
3. Average conversion lift for statistically significant tests is 49 per cent.
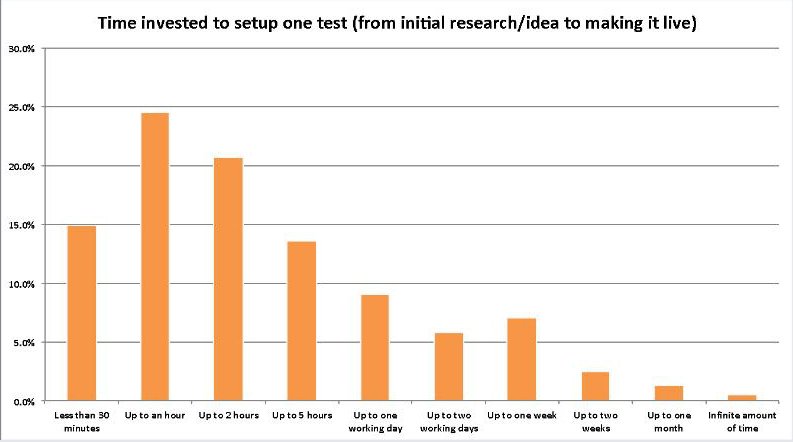
4. 40% of testers in VWO create a test within an hour. This includes time taken in doing the research for test idea to making it live!

5. “Power testers” comprises of 5% of our active user base. In the first quarter of 2014, these “power testers” alone had set up close to 600 tests, which is 8 times more than usual testers.
6. Average revenue per unique visitor for eCommerce sites is $3. A successful A/B test usually increases it up to 50%. 7. Almost 30% of testers would like to start with testing a call-to-action button.
This is followed by headlines (20%), Layout (10%), and website copy (8%).

Download Free: Conversion Rate Optimization Guide
8. A typical A/B test runs for more than one week but not more than two months.
9 women can’t give birth to a baby in 1 month. Your boss can say “test faster”, but it’s not going to change the way math works.
We’ve come a long way since the time VWO was first launched on HN. This survey was just a small attempt to see where we’re headed as an industry. The points mentioned above definitely reveal some trends. We will continue to share more data/insights in future and contribute to a culture of transparency for everyone to benefit from it.
Your Turn
What do you think about these data points/insights? Do you have any interesting observations to share from your tests? Write to us at marketing@vwo.com.
Bonus content: Watch a webinar on mistakes to avoid while carrying out CRO campaigns.


