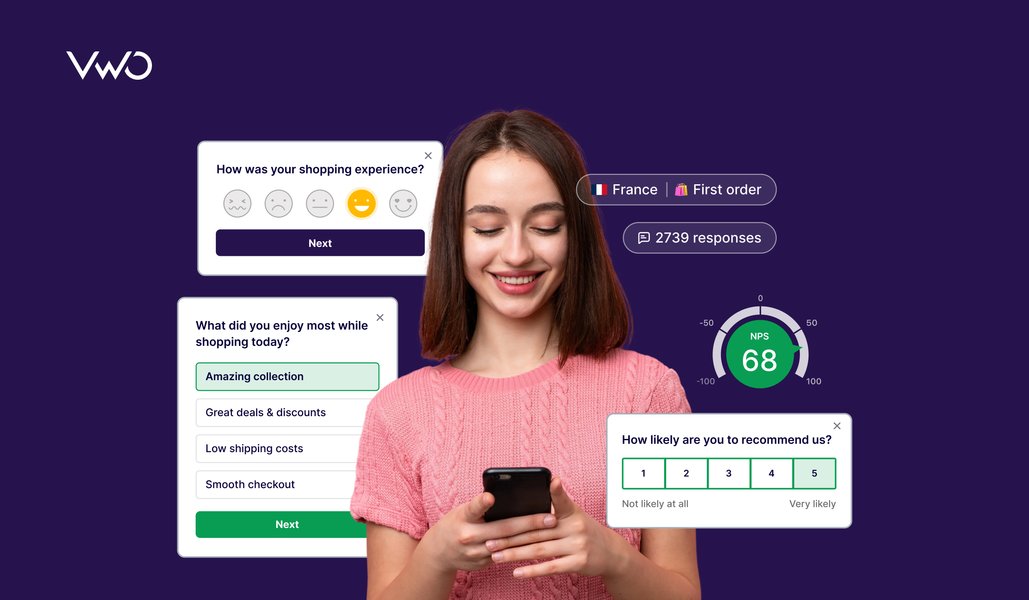
Surveys are easy to launch. Analyzing the results? Not so much.
Ever opened a spreadsheet full of survey responses and thought, “Where do I even start?” It’s easy to get overwhelmed between scattered data, open-ended comments, and endless scores.
Spotting meaningful trends, segmenting responses, or quickly visualizing what matters most can feel like trying to find a signal in the noise. And when dashboards aren’t customizable or insights are buried too deep, key takeaways slip through the cracks.
If you’re tired of spreadsheets and surface-level stats, it’s time to explore survey analysis software. This guide covers why it matters, what features to look for, and which tools can help you translate feedback into meaningful results.

Why use survey analysis software?
Survey analysis software does more than just collect feedback—it transforms complex data into meaningful insights that drive action. Here’s how it adds value at every step of the feedback journey:
- Organizes raw data efficiently: It structures overwhelming response sets into manageable data points, making it easier to analyze and access the information that matters.
- Speeds up data processing: From importing to cleaning and organizing data, the software streamlines workflows, saving time and improving accuracy.
- Transforms data into visual stories: Spot trends faster and communicate insights clearly with dynamic charts, dashboards, and presentation-ready reports—making complex data easy to understand and share with stakeholders.
- Simplifies statistical analysis: No advanced stats knowledge is needed—built-in tools handle everything from frequency distributions to regression analysis.
- Enables targeted insights through segmentation: Filter and analyze responses by demographics, behavior, or custom criteria to uncover nuanced differences across audience groups.
- Makes sense of open-ended feedback: AI-driven text analysis helps decode qualitative responses, identifying themes, sentiments, and keywords at scale.
- Supports data flexibility and export: Export results in various formats for deeper analysis or integration with other tools—ensuring your data works where needed.
Ultimately, using survey analysis software empowers businesses, researchers, and teams to move from feedback collection to strategic action—confidently, quickly, and with clarity.
Disclaimer: The pros and cons listed are based on reviews and feedback from third-party sites such as G2, TrustRadius, and other sources.
Best survey analysis software: Quick glimpse
Top 7 survey analysis software
To help you find the best fit for your feedback and reporting needs, here’s a closer look at the top 7 survey analysis software tools and what makes each one stand out.
Best survey analysis software: Comparison
| Survey Analysis Tool | Features | Pricing |
| SurveyMonkey | Custom Dashboards, Advanced Filtering, Response Tagging, Export Options In Multiple Formats (CSV, PDF, And XML), Custom Reports, Response Tagging, Multi-Survey Analysis, AI-powered Tools | Free sign-up is available. Team plans: Starts from $30/user/month, billed annually, starting at three users. Individual plans: Starts from $39/month, billed annually. |
| Displayr | Data Cleaning, Stat Testing, Table Creation, Data Visualization, No-Code Capabilities, Ai-Text Analysis, Text Analytics, Ai-Powered Sentiment Analyzer, Nps Dashboard, Customer Feedback Dashboard | Free trial: 14 days for all plans. Free: Limited visualization tools and analysis available. Paid: Starts from $3059/user/year. |
| Sogolytics | Text Analysis Report, Segmentation, Filters, Omni All-In-One Reports, Cross-Tab Reports, Statistical Reports, Downloadable & Shareable Reports | Free trial: Available for all paid packages with short-term access to the features of the corresponding plan. Free: Basic features for life. Paid: Starts from $25/month, billed annually. |
| Mtab | Drag-and-drop Interface, Customizable Dashboards, Data Visualizations, 3rd-Party Integrations | Paid: Starts from $35/user/month, billed annually. |
| Delighted | Pre-Built Graphs & Charts, Benchmark Report, Segmentation, Answer Comparison, Response Tagging, Pivot Table Report | Free: 25 responses and 1 user per month. Paid: Starts from $17/month. |
1. SurveyMonkey

SurveyMonkey is a survey and feedback platform that helps businesses collect and analyze customer, product, and market insights with ease. Its intuitive design and customizable templates make survey creation straightforward, helping organizations make data-driven decisions efficiently.
The platform provides simplified survey analysis with AI-powered insights and real-time data visualization. Users can quickly identify trends with statistical analysis and automatically generated charts. Sentiment analysis categorizes open-ended responses as positive, neutral, or negative, while word clouds highlight recurring themes, making it easier to interpret feedback.
Other key features
Custom Dashboards, Advanced Filtering, Response Tagging, Export Options In Multiple Formats (CSV, PDF, And XML), Custom Reports, Response Tagging, Multi-Survey Analysis, AI-powered Tools
Pricing
- Free sign-up is available.
- Team plans: Starts from $30/user/month, billed annually, starting at three users.
- Individual plans: Starts from $39/month, billed annually.
Pros & cons
Pros:
- You can view responses in real-time and use the analysis tools to identify trends and patterns quickly.
- The platform offers extensive customization options and comprehensive analysis capabilities for deeper insights.
Cons:
- The business plan allows only a limited number of users to access the platform simultaneously.
- Enhanced depth in logic features would improve usability.
Customer experience based on G2.com:
“I find that the ease of use and intuitiveness are the best aspects of Survey Monkey. They offer ready-to-use templates that even non-technical users can utilize, saving both time and effort.” – Vandit Chandak, Marketing Coordinator at Eventible
Quick note: You’re driving traffic but losing visitors, and while analytics show what’s happening, only customer feedback reveals why. Watch this webinar to learn creative survey strategies and see how companies like Contorion capture real insights to solve customer challenges.
2. Displayr

Displayr is an all-in-one analysis and reporting platform built for market researchers to quickly extract insights and share compelling data stories. As a singular platform for analysis, visualization, reporting, and dashboarding, it can quickly process large datasets, converting them into easy-to-read charts like crosstabs. Its advanced AI and NLP capabilities enhance text analysis, including verbatim coding.
Displayr’s automated reporting updates visuals and analyses instantly, saving time on manual adjustments. It offers a wide range of interactive dashboards and templates designed by market researchers for seamless survey analysis reporting.
Other key features
Data Cleaning, Stat Testing, Table Creation, Data Visualization, No-Code Capabilities, Ai-Text Analysis, Text Analytics, Ai-Powered Sentiment Analyzer, Nps Dashboard, Customer Feedback Dashboard
Pricing
- Free trial: 14 days for all plans.
- Free: Limited visualization tools and analysis available.
- Paid: Starts from $3059/user/year.
Pros & cons
Pros:
- Allows users to add and run custom R code for advanced survey data analysis.
- Supports a wide range of analyses, including hierarchical base, territory analysis, latent class analysis, and regressions.
Cons:
- Has a steep learning curve for users unfamiliar with the platform, requiring training to fully utilize its features.
- It can be slow when working with specific data groups, which may impact efficiency.
Customer experience based on G2.com:
“Displayr fulfills all our data analysis requirements. The search function and extensive documentation are valuable in navigating its menus.” – Julian Castillo, Legal Assistant at Carlson Calladine & Peterson LLP
3. Sogolytics

Sogolytics survey software provides survey analysis and reporting features that help turn feedback into clear, data-driven insights. It offers real-time tracking and a wide range of reporting options—bar graphs, cross-tabs, conditional filters, comparison views, and statistical reports—so users can uncover patterns, compare responses across groups, and highlight key drivers with ease.
With customizable, presentation-ready visuals and intelligent filtering, Sogolytics enables deeper data exploration and makes it easy to communicate insights clearly—whether you’re guiding internal strategy or presenting to stakeholders.
Other key features
Text Analysis Report, Segmentation, Filters, Omni All-In-One Reports, Cross-Tab Reports, Statistical Reports, Downloadable & Shareable Reports
Pricing
- Free trial: Available for all paid packages with short-term access to the features of the corresponding plan.
- Free: Basic features for life.
- Paid: Starts from $25/month, billed annually.
Pros & cons
Pros:
- It offers great flexibility in analyzing survey data through multiple reporting views.
- The robust and powerful tracking and analytics features enhance overall data interpretation.
Cons:
- Report saving and reusing filters can be a bit confusing, making it harder to streamline recurring analysis.
- The need to manually renew the non-profit account adds an extra layer of inconvenience.
Customer experience based on G2.com:
“The tools for creating and distributing surveys were very comprehensive and adaptable. I was able to easily preview the draft survey with a few reviewers and make adjustments based on their feedback. Now that I have launched my survey and responses are coming in, I am utilizing the tracking and analytics features of the Sogolytics platform, which are, unsurprisingly, also robust and effective.” – Ron Tugender, Freelance Content Creator
4. Mtab

mTab Halo is an AI-powered survey analysis platform that helps brands unify their research, analyze data effortlessly, and make faster, smarter decisions—all in one place. Halo Models streamline data prep by automating cleaning, harmonizing, and combining diverse datasets, setting the foundation for accurate and consistent analysis.
Halo Reports allows users to easily analyze and crosstab survey data, generate detailed insights, and create interactive reports. Its intuitive dashboards go beyond static visuals, enabling users to build interactive, real-time reports with clickable charts, drill-down features, and custom layouts—perfect for sharing insights and driving decisions across teams.
Other key features
Drag-and-drop Interface, Customizable Dashboards, Data Visualizations, 3rd-Party Integrations
Pricing
- Paid: Starts from $35/user/month, billed annually.
Pros & cons
Pros:
- It makes managing the process flow and iterating on data easier, especially when creating visualizations.
Cons:
- Visualizing steps for the process and calculating can be challenging due to the software’s complexity.
5. Delighted

Delighted offers businesses an easy-to-use platform for quickly gathering customer feedback through surveys and turning it into actionable insights to improve experiences and drive growth. Its AI-powered text analysis, Smart Trends, automatically identifies key themes—pricing, ease of use, or service quality—while built-in sentiment analysis highlights what drives satisfaction or dissatisfaction.
The real-time, role-based dashboard provides a clear view of metrics like NPS and CSAT, with filters for keywords, tags, timeframes, and customer segments. Teams can customize dashboards by role or location, making it easy to focus on relevant insights.
Other key features
Pre-Built Graphs & Charts, Benchmark Report, Segmentation, Answer Comparison, Response Tagging, Pivot Table Report
Pricing
- Free: 25 responses and 1 user per month.
- Paid: Starts from $17/month.
Pros & cons
Pros:
- Metrics and reports are easy to filter, making it simple to track responses and remove test data for accurate results.
- Ready-made templates make surveys quick to create and customize, with smooth channel integration for a better user experience.
Cons:
- Setting up where web surveys show needs developer help; it would be easier to do this directly in the app.
- Old survey edits stay in the reporting view, making it harder to see a clear summary of results.
Customer experience based on G2.com:
“I appreciate the ease of use of the platform. It’s straightforward to navigate, making it easy to learn as I go. I also value the quick responses from their customer support team, who always provide helpful answers. Integration with Slack is seamless; for instance, whenever we receive a survey response from a customer, we can view it directly in Slack.
Additionally, the platform allows us to easily report on our survey results each time we send out a survey and compare them with results from previous periods.” – Anna Girgenti, Manager of Customer Success at VitalSource
6. Forsta

Forsta is a Human Experience (HX) platform that offers customizable surveys to gather insights from any audience—ranging from small teams to global communities. It captures data from various touchpoints and channels, helping businesses understand the complete customer journey.
All feedback is unified on a single platform, where advanced analytics tools allow users to search, sort, and filter responses for deeper insights. Genius Text Analytics turns unstructured text from surveys, emails, and chats into measurable data, while voice sentiment analysis adds emotional context to feedback.
Forsta also makes it easy to visualize insights through reports, graphs, and infographics, helping teams share findings as clear, compelling stories.
Other key features
Granular Sentiment Analysis, AI-powered Categorization, Transcription, Interactive Dashboards, Infographic Storytelling, Mobile Reporting
Pricing
- Plans are not provided on the website. A demo can be requested.
Pros & cons
Pros:
- Survey tracking, quotas, and crosstabs are easy to use, with smooth editing and reliable performance—no downtime experienced.
- Clear survey results with useful filters make it a great tool for gaining insights and growing the business.
Cons:
- Report downloading could be more user-friendly, and having the option to select all respondents who entered or clicked the survey would be helpful.
- Occasionally, there are minor programming issues, and insights may not always align perfectly with the data.
Customer experience based on G2.com:
“Forsta offers a comprehensive range of products that support your customer experience (CX). We utilize Forsta for surveys and dashboards. The studio reports are excellent for displaying and analyzing data.” – Chris Manton-Maund, Salesforce Manager at Cromwell
7. Survicate

Survicate is an all-in-one platform that helps businesses turn customer feedback into meaningful action. It enables teams to collect responses across multiple channels, automatically analyze them with AI, and uncover insights that drive better decisions.
The AI-powered text analysis simplifies open-text responses, generates smart reports, and highlights key patterns using tools like word clouds and advanced filtering.
Custom dashboards bring all the survey data together in one place, allowing users to track CX metrics in real time, compare results over time, and dive into specific user segments or behaviors. With instant alerts and clear trend tracking, teams can stay on top of emerging insights and make more targeted, data-driven decisions with confidence.
Other key features
Filtering, AI Research Assistant, 1-Click Native Integrations, Transcriptions, AI Sentiment Analysis, Insights Hub, Data Exporting
Pricing
- Free trial: 10 days for all features of the Growth plan.
- Free: 1 active survey, up to 25 responses/month.
- Paid: Essential plans start from $79/month, billed annually; Advanced plans start from $299/month.
Pros & cons
Pros:
- Easy to install surveys and manage them independently, with smooth integration and quick support for any issues.
- Helps get a full view of the customer experience by consolidating data and offering flexible survey options across email, apps, and websites.
Cons:
- The data analysis is fairly basic; more in-depth insights on segmentations, profiles, and response patterns would add value.
- Making quick changes can feel sluggish at times, as the platform lacks smoothness in responsiveness.
Customer experience based on G2:
“Survicate is a powerful tool that enables the creation of surveys across multiple channels, including email, apps, and websites. The application is designed to effectively capture customer feedback and consolidate all relevant touchpoints and information from clients.
Survicate stands out in feedback management by providing a comprehensive insight hub that collects and shares valuable insights.” – Edoardo Levantino, Senior security manager at Firenze Race Team
Additional essential tools for survey analysis
Essential factors in selecting survey analysis software
Selecting the right survey analysis software starts with understanding what will truly support your team’s goals and fit seamlessly into your existing processes. The right type of tool should help you:
1. Work smarter
A good platform should be easy to use, with no steep learning curve, so anyone on your team can jump in and start collecting insights. Real-time dashboards and alerts give you instant visibility into responses, while advanced tools like AI, sentiment analysis, filtering, and segmentation help uncover trends without hours of manual work.
2. Scale with ease
Whether you’re gathering feedback via email, web, or mobile apps, a robust platform supports multi-channel feedback collection so nothing gets missed. It should also integrate seamlessly with your existing systems and handle large datasets without slowing you down—ready to grow with your business.
3. Collaborate seamlessly
Share clear, actionable insights across teams using custom dashboards and downloadable reports. With role-based access, intuitive layouts, and easy sharing options, teams can stay aligned, focus on what matters, and make faster, more informed decisions.
4. Protect your data
Prioritize platforms with enterprise-grade security and full compliance with data regulations like GDPR. This ensures sensitive customer feedback stays protected at every step.
5. Match value with cost
Ensure the tool’s pricing aligns with its features and value. A good platform should offer the right mix of power, usability, and scalability—without unnecessary complexity or hidden costs.
While many survey analysis tools offer strong individual features, the real value lies in how well these capabilities come together to support end-to-end decision-making. Some platforms go beyond data collection—integrating analysis, behavior tracking, and actionable insights into one seamless workflow, helping teams close the insight-to-action gap more effectively.
VWO – Leverage visitor feedback to shape your optimization strategy

Most survey tools stop at analysis, but insights alone won’t move the needle. Simply knowing what users say doesn’t guarantee results. You need to refine your strategy, implement changes, and measure impact to know if it’s working.
That’s where VWO stands apart. Unlike tools that stop at feedback collection and analysis, VWO lets you take immediate action. You can test insights through A/B experiments or deliver personalized experiences based on survey responses—all within the same platform.
Even more, VWO connects what users say with what they do. By combining survey responses with behavioral data through heatmaps and session recordings, you can spot mismatches between user intent and real actions. This behavior-feedback link helps uncover deeper opportunities for optimization and ensures every change is backed by data, not assumptions.
Key features of VWO surveys:
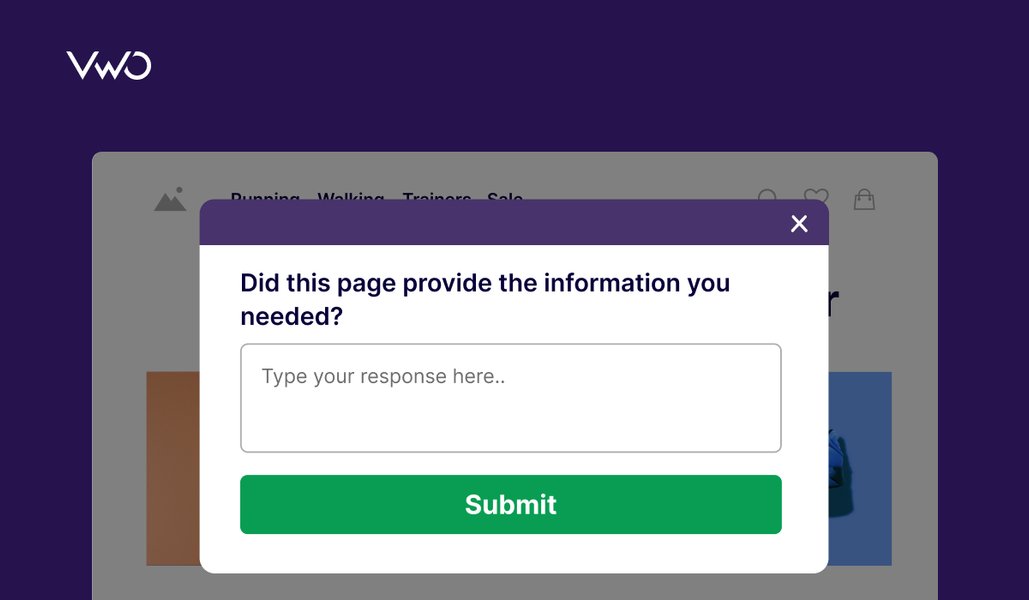
- Smart question targeting: Ask the right questions to the right visitors at the right time with context-based triggers like exit intent, time on page, or specific visitor segments.
- Flexible question formats: Customize your surveys with various question types like text fields, radio buttons, drop-downs, checkboxes, and NPS formats to align with your goals.
- Conditional branching: Tailor follow-up questions based on a visitor’s response to gather more specific feedback.
- Customizable design and branding: Match your surveys to your site’s look and feel with prebuilt themes or custom designs, including logos and multilingual support for global audiences.
- Comprehensive survey dashboard: Easily explore, filter, and visualize feedback with clear charts and reports, making it simple to identify trends and take action.
- Session recording integration: Link survey responses with session recordings to correlate user feedback with actual behavior, helping you identify friction points.
- AI-driven insights with VWO Copilot: VWO Copilot analyzes responses and provides actionable recommendations that let you refine UX to personalize experiences—all within the same platform.
To support its digital transformation, Encyclopedia Britannica leveraged VWO to run on-site surveys, uncover user insights, and test key elements like link color and CTA wording. These experiments led to a smoother user experience and a 10% uplift in click-through rates. Read the full story here.
Pricing
- Free trial: 30 days, all features included.
- Paid: Customized according to your business requirements.
Don’t just collect feedback—act on it. Take the free demo and unlock the full potential of your website insights. You can also opt for a 30-day free trial.
FAQs
Survey analysis software is used to process and interpret survey data/responses to uncover insights, trends, and patterns that support better decision-making.
Tools like SurveyMonkey, Google Forms, Typeform, Qualtrics, and Zoho Survey are commonly used for both survey creation and analysis.
Yes, some tools like Google Forms, SurveyMonkey (basic plan), and Typeform offer free versions with limited analysis features.
Look for real-time dashboards, AI-powered text analysis, advanced filtering, data visualization, multi-channel feedback collection, and seamless integrations.
The best tool is one that matches your needs—offering ease of use, real-time analysis, strong data visualization, and the ability to handle both quantitative and qualitative data effectively.
Import your data, apply filters or segmentation, and use built-in tools like cross-tabulations, sentiment analysis, and visual dashboards to identify key takeaways and trends.
Start by cleaning the data, then group responses, apply filters, use statistical tools or visualizations, and identify trends or patterns for actionable insights.
Convert survey responses into numerical data by counting response frequencies, calculating percentages and averages, or using standardized scales like NPS or CSAT.
Common methods include mean, median, frequency analysis, cross-tabulation, correlation, and regression. For open-ended responses, sentiment analysis and text mining can be useful.
It saves time, simplifies data interpretation, uncovers deeper insights, and helps teams make faster, more informed decisions.


