Experimentation has been around for a long time, but the 21st century has transformed it dramatically. With the emergence of modern tech, data collection and experimentation have become much more accessible, enabling their wide-scale adoption. Modern tech businesses run hundreds of monthly experiments to learn how users respond to incremental changes in online products. The line between engineers, marketers, and scientists is gradually dissolving.
As fascinating as it is, the field of experimentation shows aggressive potential for further evolution. The future of product development needs a sophisticated experimentation platform—one that can track a diverse set of metrics, take fast action to stop harmful experiments, and ensure the trustworthiness of campaign results under various circumstances. At VWO, our vision is to build a culture of experimentation that liberates everyone to test all their ideas.
However, data-driven decision-making demands robust statistical guarantees. With the widespread adoption of experimentation, the gaps in classical statistics have come to light. It is no longer adequate to simply gather data, perform a statistical test, and declare findings statistically significant based on a p-value. Leading experts like Kohavi and Thomke assert, “Getting numbers is easy; getting numbers you can trust is hard.” Modern A/B testing actively needs statistical reforms to keep pace with these advancements.
At VWO, we have consistently pioneered catering to experimentation’s needs. Over the last two years, we brainstormed about the most pressing problems and dug deep into statistics to solve them. We then stepped back to see how each solution fits into an ambitious enhanced SmartStats – Bayesian powered sequential testing engine that powers VWO reports.
This blog post introduces our enhancements to reports and explains why they should interest you, the modern experimenter. Overall, we have improved in four core areas.
- Measure: With the ability to define different types of metrics, you can summarize much more information in your campaigns.
- Analyze: Our new stats engine ensures that your error rates are within defined limits in all scenarios.
- Act fast: Advanced statistics help you act fast in cases where you can save visitors.
- Monitor: VWO now runs background health checks that notify you whenever something goes wrong in your campaign.
Measure a diverse set of metrics
Metrics define the objective of improving when testing a change. Any change you make to your product impacts various metrics of interest, typically in a domino effect (Better Headline -> Higher Page Engagement -> Higher Conversion Rate). The capacity to define and track the right metrics enables you to expand your vision and ensure you are measuring what matters most to your business.
Most commonly, three types of metrics are utilized. The primary metric defines the metric you are trying to optimize in a campaign. The secondary metrics are the side metrics important for a detailed understanding of the campaign. The guardrails are the metrics that should not drop since they’re used to track and protect critical business KPIs.
The proper set of metrics allows you to set up a robust, transparent, and faster experiment. Enhanced VWO Reports provide the following features to help define different kinds of metrics:
1. Track any event on your page
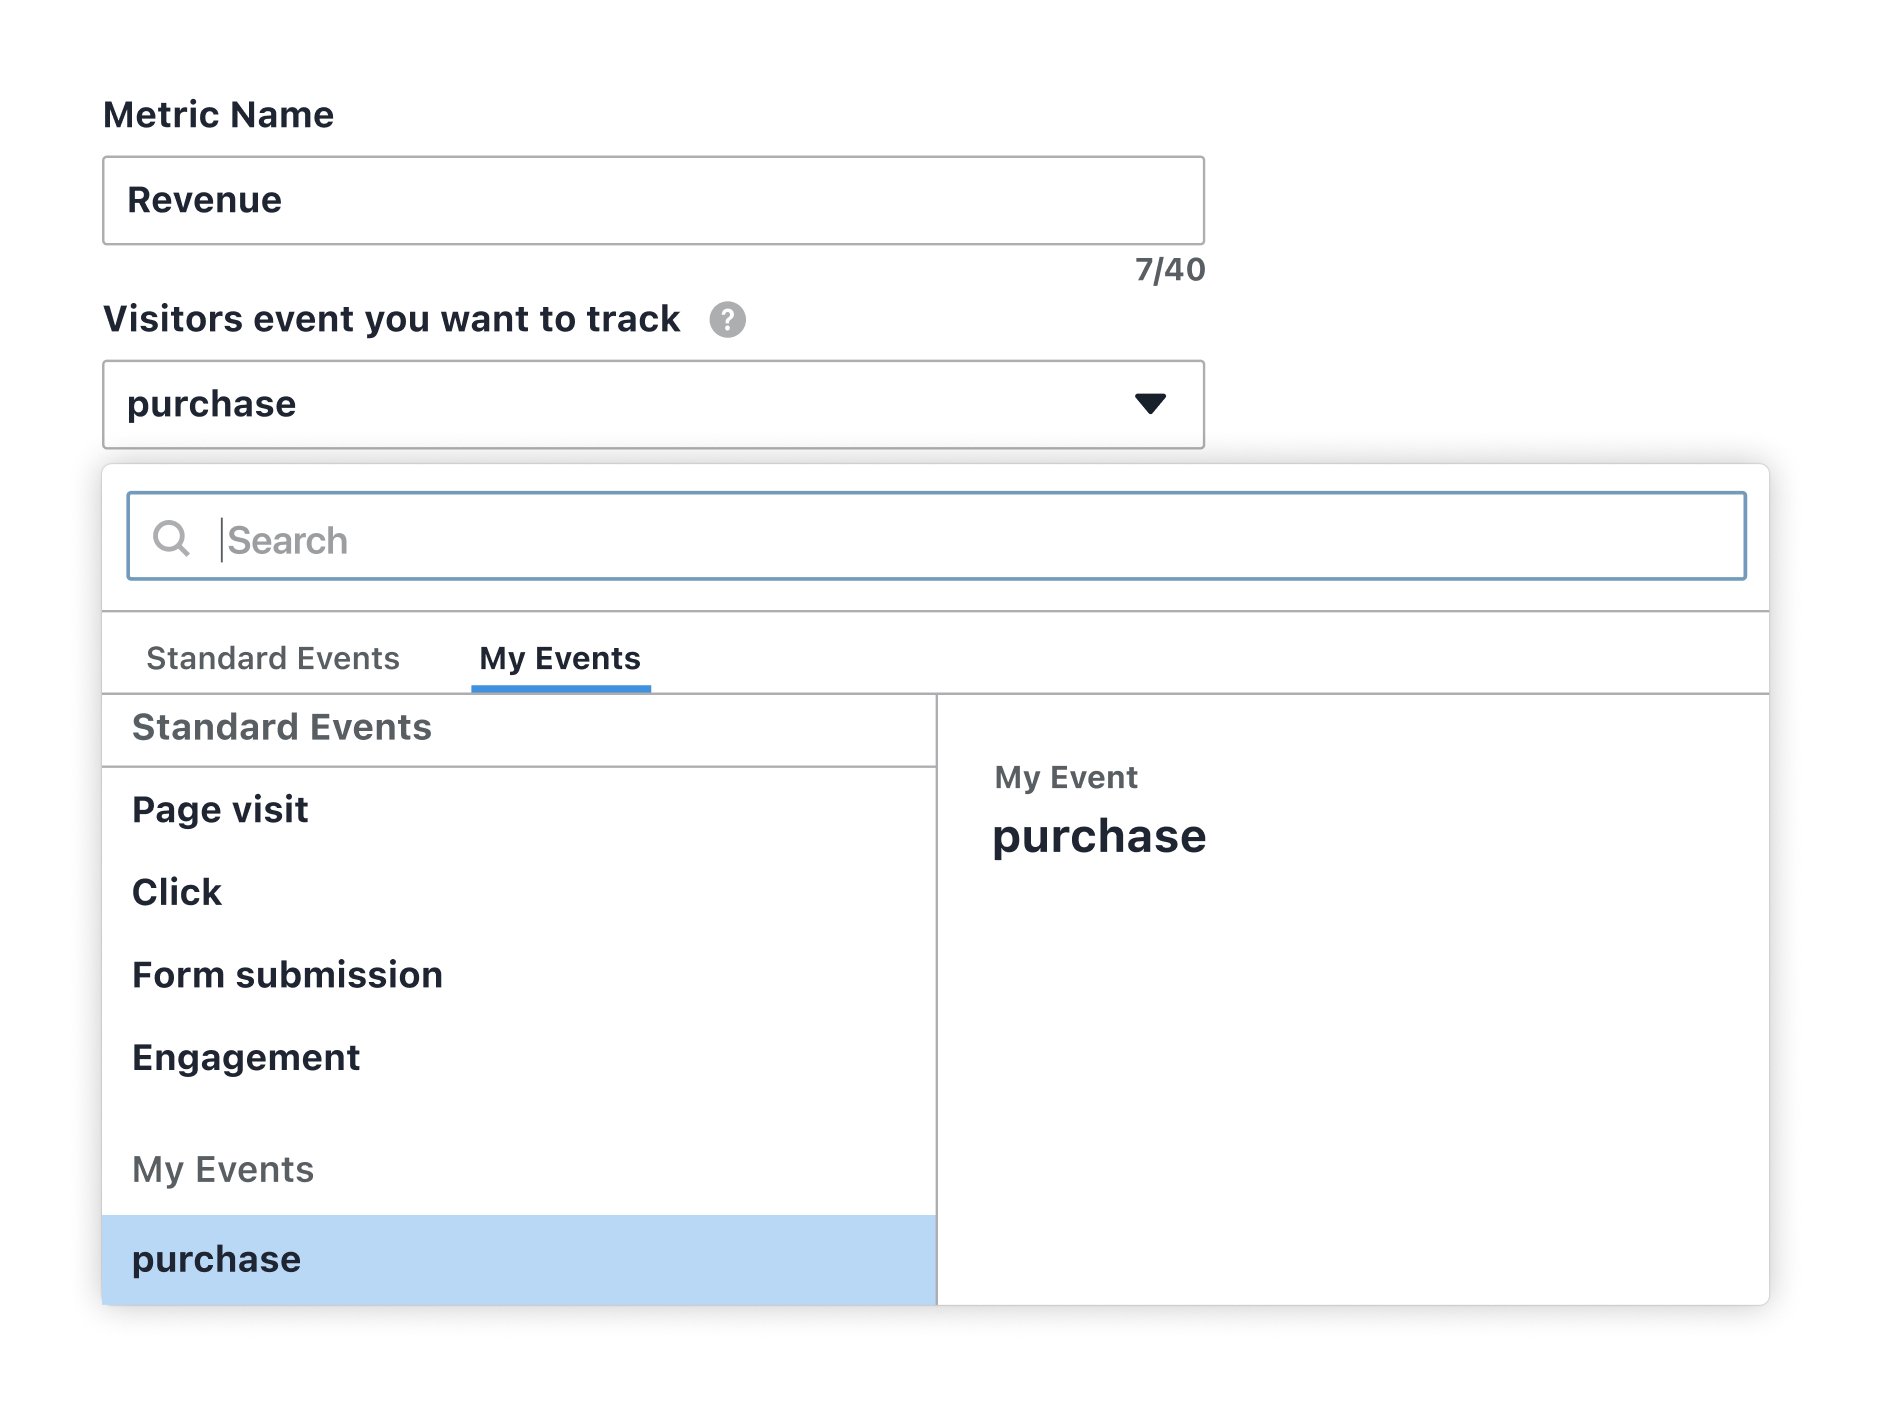
You can now define any page event as a metric in VWO and calculate accurate statistics for various metrics. A page event is any user interaction or occurrence on your website or app. A click, a scroll, or a page load issue can all be events.
Simple metrics record whether an event happened for a particular visitor or not (also called Binary). Non-binary metrics record a property associated with an event, such as the dollar value associated with an order or the time taken to complete it.
2. Define the direction of improvement
By defining a downward direction of improvement, you can instruct VWO statistics to calculate winners in the opposite direction (for metrics like refund rates, cart abandonment rates, and bounce rates).

3. Define your campaign’s guardrail metrics
You can now define the metrics that should not be negatively impacted in a campaign. VWO automatically disables a variation if a guardrail metric gets negatively affected. For instance, when testing a new homepage design, you should ensure that the page crash rate does not increase significantly.

4. Save statistical defaults with each metric
You can now define different metrics, save them with their statistical configurations, and use them in multiple campaigns. This allows you to define crucial KPI metrics with the team and distribute the relevant metrics to optimize and safeguard to different members.

Analyze with trustworthy and tunable statistics
Classical Statistics is delicate, and the error rates tend to inflate whenever you calculate statistics more than once in a campaign. Unlike traditional scientific studies, modern A/B tests do not just calculate statistics after reaching the desired sample size. Instead, they continuously calculate statistics as data gets collected and decide to stop once statistical significance is reached. Further, they often have multiple variations being compared against a baseline. Both conditions increase the chances of a false winner in the campaign, and early winners could show exaggerated uplifts.
Our new stats engine applies the relevant corrections to provide the following benefits to you:
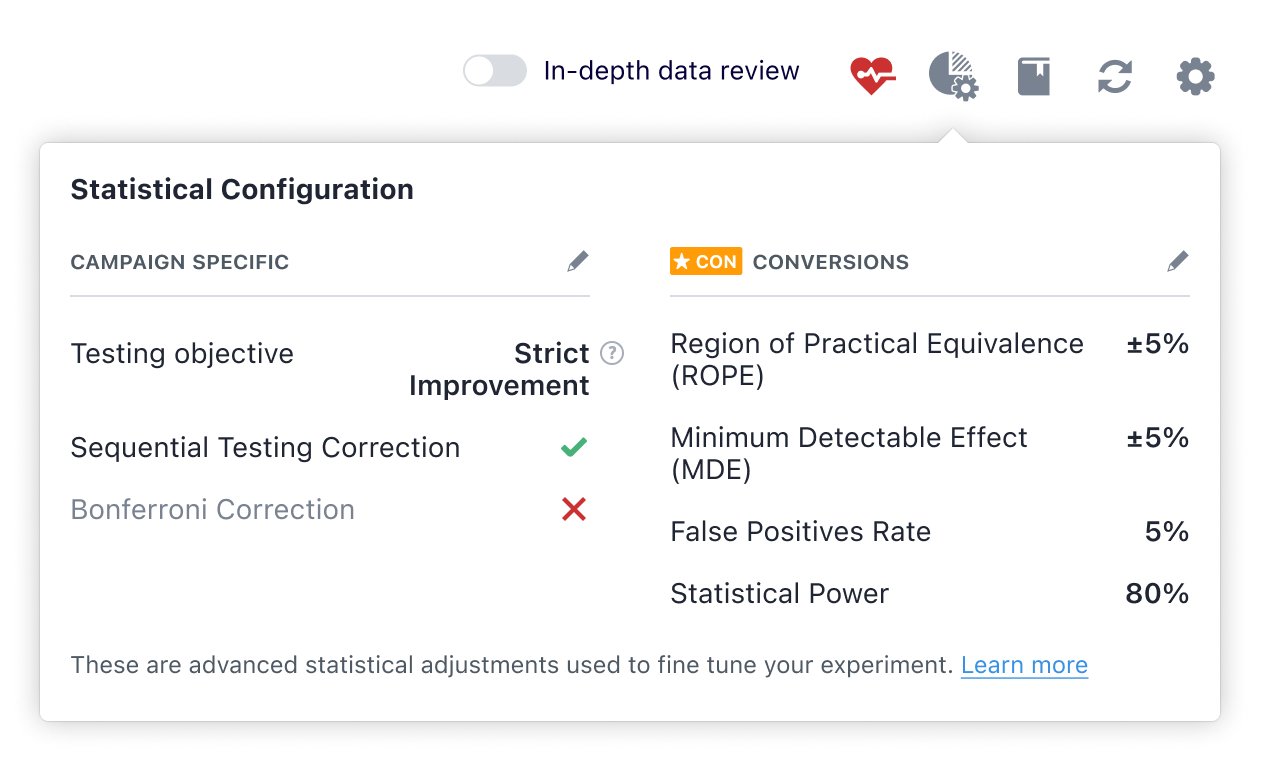
1. Sequential and Bonferroni corrected statistics
Adjustments are applied to account for the problems of continuous monitoring and multiple variations. This ensures that your statistical errors are within the defined limits.

2. Predetermined maximum visitor requirement
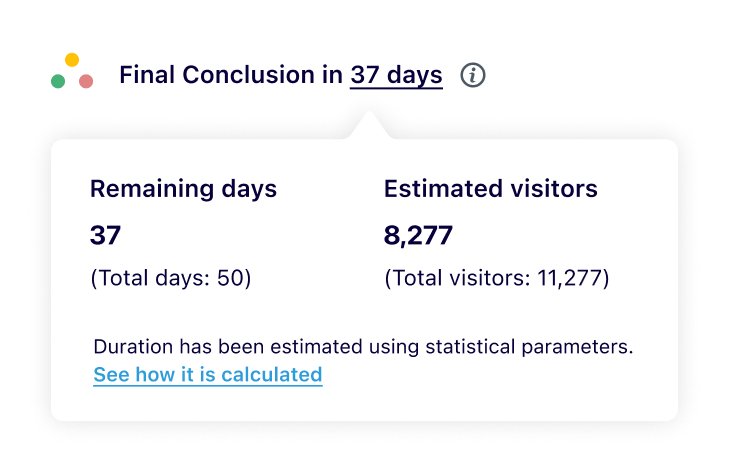
After initial data collection and at least one conversion, you are informed of the campaign’s maximum visitor requirement. This helps you decide early if you are ready to invest the required number of visitors in the campaign.
3. Tunable statistical parameters
With the new stats engine, you can now adjust the crucial statistical parameters of statistical power, accuracy, and minimum detectable effect to invest more visitors in campaigns that need more certainty.
4. Fixed horizon tests
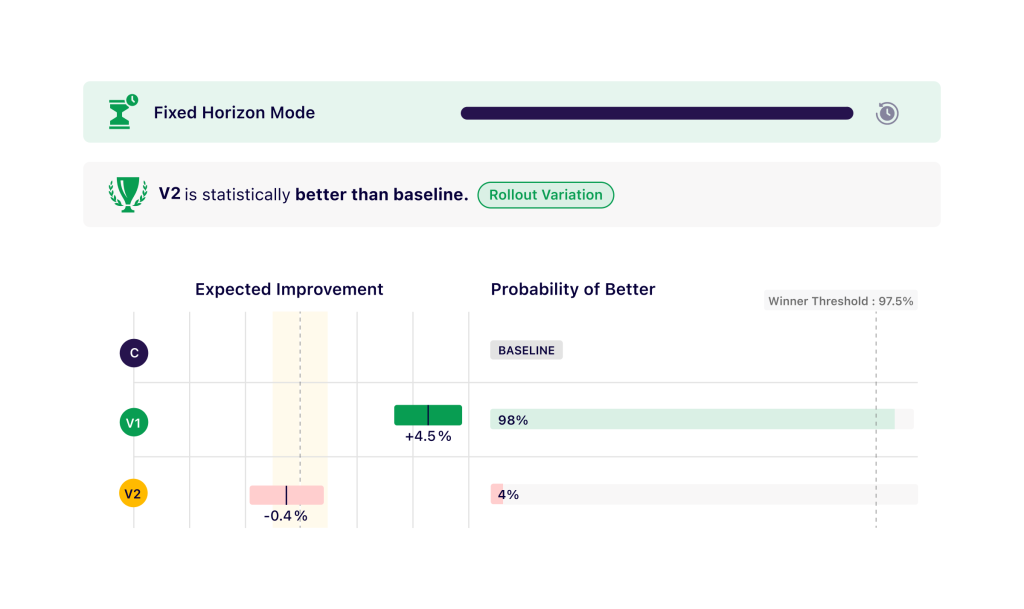
Fixed horizon test calculates results only after collecting the entire sample size. Conclusions are made after the campaign’s pre-set duration ends, making it ideal for enterprises ready to wait until the end of experiment for the results and do not want to take the chance of any peeking errors.
Act fast and save visitors with smart recommendations
Most early-stage companies and low-traffic products struggle with gathering the appropriate sample size to run their experiments. Hence, it has become necessary to find ways to save visitors in a campaign backed up with robust statistical guarantees.
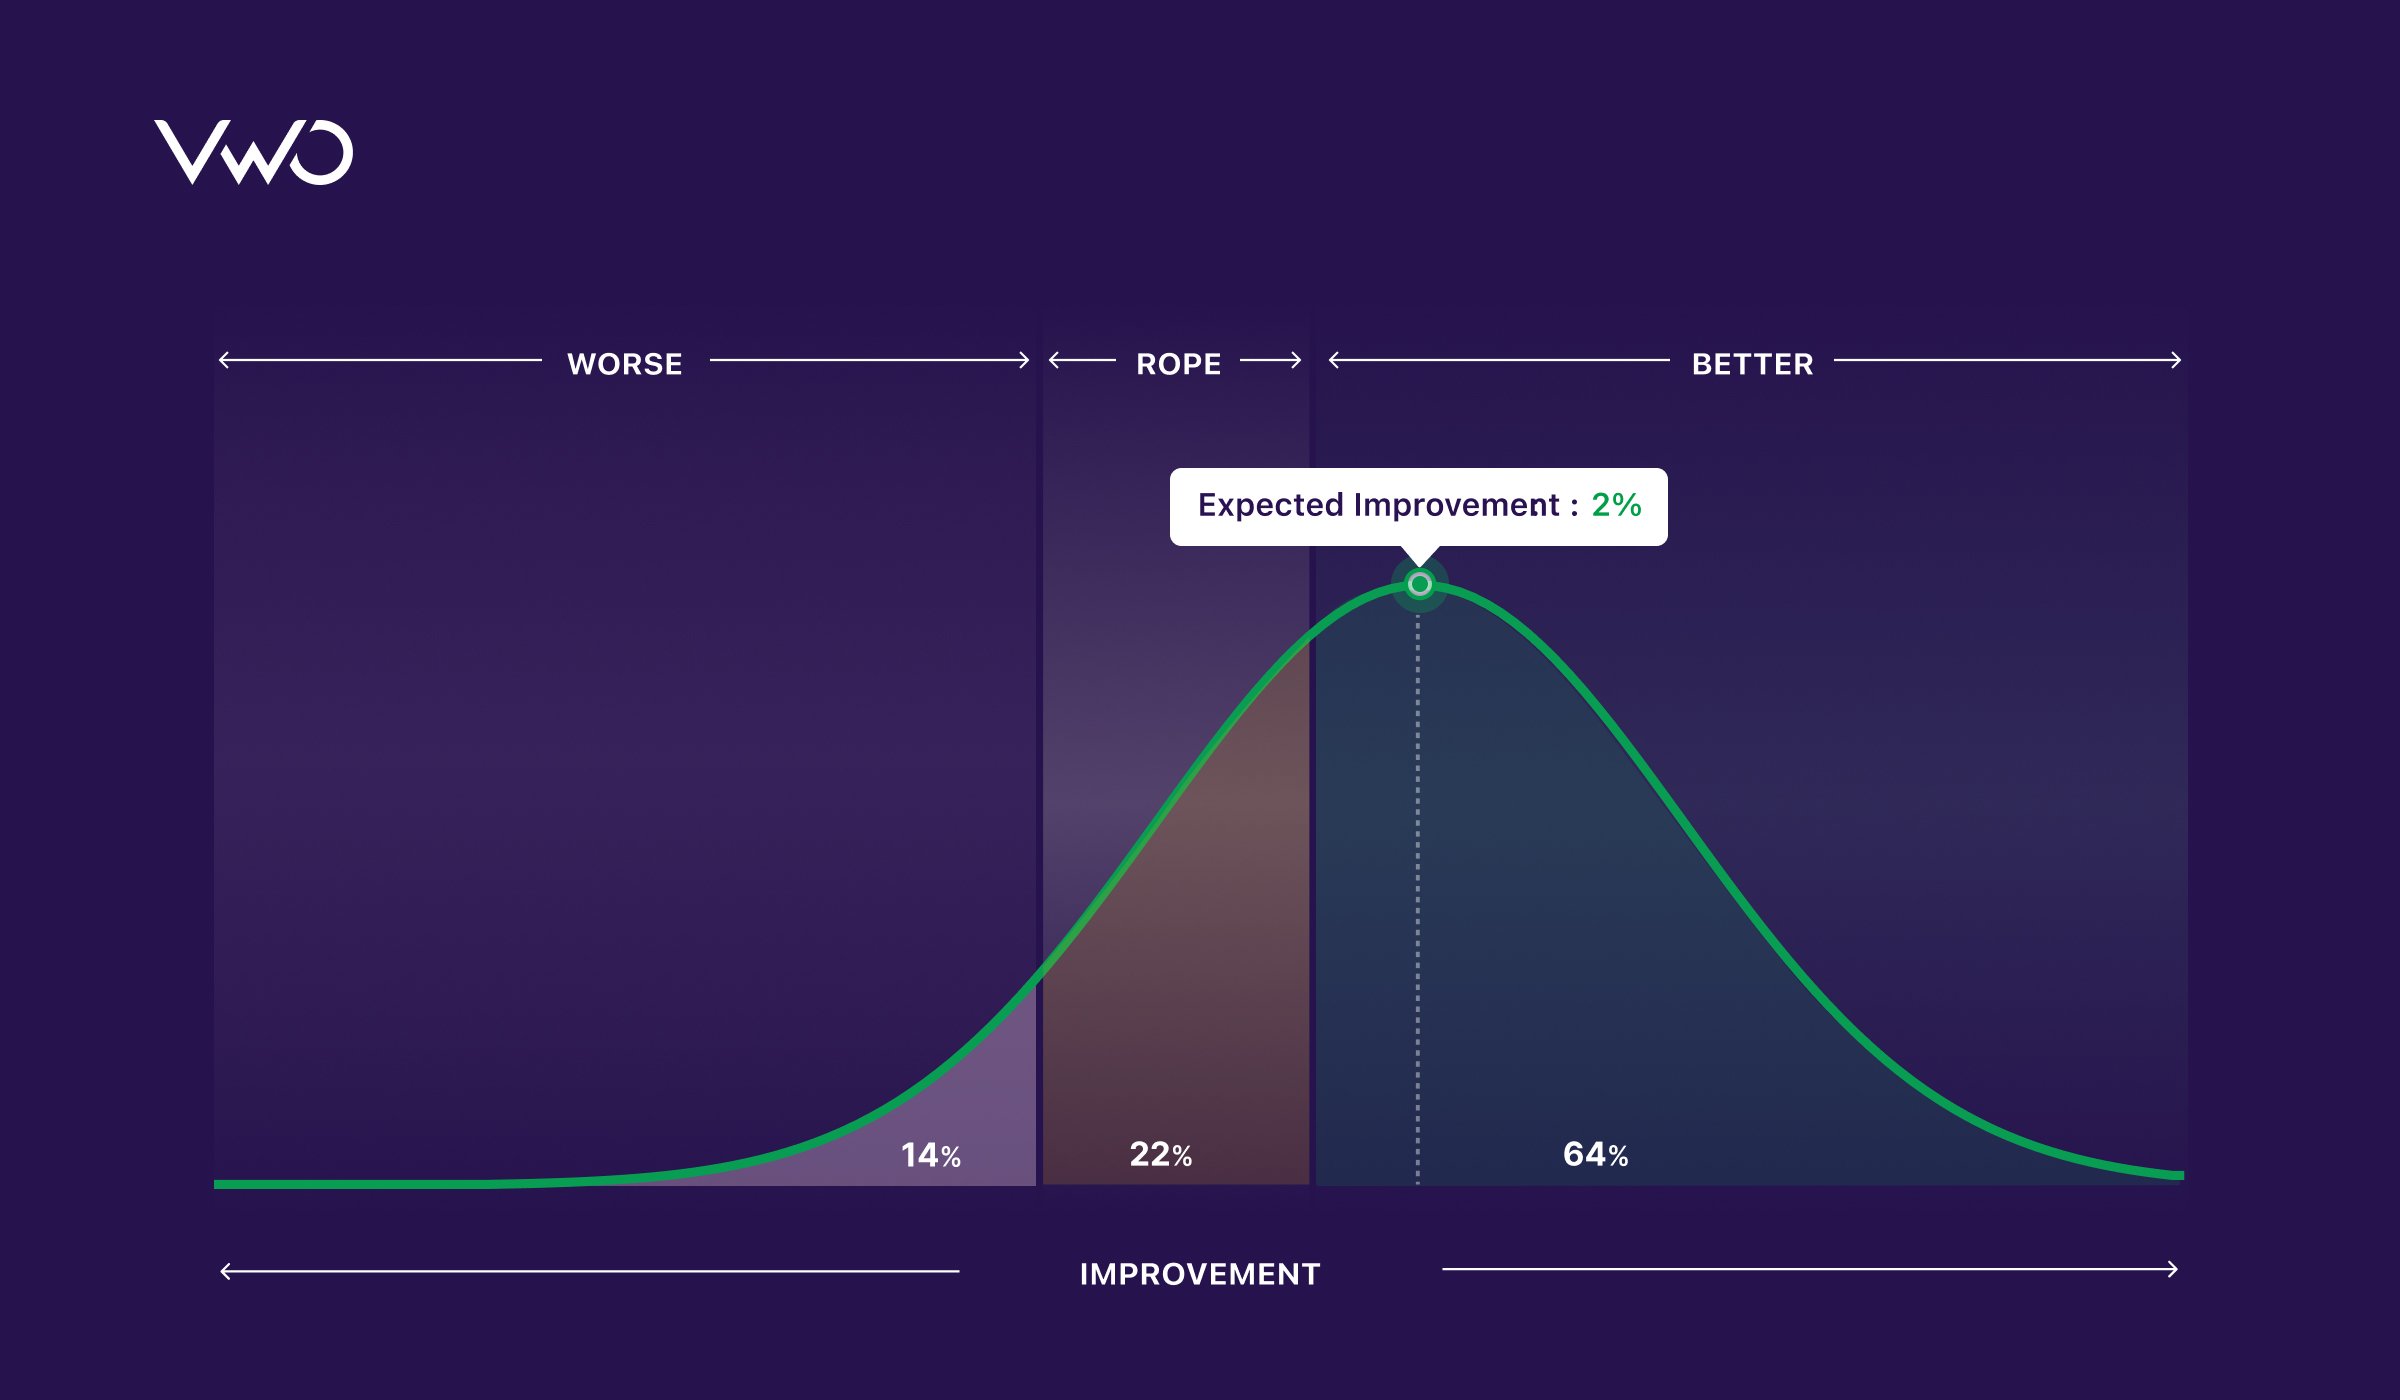
Classical Statistics focuses on testing if one variant is better than the other (A > B) but never considers the possibility that two variants can be practically equivalent (A ≈ B). Continuous statistical monitoring means the test can be stopped early only if a winner is found. There is no statistical signal to stop a test early if A and B do not show much difference in the campaign.
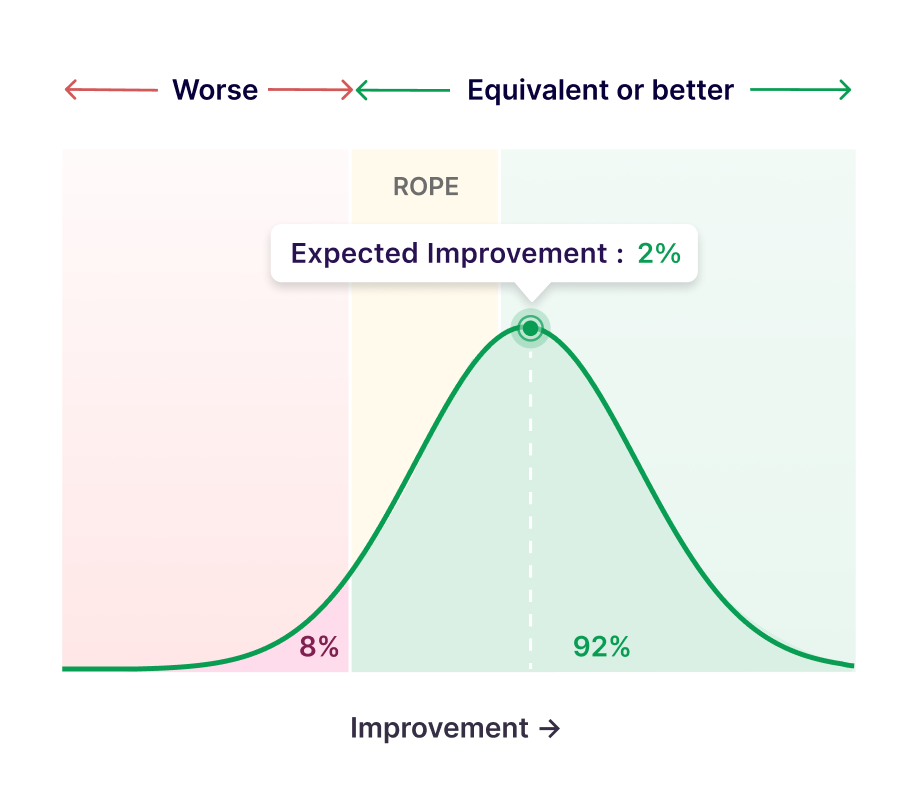
In the new stats engine, we introduced the concept of practical equivalence, which considers that A and B can be practically equivalent within a defined range. The region of practical equivalence (ROPE) hence generates a signal for the early stopping of underperforming variations.
All in all, the new stats engine uses three clever ways to save visitors in your campaign.
1. Early discovery of winning variations
Our new reports declare a winner when a variation reaches statistical significance and recommend deploying the winner and ending the campaign early. Hence, if the maximum sample size was configured to test for a minimum uplift of 5%, but you actually get an uplift of 20%, your test will end much earlier.

2. Early stopping of underperforming variations
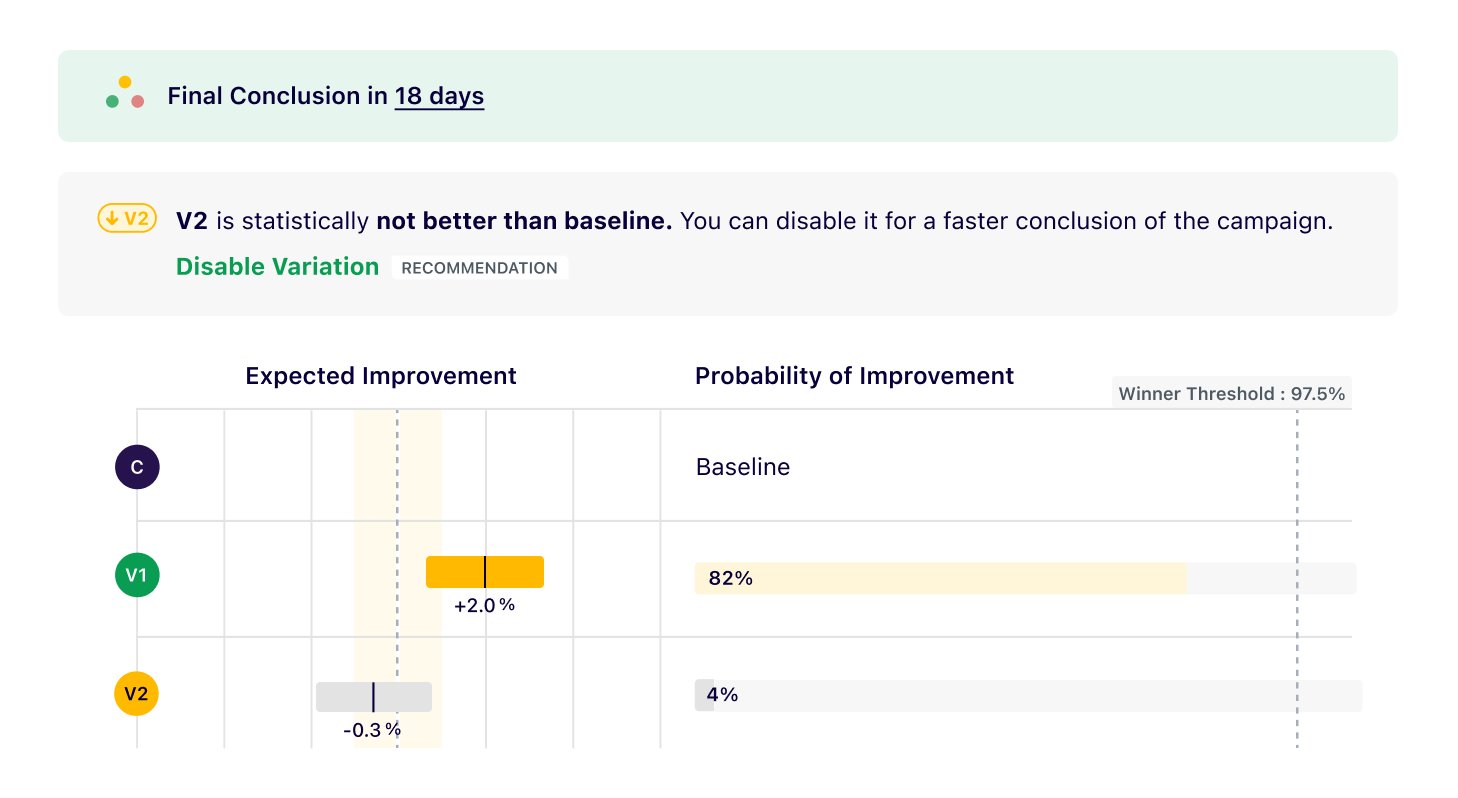
We iteratively recommend disabling any variations that do not show a potential to be the winner. Most variations that have an uplift within the range of practical equivalence can hence be disabled earlier.
3. Testing for improvement and equivalence
A separate testing mode allows you to save visitors by testing on the relaxed condition of “improvement or equivalence.” Suppose you launch a new homepage design and only want to test that conversion rates should be equivalent or better (but not worse). You can reach significance faster in such campaigns.
Smartly designed recommendations help you make preemptive decisions and divert traffic toward winning variations.
Monitor the health of your campaign with experiment vitals
Modern A/B tests are run in highly randomized environments. Visitor behavior changes throughout the week, different devices and software stacks become part of an experiment, and crucial changes are often made to a running campaign. In such an environment, the statistical integrity of campaign results is frequently impaired.
Experimenters often ask if there is a checklist to ensure that campaign results are reliable. Sadly, no such checklist exists. We learned that it is much more helpful to constantly check for possible errors, address them as soon as possible in a campaign, and discard the campaigns likely to give unreliable results.
Hence, we have developed various statistical checks and balances that constantly run in the background and inform you whenever one of your campaigns requires attention. Corrective measures are offered wherever possible. Some of these crucial checks are as follows:
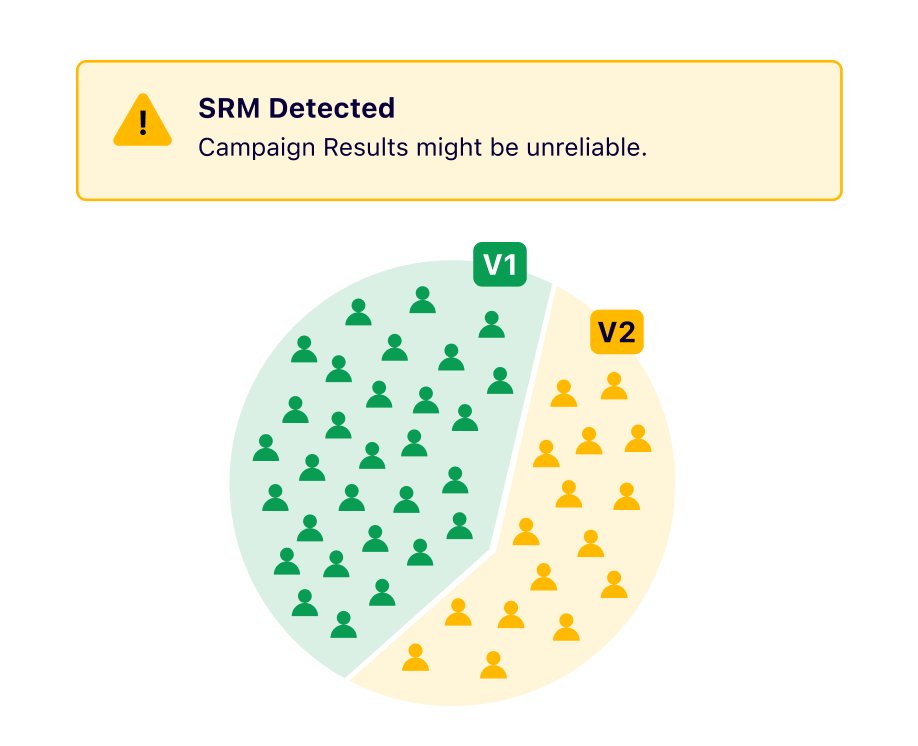
1. Sample ratio mismatch (SRM)
SRMs are a common error symptom across various data and campaign setup issues. They are triggered when the observed traffic distribution in the campaign across variations is significantly different from the defined traffic split.
SRMs happen because one or more segments of visitors are not behaving as expected. For instance, if 20% of test visitors use a browser where the variant fails to load, then it is likely that there will be an SRM in the campaign.
When SRMs are found, they are a strong indicator that test results are unreliable and should not be trusted. In some cases, the problematic segment can be identified and excluded from the analysis; the rest of the data is considered reliable.
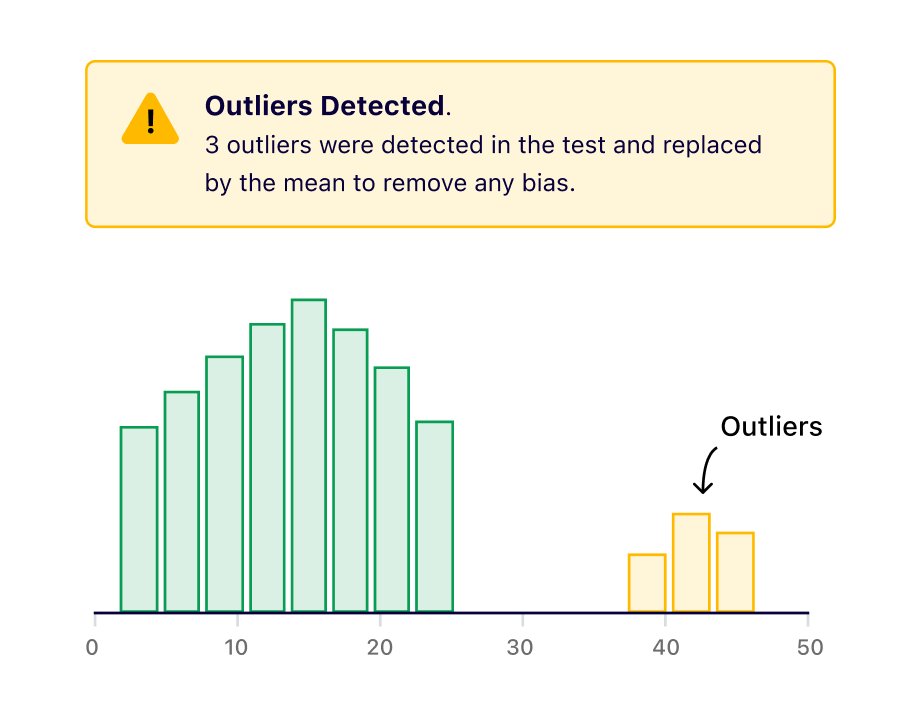
2. Outlier detections
Outliers are exceptionally large values that skew the results of the variation they belong to. Enhanced Reports continuously monitor them and allow you to exclude them from the analysis.
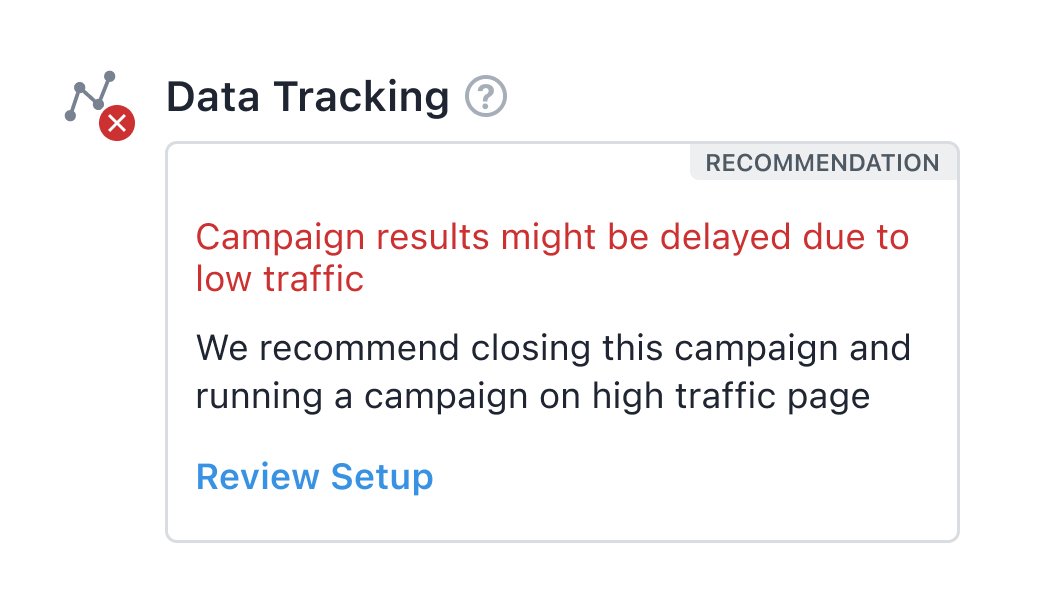
3. Traffic and data-related issues
We will inform you early when your campaign has a low traffic issue or if data is not being tracked so that corrective action can be taken.
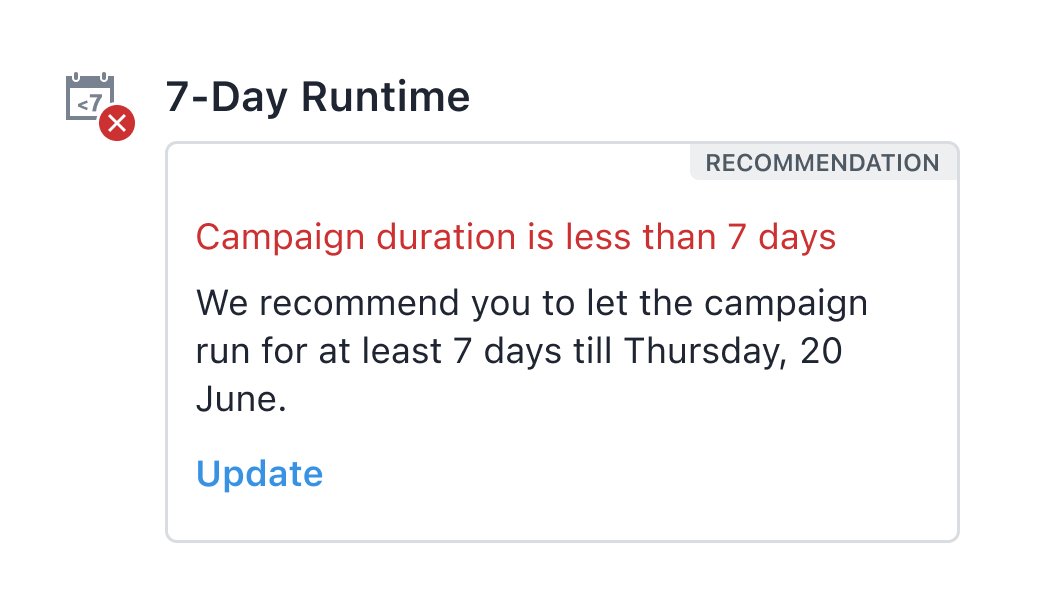
4. Less than 7-day runtime
All campaigns should run for at least 7 days to account for the weekly variability in user behavior. We advise you to wait if you get a conclusion before 7 days in a campaign.
5. User-action-related issues
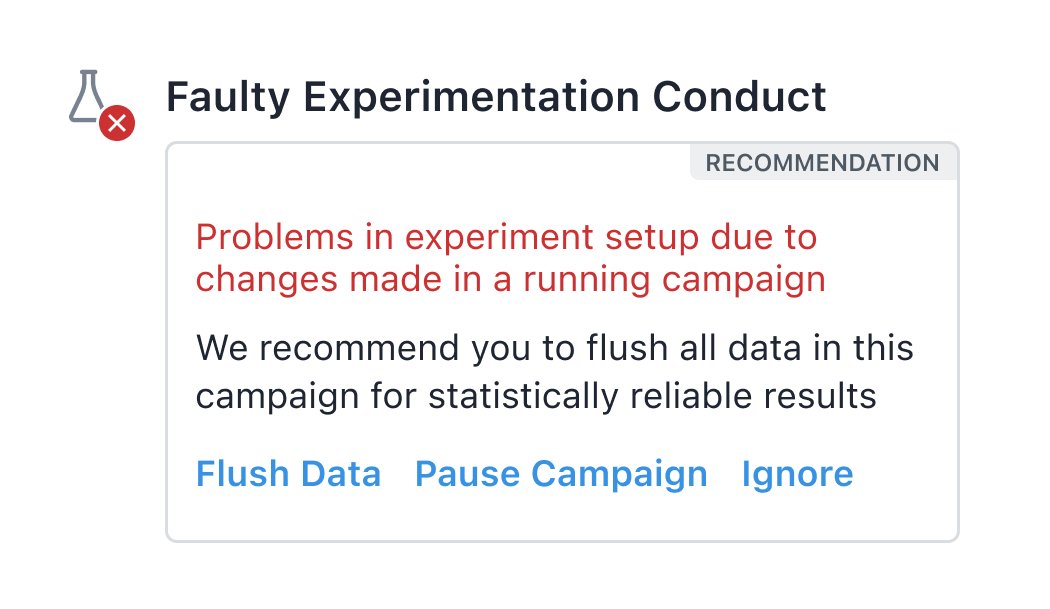
If you perform any actions in a running campaign that might compromise the integrity of the data, VWO generates an alert. Such changes include variation content, audience targeting, or metric definition changes.
Conclusion
With recent developments in AI, our broader vision is to use an increasing amount of automation and AI in experimentation. A sophisticated reporting platform should act as a scientist who carefully picks out all good ideas and quickly discards the bad ones during product development. An advanced experimentation product should safely allow rapid but robust testing of ideas. All members of an organization should be liberated to test all their ideas without worrying about negatively impacting crucial KPI metrics.
Our enhanced VWO reports and the new stats engine will help you scale your optimization journey with confidence and efficiency. Stay tuned for more such advancements and detailed write-ups from VWO! Happy experimenting!


