Innovation and experimentation go hand in hand. The world’s most successful brands didn’t reach the top by playing it safe—they tested, iterated, and learned from every outcome.
Today, experimentation is no longer confined to specific regions or industries. Businesses across the globe are embracing a culture of testing, refining, and optimizing to stay competitive in an ever-evolving digital landscape.
Through our CRO Perspectives series, we’ve had the privilege of speaking with experts who are shaping the future of experimentation—leveraging data, user insights, and creative strategies to drive meaningful growth. By learning from the best, we not only uncover powerful strategies but also inspire others to build their own success stories.
For our fourteenth post in the CRO Perspectives series, we sit down with Jihee Yoo, who shares how South Korea’s optimization landscape is evolving. From harnessing user behavior insights to running data-driven tests, she provides valuable perspectives on the region’s growing experimentation culture.

Leader: Jihee Yoo
Role: Senior Analytics Manager at Jellyfish, South Korea
Location: Seoul, South Korea
Speaks about: Data analytics • User behavior • Optimization
Why should you read this interview?
Jihee Yoo is at the forefront of innovation in data analytics—where strategy, technology, and growth intersect. As Senior Analytics Manager at Jellyfish Korea, she’s played a key role in driving performance through smarter data practices.
From leading GA4 implementations and UA to GA4 migrations to developing a custom demo app for testing Firebase data collection across Android and iOS, Jihee has laid the foundation for real-time behavioral tracking and more agile, insight-led decision-making.
Her expertise spans GMP tools and Google Optimize, which she uses to deeply analyze user behavior, fine-tune performance, and ensure campaigns deliver measurable outcomes. With previous roles at Spiral Media and iProspect, Jihee has built a career on driving clarity from complexity and pushing analytics forward in fast-paced environments.
Jihee offers a clear-eyed view of how to make data not just informative, but actionable—especially for brands aiming to optimize user experience and make smarter decisions faster.
Whether you’re in product, marketing, or data, her experience offers actionable lessons on analytics and optimization that truly support smarter decisions.
How to drive real impact with data
At Jellyfish, we ensure that data insights translate into actionable steps by aligning our analysis with business goals from the outset. Before diving into the numbers, we work closely with clients to understand their key performance indicators (KPIs) and decision-making processes. This alignment ensures that every insight we deliver is tied to a tangible business objective, making it actionable rather than just informative.
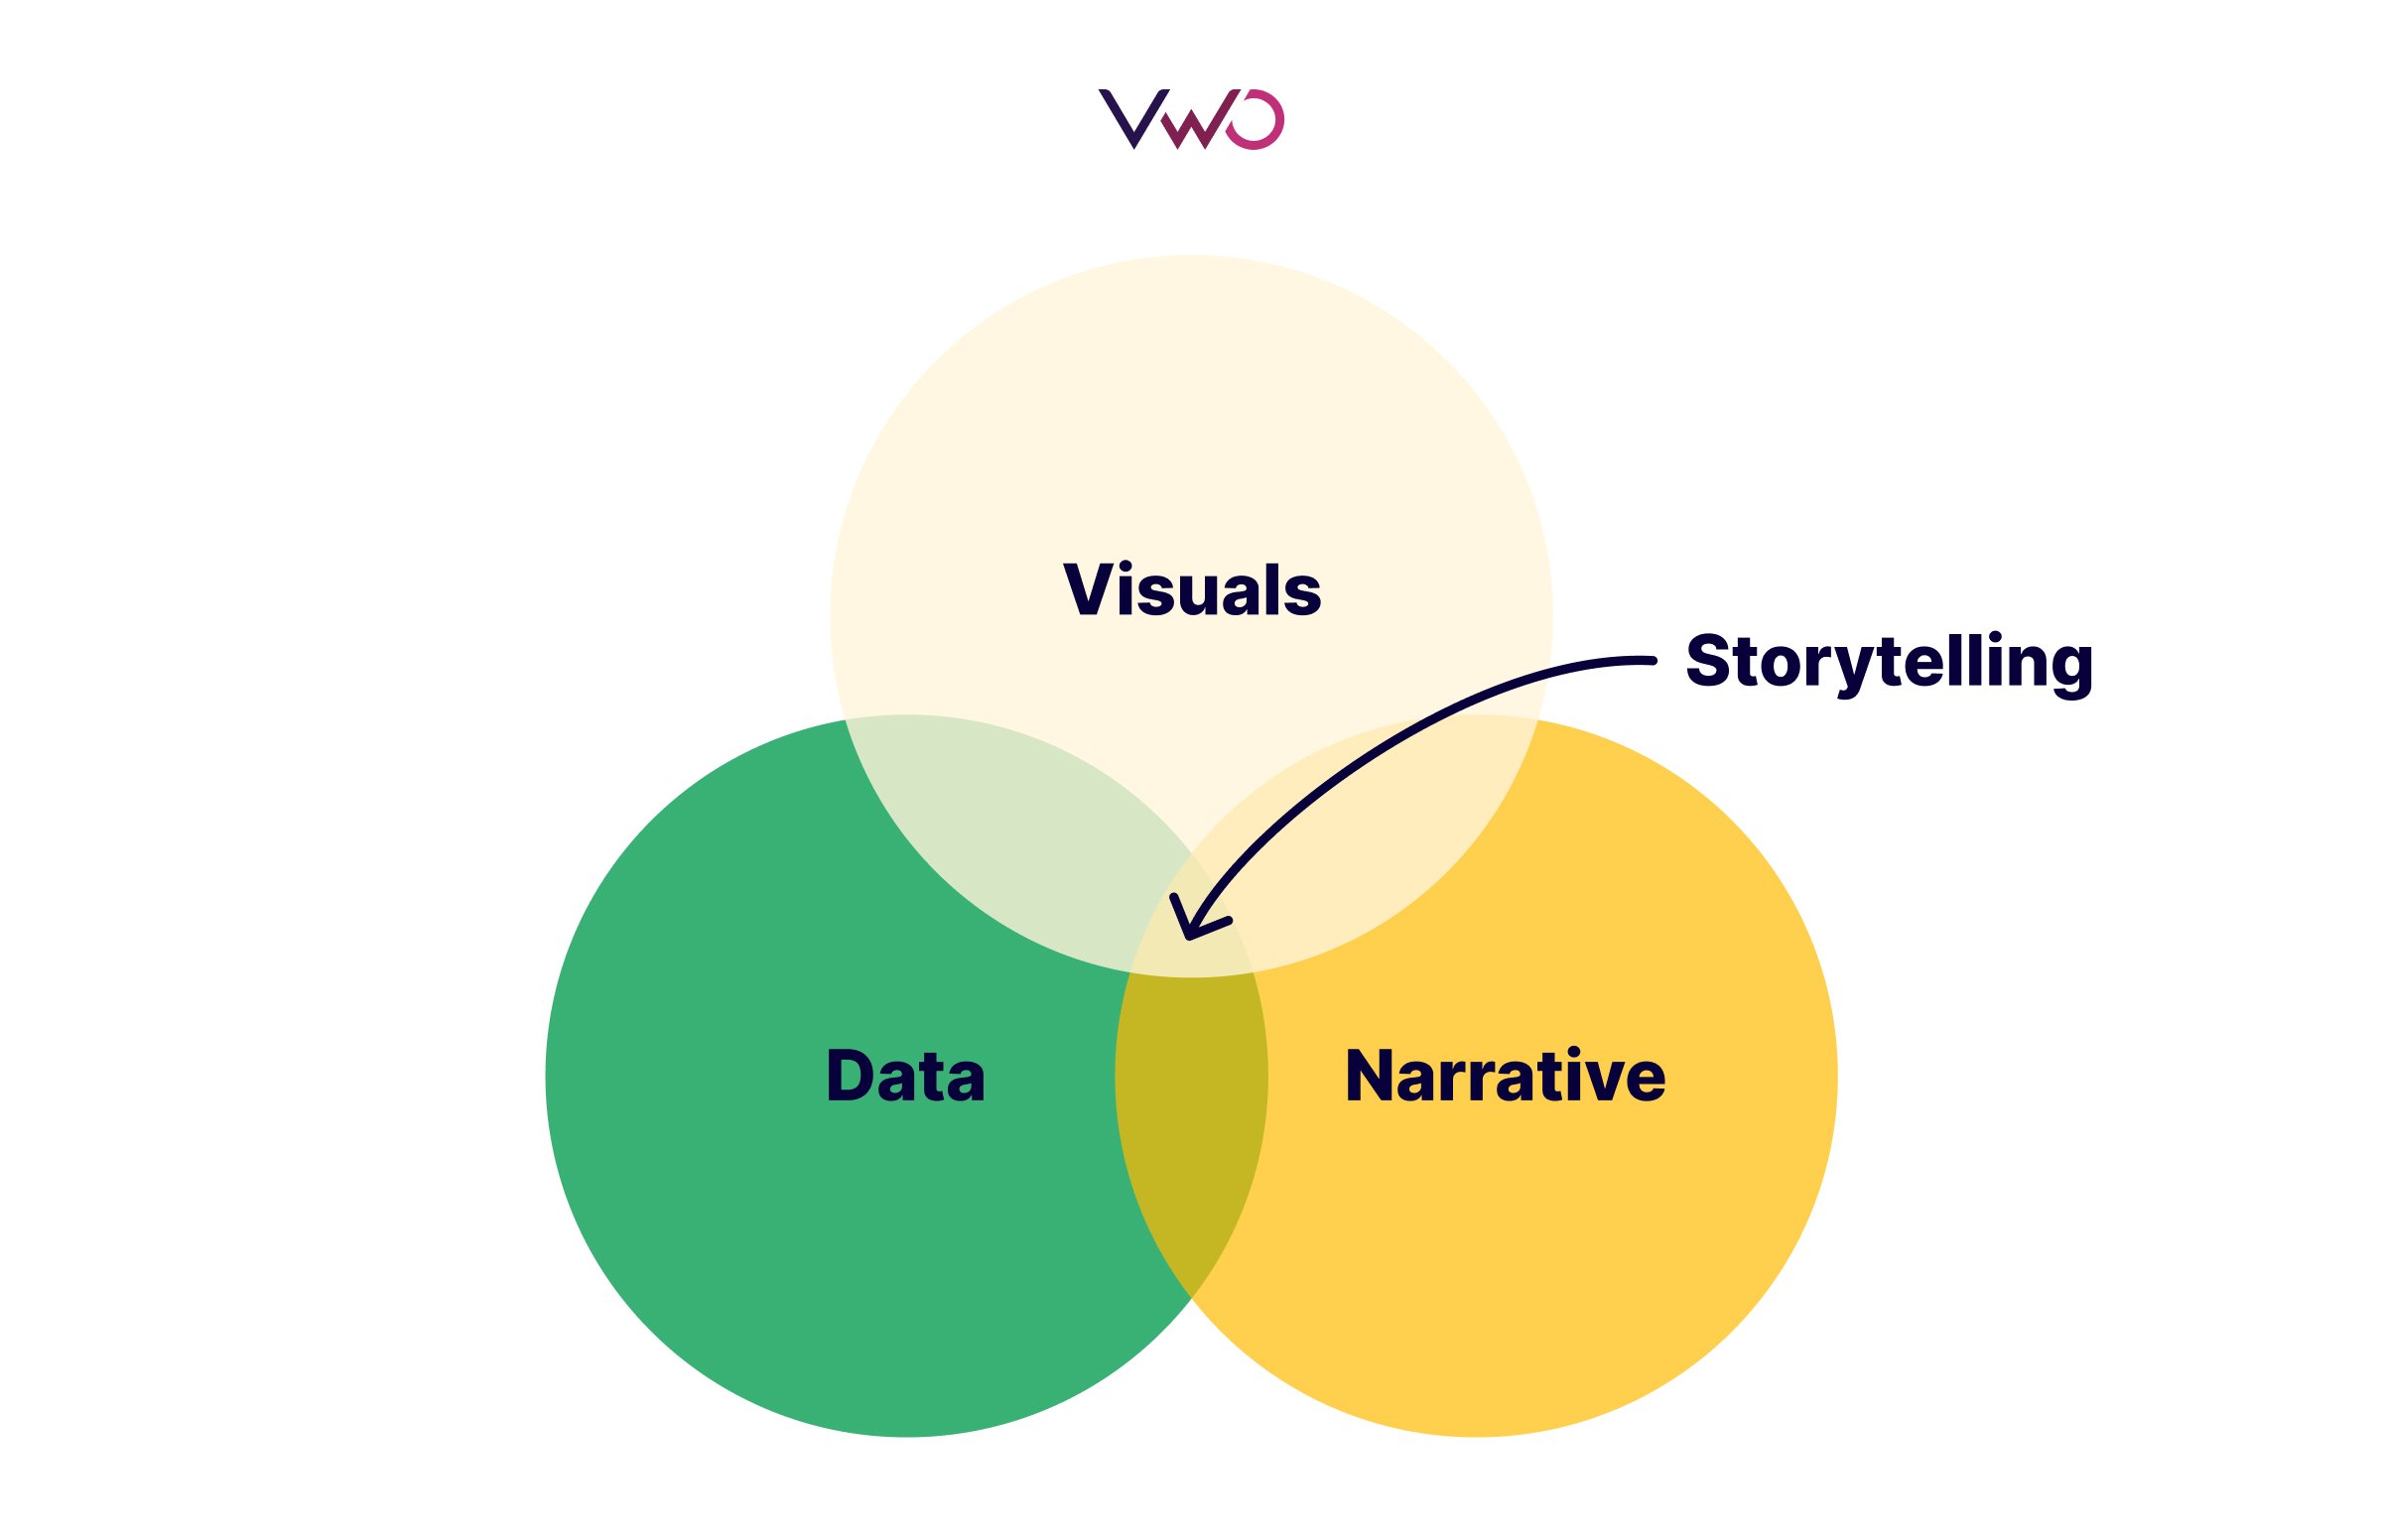
A crucial aspect of our approach is data storytelling. For instance, rather than stating, “Conversion rates increased by 5%,” we frame it as, “By optimizing the user flow, we increased new user conversion rates by 5%, generating an additional $200K in revenue.” This makes the data more compelling and directly linked to business impact.
Beyond reporting, we emphasize rapid experimentation and execution. We don’t just present insights; we implement and test them quickly. One example involved a client struggling with low click-through rates on their CTA button. After analyzing user behavior, we tested new CTA copy variations, which led to a 12% increase in click-through rates. This iterative approach ensures that insights lead to measurable improvements rather than remaining as static reports.
Instead of overwhelming clients with raw data, focus on clear, intuitive visualizations and narratives that make insights easier to grasp.
Key factors for an effective A/B test
Running effective A/B tests requires a structured approach, starting with a well-defined hypothesis. Instead of testing random ideas, we always begin with a clear, data-backed assumption. For example, if we hypothesize that personalized product recommendations will drive higher conversion rates than generic ones, we frame the test accordingly.
Another critical factor is ensuring a sufficient sample size and appropriate test duration. Running a test for too short a time may lead to misleading results, while overly long tests can waste valuable resources. One of our e-commerce clients tested different checkout flows over two weeks, gathering enough data to make a statistically significant decision. In one instance, segmentation revealed an interesting insight: mobile users favored a red CTA button, while desktop users responded better to a blue one.
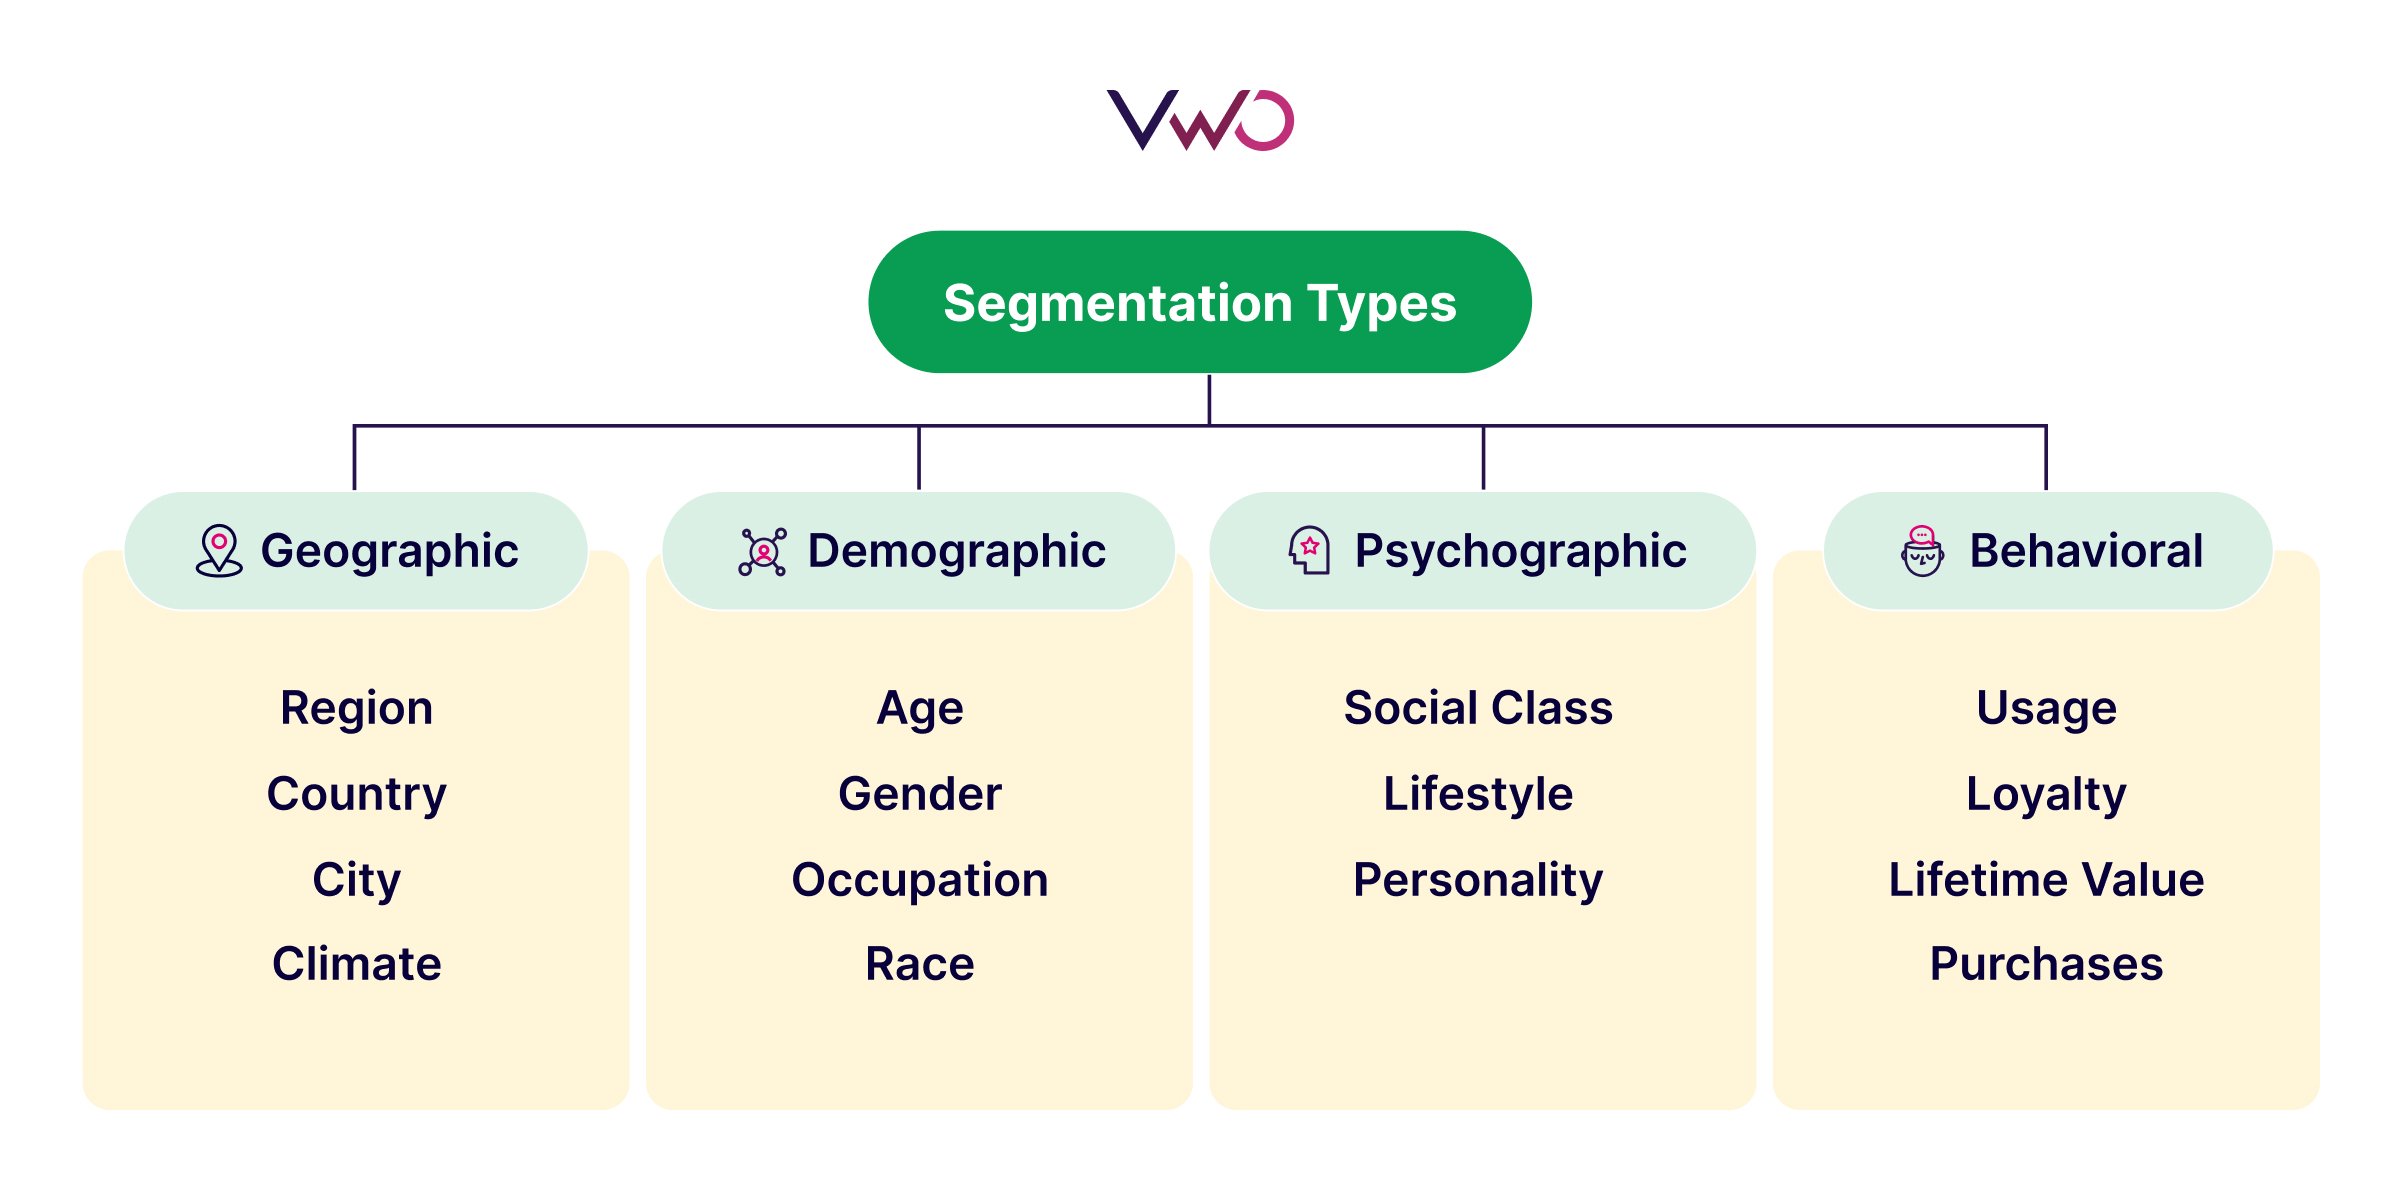
Go beyond surface-level metrics like click-through rates or conversion rates, diving deeper into behavioral segmentation. These insights lead to a tailored strategy that significantly improves engagement across all segments.
Limitations of data
Data is incredibly valuable for identifying past patterns, but relying solely on it to predict the future can be misleading. For example, a company may notice that a particular ad campaign performed well last quarter. However, external factors such as market trends, competitor actions, and shifting consumer behavior mean the same campaign might not yield the same results again.
One example of this occurred when a seasonal sale drove strong results one year, but when replicated the following year, conversion rates dropped significantly due to changing consumer expectations.
Data analysis should not just be about forecasting the future but should focus on continuous testing and adaptation. The key is to use data to inform decisions while remaining agile in response to market dynamics.
Quantitative vs. qualitative: How to use both for smarter CRO decisions
Quantitative analysis through Google Analytics 4 (GA4) and qualitative analysis through tools like heatmaps serve complementary roles in data analysis. GA4 excels at identifying broad trends and tracking key metrics such as conversion rates, traffic sources, and user flows. It also allows businesses to analyze multi-channel data and understand how different touchpoints contribute to conversions. However, GA4 has limitations, including its inability to explain why users behave in certain ways. Additionally, real-time tracking can be limited, and data sampling may impact accuracy.
Qualitative tools, on the other hand, provide visual insights into user behavior, revealing where users click, scroll, and drop off. This makes them particularly useful for uncovering UX/UI friction points that GA4 alone wouldn’t reveal. However, tools like heatmaps also have their limitations, such as being based on sample users rather than the entire audience and making it harder to track long-term conversion impacts.
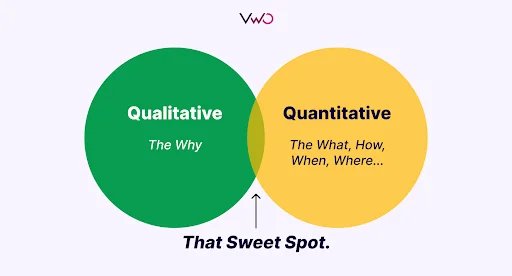
By using both tools together, businesses can gain a more comprehensive understanding of user behavior. For example, GA4 may indicate that a key landing page has a high bounce rate, but it won’t explain why. A heatmap might reveal that users aren’t scrolling past a certain point or are ignoring a CTA. This combined approach enables more effective A/B testing and UX optimizations.
Tips on making the most of GA4
To maximize the value of GA4, businesses should focus on optimizing event tracking since GA4 is an event-based analytics platform. Defining the right key events is crucial to obtaining meaningful insights. Another best practice is using BigQuery for advanced analysis, as GA4’s UI has limitations. Exporting data to BigQuery allows for more detailed, customized analysis.
Additionally, integrating GA4 with A/B testing tools enhances experimentation strategies. By leveraging GA4’s audience segmentation and event tracking capabilities, businesses can refine test strategies and measure outcomes more effectively. For example, we worked with a client to redesign their checkout flow based on GA4 insights, leading to a 9% uplift in conversions.
What works in app optimization: Lessons from various industries
I’ve worked on projects across industries like eCommerce, telecom, and e-cigarettes—each presenting unique user behaviors and challenges.
In eCommerce, the primary challenge is simplifying the purchase journey. We tackled this by implementing personalized product recommendations and streamlining the checkout process, leading to improved conversions and higher retention rates.
For telecom apps, complexity is a major hurdle due to the sheer number of features. Our approach was to focus on core user journeys—like plan details, billing, and customer support. By simplifying the UI around these high-impact flows, we significantly enhanced usability and customer satisfaction.
In the e-cigarette industry, the challenge was balancing regulatory compliance with user experience. We optimized onboarding to meet strict age verification requirements while minimizing friction. Additionally, engaging content—such as community features and product tutorials—helped drive user retention.
Across industries, I’ve seen common mistakes businesses make, such as:
- Overloading apps with features without validating user demand.
- Ignoring proper event tracking, which leads to decisions based on assumptions rather than data.
To avoid these pitfalls, I always recommend:
- Aligning app strategy with business KPIs.
- Building a solid analytics foundation with tools like GA4 or Firebase.
- Running continuous A/B tests to validate assumptions and uncover what truly drives impact.
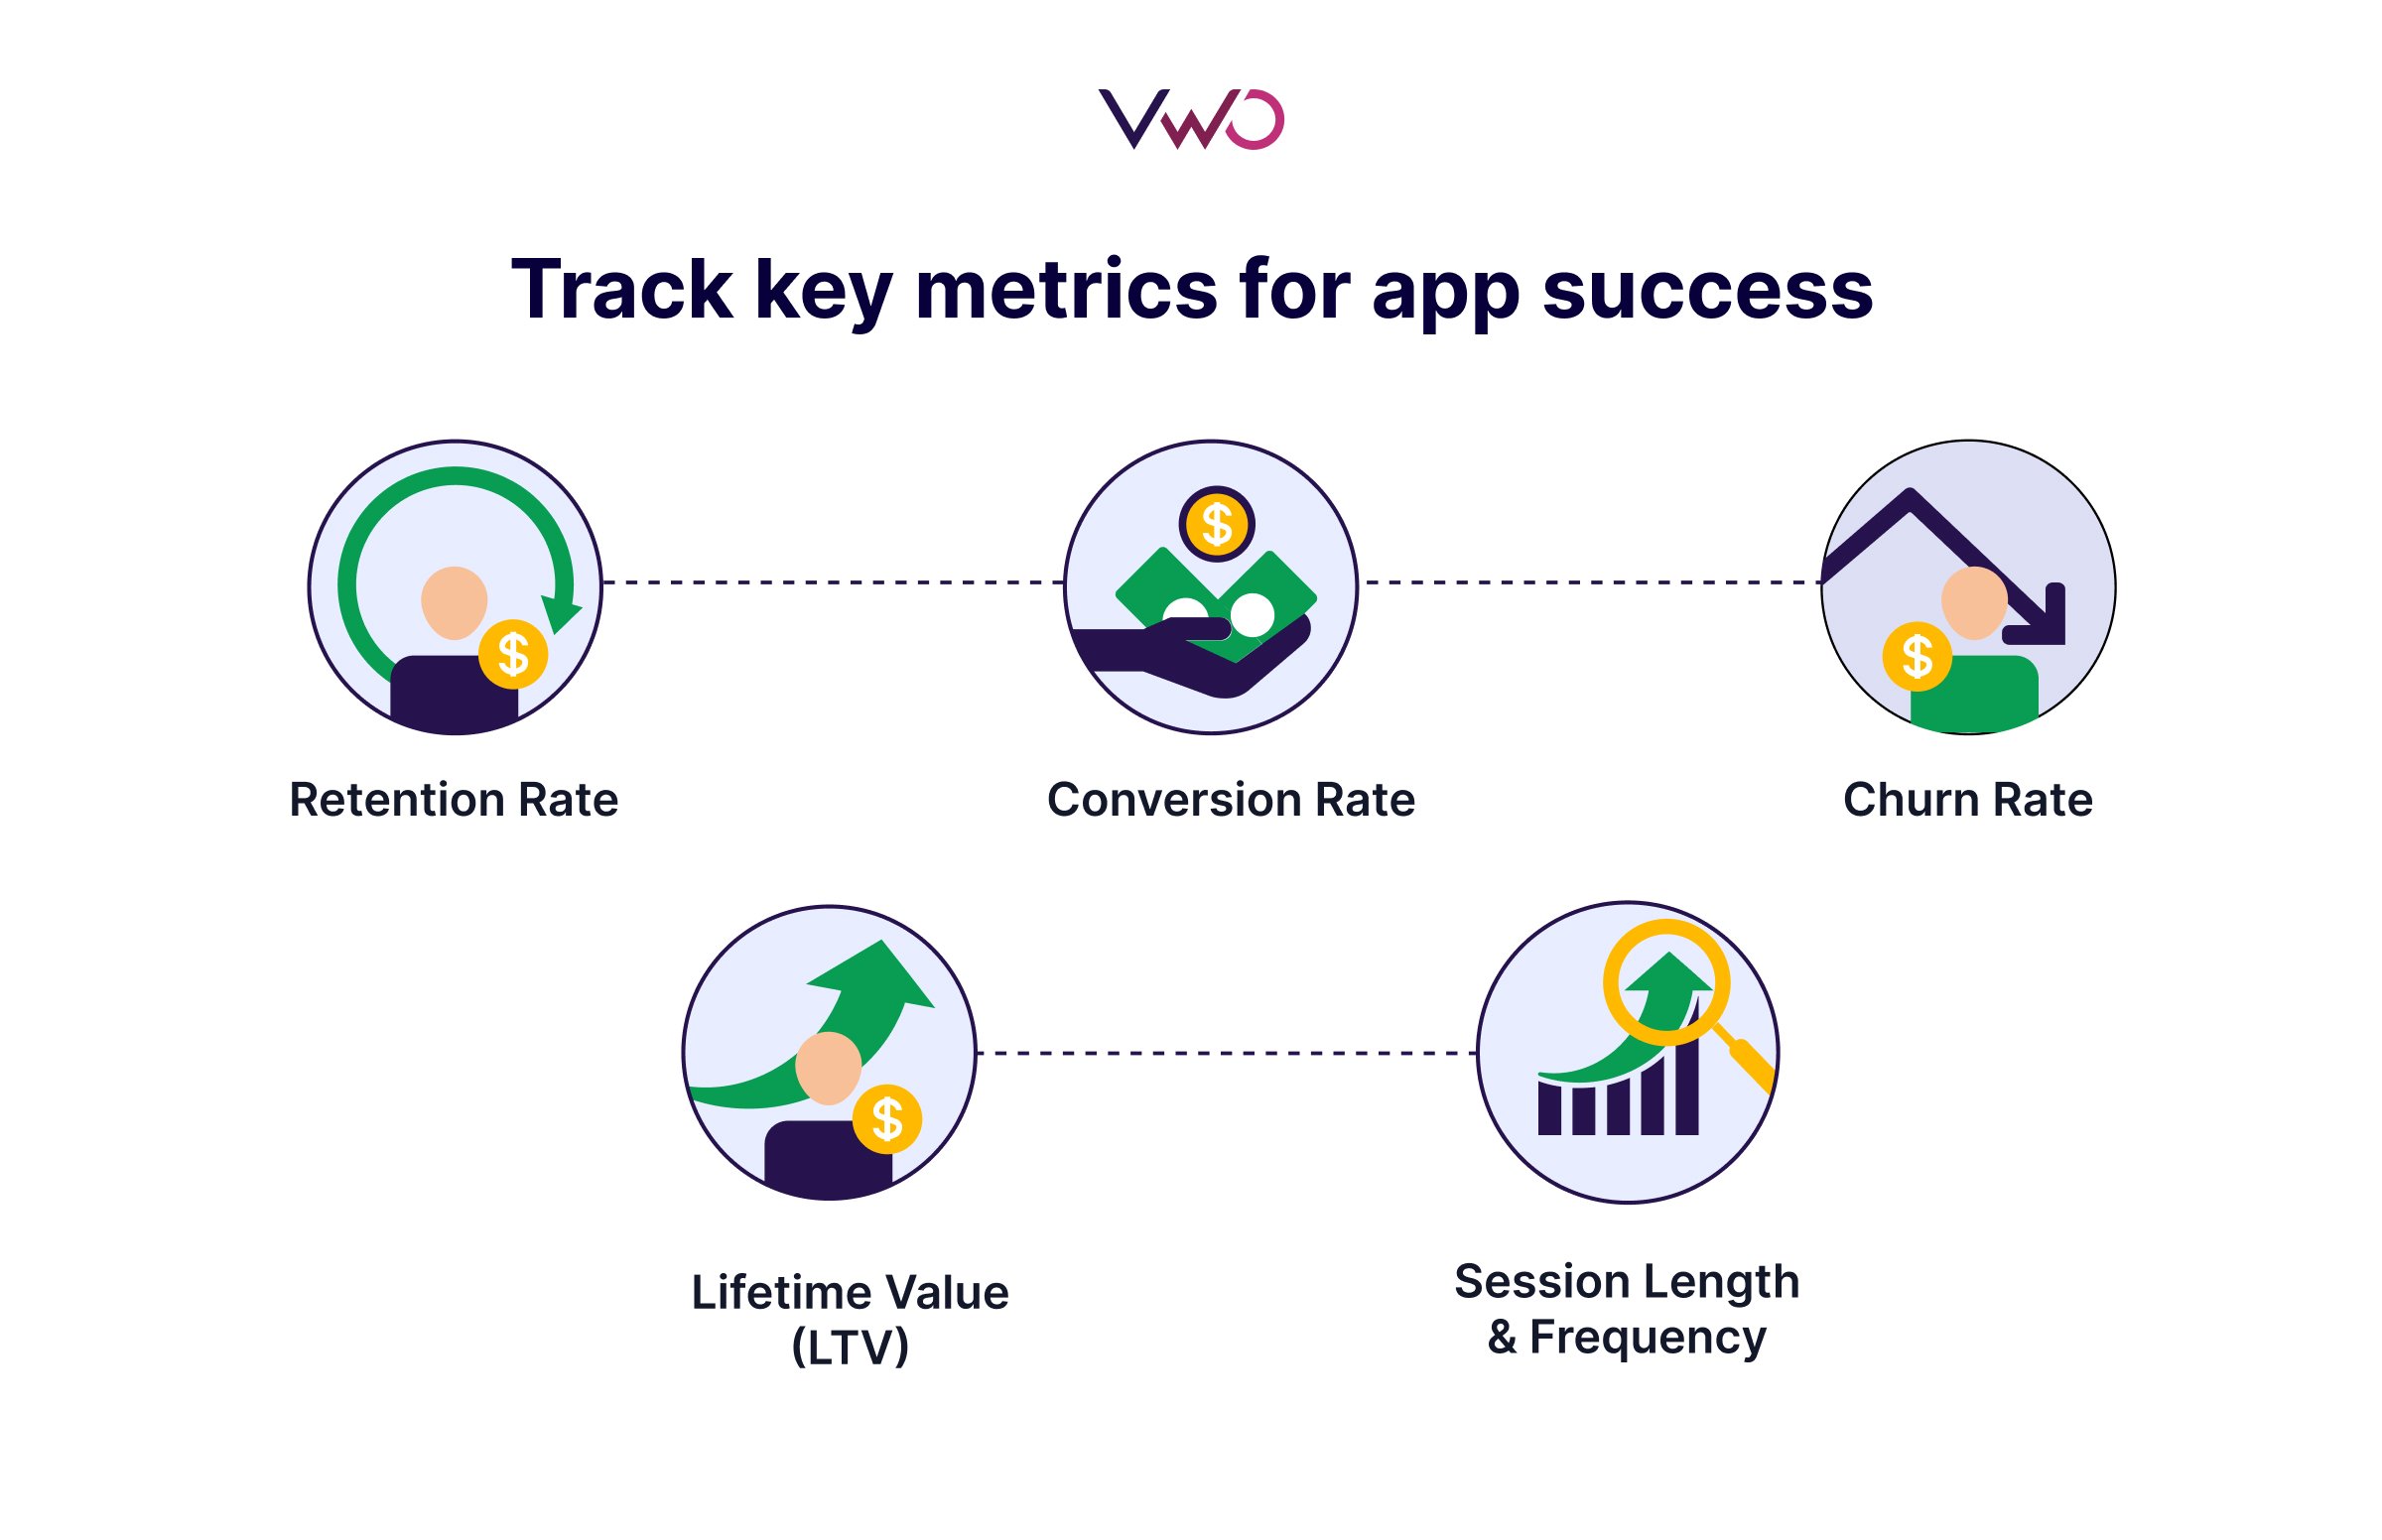
Key app performance metrics vary depending on the business model, but some essential ones include:
- Retention rate – Measures how many users return after installing the app, indicating long-term value.
- Conversion rate – Tracks specific actions such as purchases, sign-ups, or subscriptions.
- Session length & frequency – Helps businesses understand user engagement levels.
- Lifetime value – Determines the long-term revenue potential per user.
- Churn rate – Identifies how many users abandon the app, guiding retention strategies.
Execute complex mobile app tests with VWO—leverage a variable-based no-code approach for quick iterations or implement a code-based approach for granular control. Track any metric from conversions to revenue and campaign performance, and define test audiences with advanced segmentation.
South Korea’s approach to data privacy
South Korea has strict data protection laws similar to GDPR, meaning businesses must be diligent about consent management and data sharing. Many companies are shifting to server-side tracking and prioritizing first-party data strategies. Consent Management Platforms (CMPs) are also becoming essential to ensure compliance with both local and global regulations.
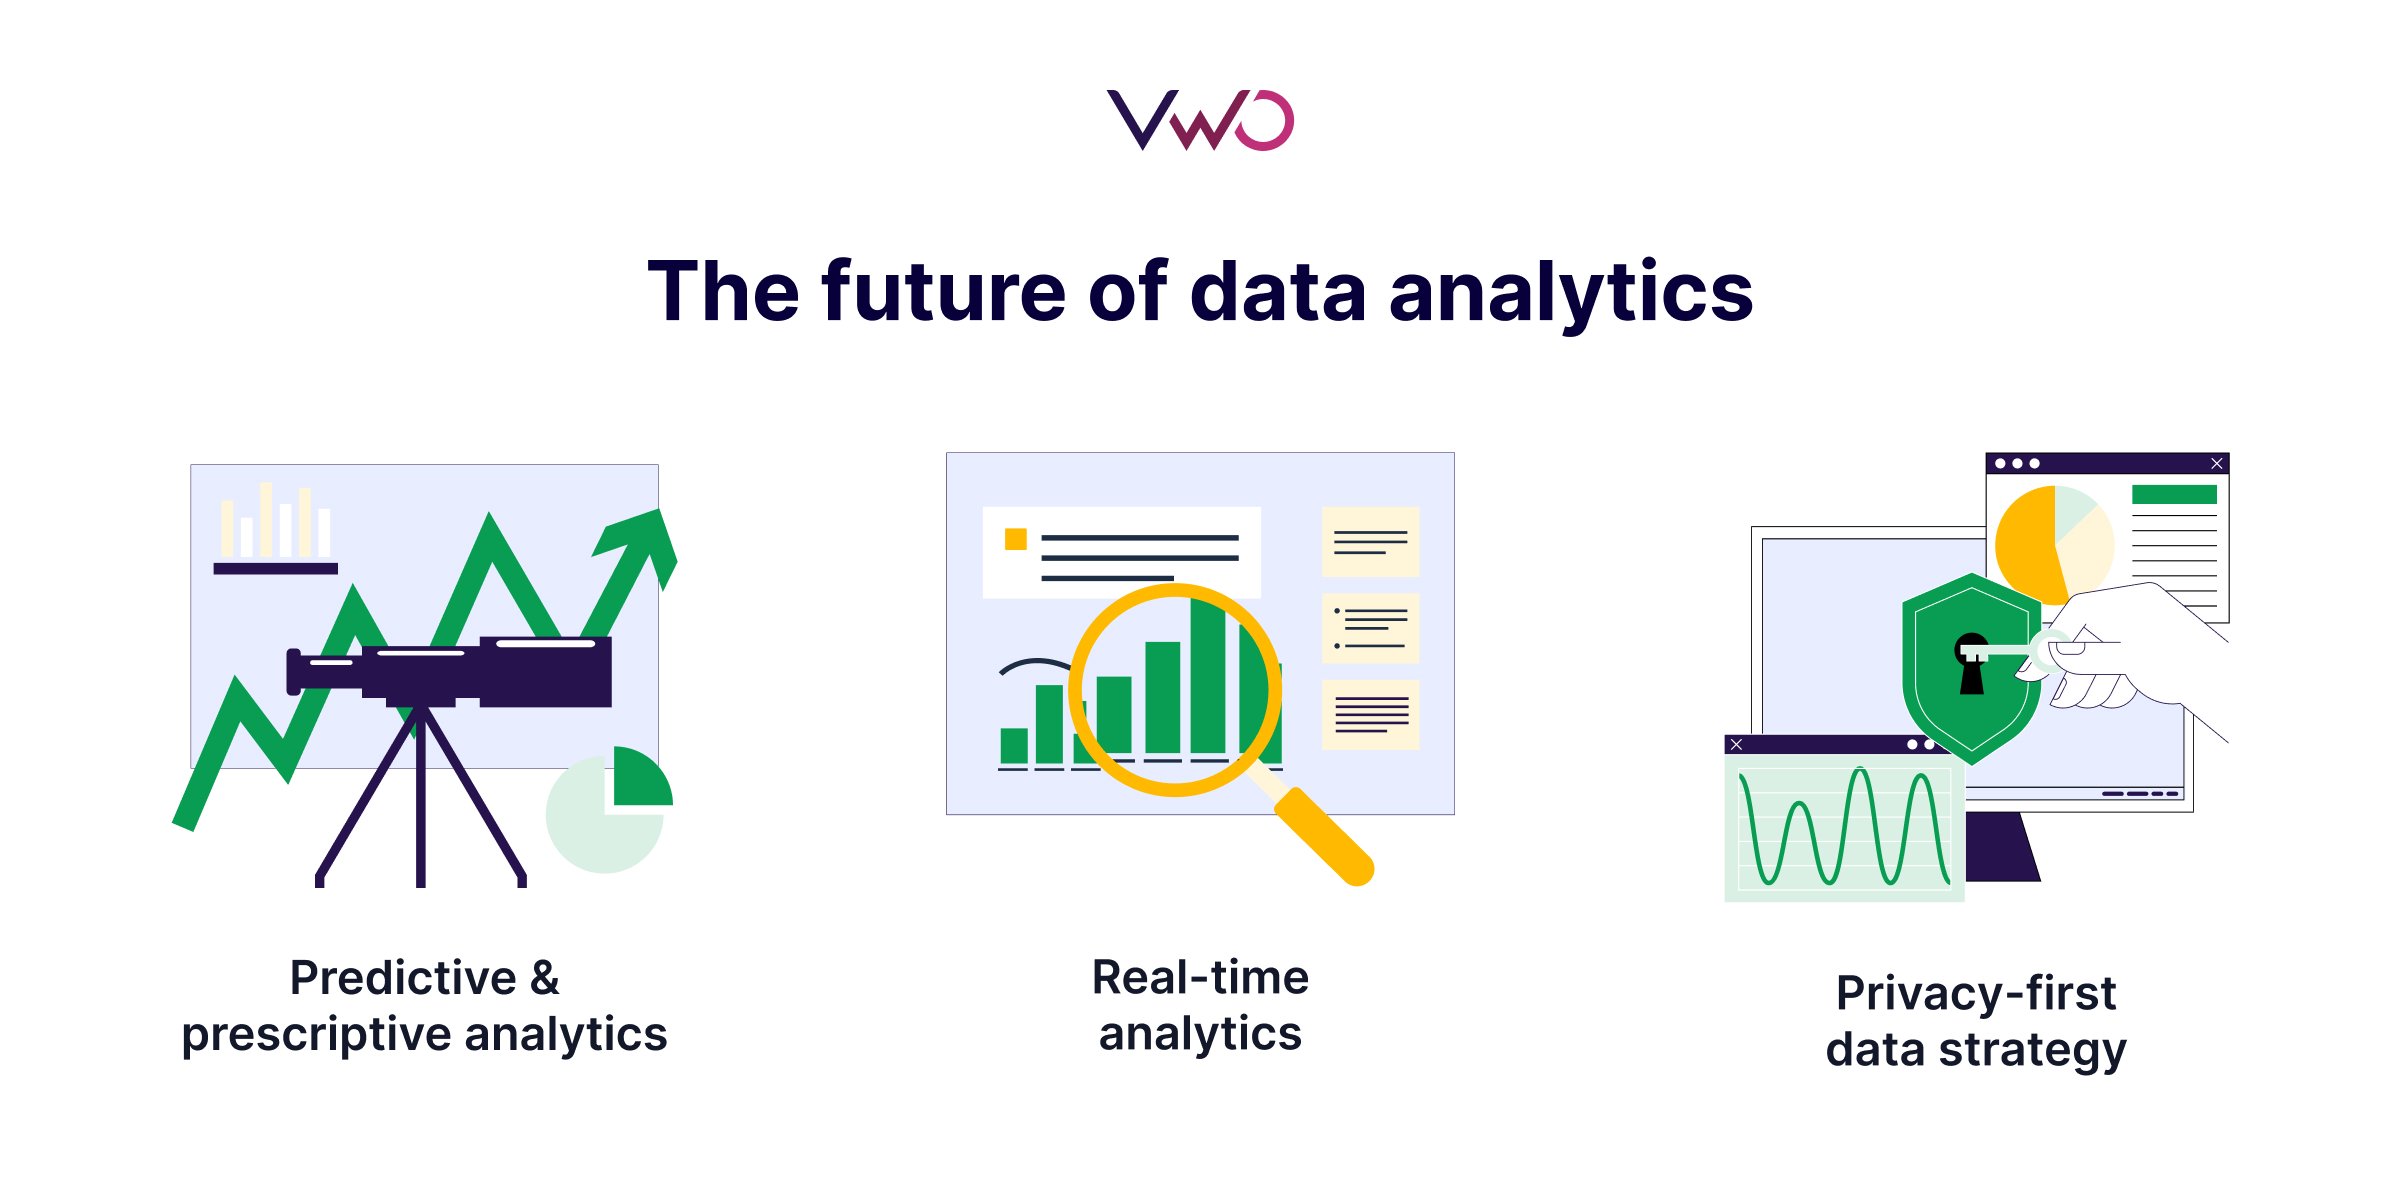
How data analytics has evolved and where AI is taking it
Over the past decade, data analytics has evolved significantly in several key ways:
From descriptive to predictive & prescriptive analytics
- In the early days, analytics was primarily about reporting past events (descriptive analytics).
- Now, businesses are leveraging predictive models and machine learning to forecast trends and automate decision-making.
The shift toward real-time analytics
- Previously, data analysis relied on batch processing, meaning insights were based on historical data.
- Today, real-time streaming analytics enables companies to react instantly to user behavior—adjusting pricing dynamically or personalizing content on the fly.
Privacy-first data strategies
- With increasing regulations like GDPR, CCPA, and South Korea’s PIPL, companies are moving away from third-party tracking toward first-party data collection and server-side solutions.
- Analytics tools must now balance data accuracy with privacy compliance more carefully than ever before.
AI is set to transform analytics in multiple ways:
- Automated insights & anomaly detection – AI will detect patterns and anomalies faster than humans, enabling proactive decision-making.
- AI-powered attribution models – AI will enhance marketing attribution accuracy, moving beyond traditional last-click models.
- Natural Language Processing (NLP) for data analysis – Businesses will be able to query data using plain English rather than complex SQL queries.
- Generative AI for experimentation – AI will assist in hypothesis generation and A/B test ideation, streamlining the testing process.
Human expertise will remain essential—AI can surface insights, but interpreting them within a business context will always require human judgment.
CRO trends in South Korea
South Korea has strong digital adoption, but CRO and data-driven decision-making still lag behind more mature markets like the US and Europe. Many businesses prioritize media buying and ROAS over long-term experimentation and optimization. A/B testing and CRO remain underutilized, with companies relying on gut instinct or past success strategies rather than structured testing.
However, there is a growing awareness of data-driven strategies. In recent years, larger enterprises and e-commerce platforms have started investing in dedicated CRO teams and analytics infrastructure, signaling a shift toward experimentation and personalization. At the same time, South Korea’s PIPL is becoming stricter, forcing businesses to rethink their data collection strategies. As a result, server-side tracking and first-party data collection are becoming more common.
Compared to global trends, structured A/B testing has long been a standard in the US and Europe, continuously improving digital experiences. In South Korea, A/B testing is still mostly limited to large corporations, but mid-sized businesses are beginning to adopt it as competition increases. The good news is that CRO is gaining traction, and businesses are shifting from an ad-driven to a data-driven approach.
Your VWO experience: What stood out?
I started using VWO while looking for a more user-friendly and flexible A/B testing platform compared to other CRO tools.
Visual editor for quick tests
VWO’s visual editor allows marketers and non-technical teams to modify elements directly without developer support. This was especially useful for testing CTA button placements and form layouts without engineering delays.
Advanced targeting & personalization
VWO offers detailed segmentation options, enabling businesses to serve personalized experiences based on user behavior, traffic source, or geolocation. For example, we used geolocation-based testing to customize homepage banners for different regions, leading to a 7% uplift in engagement.
Heatmaps & session recordings integration
Unlike some A/B testing platforms that only provide quantitative results, VWO integrates heatmaps and session recordings. This helps identify user friction points, leading to more informed experiment hypotheses.
Accurate insights
VWO’s anomaly detection helps identify unexpected patterns in test data, reducing human bias in analysis.
Initially, we ran simple A/B tests on landing pages—experimenting with headlines, button placements, and form fields. As we saw positive results, we expanded to more complex multivariate tests and behavioral segmentation experiments. Now, VWO is an integral part of our CRO workflow, especially for clients looking to optimize user experiences without major development work.
Wrapping up
From how to leverage GA4 to real-world examples, how data is evolving, and the current experimentation mindset in South Korea—we hope you gained valuable insights from this interview. If you’re impressed and want to experience the benefits Jihee had with VWO firsthand, take a demo and see how you can best use it to achieve your business goals.
Categories: