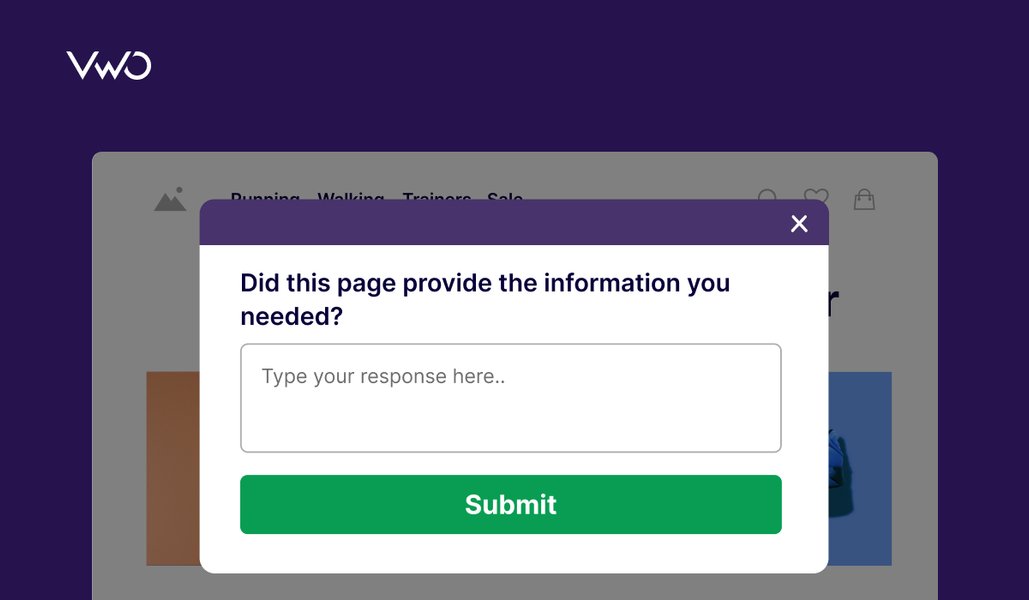
Ask Your Visitor’s Hesitation With On-Page Surveys
On-page surveys help you discover a goldmine of insights on why your visitors are behaving a certain way. Simply ask the right questions and get them answered by your visitors.
How likely are you to recommend this service/product to others?
This simple online survey question can reveal more about your business health than a dozen analytics dashboards combined.
The Net Promoter Score (NPS) is a key metric that distills customer loyalty, user satisfaction, and brand advocacy into a single, powerful score.
What is Net Promoter Score (NPS)?
Net Promoter Score (NPS) is a key loyalty metric that brands use to measure customer satisfaction.
The whole NPS system is based on a critical question: “On a scale of 0 to 10, how likely are you to recommend our service or offerings to people you know?”
The NPS scores that your existing customers give are categorized into three groups:
Promoters: Customers who choose a rating of 9 or 10. They are loyal, enthusiastic customers who will most likely refer others as well.
Passives: Customers who choose a rating of 7 or 8. They are satisfied but mostly unenthusiastic customers, which means they would be vulnerable to competitive offers.
Detractors: Customers who choose a rating between 0 and 6. They are unhappy customers who might also discourage others from choosing your product or service.
Once you have all the responses, the last step is to simply subtract the percentage of detractors from the percentage of promoters.
The final net promoter score lies in the range of ‘–100’ to ‘+100’, with a higher score indicating strong customer loyalty.
Why is Net Promoter Score important?
NPS is more than just a number. It is a direct reflection of how customers feel about your brand. It helps answer some tough questions like:
1. How loyal are your customers?
Higher NPS indicates faster company growth, because loyal customers usually spend more, and are more likely to recommend your product to others.
2. Which areas need improvement?
Low NPS scores or negative feedback reveal pain points in customer journeys.
3. What should the team focus on?
NPS also helps the team focus on optimizing the user experience rather than just chasing metrics.
4. How are you placed against your competitors?
NPS enables you to compare customer loyalty against competitors or industry standards.
5. How to turn happy customers into your best marketers?
When you turn promoters into brand ambassadors, you amplify word-of-mouth marketing, which is often the most trusted form of promotion.
How to calculate Net Promoter Score?
Let’s understand how to calculate Net Promoter Score step-by-step:
1. Collect responses
The first step is to collect responses for the key NPS question.
2. Categorize customers
Next, divide responses into categories of promoters, passives, and detractors.
3. Calculate percentages
Now calculate the following percentages:
% of promoters = (No. of promoters/ total no. of responses) × 100
% of detractors = (No. of detractors/ total no. of responses) × 100
4. Apply the Net Promoter Score formula
Use this formula for NPS calculation: Total % of promoters – Total % of detractors
The final NPS results fall between ‘–100’ and ‘+100’.
Let’s understand this with a simple example.
Suppose you survey 100 customers and they give you the following ratings:
60 customers give you a rating of 9 or 10. These are promoters.
20 customers give you a rating of 7 or 8. These are passives.
20 customers give you a rating somewhere in between 0 and 6. These are detractors.
Based on the formula above, we calculate:
% of promoters = (60 ÷ 100) × 100 = 60%
% of detractors = (20 ÷ 100) × 100 = 20%
So, NPS = 60 – 20 = +40
The positive score indicates your brand has more loyal promoters than unhappy detractors, indicating a healthy NPS and high customer loyalty.
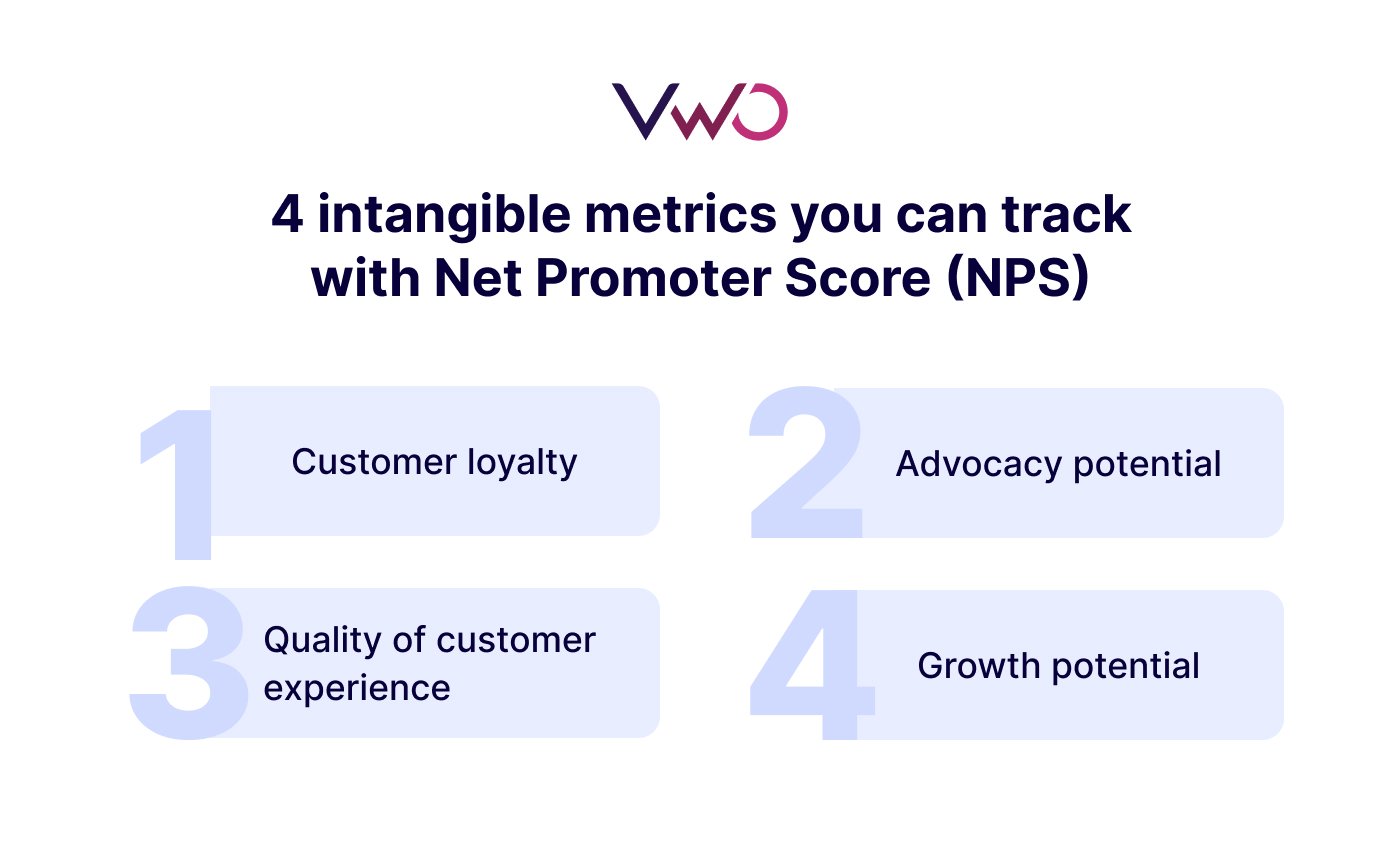
What does the Net Promoter Score measure?
At its core, NPS reflects the balance between your happiest customers, those who are neutral or passive, and those who are dissatisfied or unlikely to return.
NPS measures metrics that go beyond just customer satisfaction. These include:
Customer loyalty
Advocacy potential
Customer experience quality
Business growth potential
NPS score reveals whether your efforts to improve customer experience are truly paying off.
A rise in your NPS score signals strong customer relationships, while a decline in score highlights critical UX areas that need attention.
How to interpret the Net Promoter Score?
Once the NPS calculation is done, the next step is to understand what that number actually means.
1. See what’s driving your NPS
While the overall NPS gives you a quick snapshot of the customer experience, it is important to analyze what’s driving it.
Here’s how you can do it:
Segment responses by customer type, product line, or journey stage to identify loyalty patterns.
Analyze qualitative feedback from follow-up questions to uncover recurring themes.
Correlate NPS with engagement or conversion metrics to know what influences customer satisfaction most.
2. Understand the range and what it means
After calculating NPS, it is important to understand the range. Your NPS ranges from –100 to +100.
A negative score indicates you have more detractors than promoters, which clearly shows dissatisfaction and potential churn.
A positive score indicates promoters outnumber detractors, which means customers are generally happy and loyal.
3. Track changes over time
NPS is a powerful metric when tracked consistently. A good practice is to monitor trends by region, product, or touchpoint to evaluate your existing or future efforts.
What’s a good Net Promoter Score? And how bad is too bad?
A good Net Promoter Score depends heavily on your:
Even a small positive number means you have more promoters than detractors.
That’s a great starting point, but here’s how most businesses interpret the score:
0 or below: Customers are more dissatisfied than satisfied. Brand loyalty and retention are at risk.
0 to 30: Decent but leaves room for improvement. Customers are mostly satisfied, but there’s not enough advocacy yet.
30 to 70: This is a good NPS and indicates that customers are loyal and likely to recommend you.
70 and above: This means your CX is world-class and your brand has a passionate base of advocates.
What’s considered a bad NPS score?
A negative or low NPS does not in any way indicate that you are failing as a brand. It simply suggests that customers are struggling or facing certain roadblocks in their journey, which might have gone unnoticed.
–100 to 0: Customers are either unhappy or frustrated. Analyze these responses to identify areas that might need urgent attention.
0 to 10: You’re breaking even on loyalty. Identify and eliminate pain points to convert passives into promoters.
10 to 30: This is a good score that can be improved further.
The average NPS score varies for different industries. An NPS of +30 might be excellent in the telecom space, where customer expectations are high.
But the same score might be considered average in hospitality, where customer experiences are more personal.
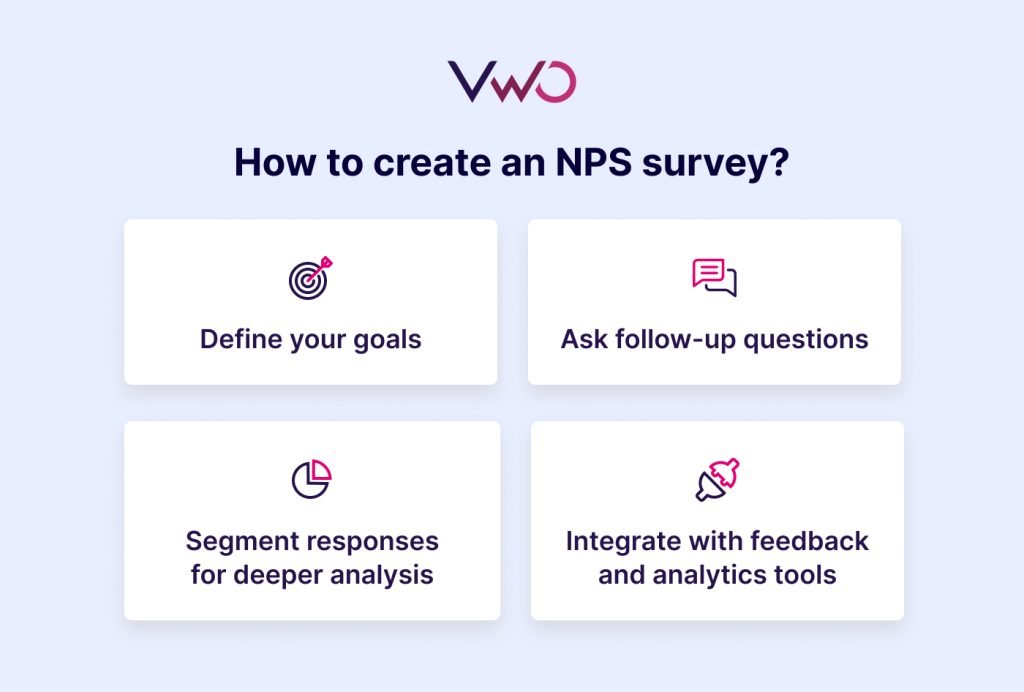
Let’s understand how to craft effective NPS surveys that encourage customers to freely share their experiences and struggles, if any, so you can take relevant action and drive targeted improvements.
1. Define your purpose: relational vs. transactional
Before you build your NPS survey, decide why you’re asking for customer feedback:
Relational NPS: Survey customers periodically (maybe quarterly, biannually, or annually) to gauge overall perception of your brand.
Transactional NPS: A survey taken after a specific experience, for example, a purchase, support interaction, or onboarding.
2. Include one or two strategic follow-up questions
To turn the number into actionable insight, follow up with open-ended questions:
What is the number one reason for the score you’ve given?
What specific steps could we take to improve your experience?
What would encourage you to give us a higher score?
When running surveys, don’t just ask people what they want. Ask about the behaviors they’ve engaged in or plan to engage in. When you keep the focus on behavior, you uncover insights that reflect what actually matters to your users.
These questions help you understand the context behind the scores.
Also, to keep the response rate high, try not to overload the NPS survey with too many additional queries.
3. Segment and tag responses for deeper analysis
Don’t just collect a single NPS score; segment the data by:
Product line, region, or channel
Customer age, tenure, or behavior
Touchpoint or experience type (such as support, purchase, delivery)
Segmentation helps you uncover trends and isolate problems.
4. Integrate with feedback tools and analytics
To make your NPS data more powerful:
Use a customer experience or feedback platform like VWO. Rather than just running NPS surveys, VWO enables you to watch session recordings and understand the context behind each survey response.
Leverage text analytics/sentiment analysis on open-ended responses to surface common themes or issues automatically.
Link NPS data with operational metrics like churn, support tickets, and usage to see how customer feedback correlates with business outcomes.
What actions to take based on your NPS score
Once you’ve measured customer sentiment, your next step is to translate those insights into actions that improve experience, loyalty, and advocacy.
The key is to listen to each category differently and respond in a way that deepens your relationship with them.
1. Turn promoters into brand advocates
Don’t take promoters for granted.
Promoters have a 50% higher chance of making repeat purchases and referring 3 to 5 new customers annually. Your goal should be to nurture their advocacy and use it to amplify organic reach.
Encourage referrals and testimonials by inviting them to join referral programs or share their stories as case studies or reviews.
Communicate with them consistently to sustain emotional connection and drive long-term loyalty.
Detractors highlight gaps in your CX. Their feedback may sting, but it’s the most valuable insight you’ll ever get.
Reach out to detractors within 24 to 48 hours to acknowledge their feedback and show that their voice matters.
Continuous detractors mean you must train support and success teams to resolve issues proactively, not defensively. Even one resolved complaint can turn a critic into a promoter.
Why it matters: According to a study, 83% of customers feel more loyal towards brands that not only respond to their complaints but also manage to resolve them.
3. Re-engage passives before they drift away
Passives are satisfied but not emotionally invested. If offered a better value or customer experience, they might easily switch to your competitors.
Identify what’s missing and what would move them from “satisfied” to “delighted.”
An effective way is to monitor engagement signals, such as low usage frequency, fewer logins, or decreased purchases, which can indicate a churn risk.
Why it matters: Passives often comprise the largest portion of your customer base, and converting even a small fraction into promoters can significantly lift your overall NPS.
Pro Tip!
Use VWO’s multilingual surveys, which are aligned to your brand values and multilingual. This ensures every user feels heard and valued, irrespective of where they’re located. The surveys can be easily customized based on the design, language, and tone to match your brand voice.
Transform NPS data into business impact with VWO
Don’t stop at running NPS surveys and collecting responses.
Use it to uncover insights that help your brand improve conversions, engagement, and customer satisfaction. Check out how VWO helps you through the process:
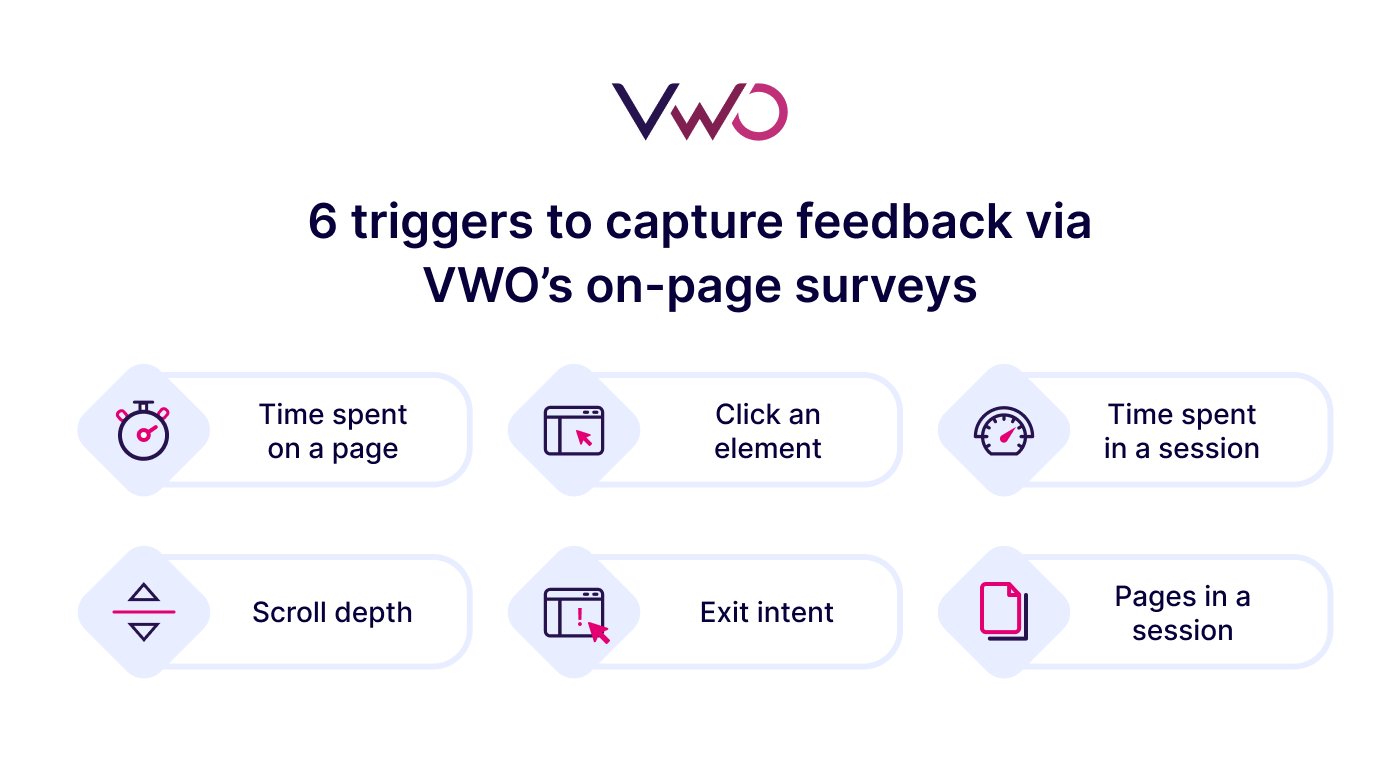
1. Trigger on-page surveys at relevant interactions
With VWO Surveys, you can display your NPS question directly within your website or app when a visitor performs a key action. For instance, a survey can be triggered when a visitor:
Clicks an element
Scrolls to a specific distance
Tries to leave a page
2. Let AI do the heavy lifting of survey analysis
Use VWO Copilot to quickly generate survey questions based on your specific campaign goals.
AI-generated questions based on goals – helping you build surveys.
AI-summarized survey reports – fast tracking survey response analysis.
The Copilot will share actionable insights and give quick recommendations based on the survey results, reducing the time and effort spent building a survey.
This enables you to gather deeper insights into user behavior and understand more about their struggles and preferences.
3. Deepen insights with CX-focused surveys
To uncover the “why” behind your NPS scores, pair your survey with broader customer experience surveys.
Try to ask open-ended questions such as:
What made you give this rating?
Was anything missing from your experience today?
With VWO Surveys, you can pick from multiple formats, from multi-line text boxes to dropdowns and checkboxes, helping you build the right survey for your goals and context.
4. Bridge feedback with behavior analytics
After collecting NPS or survey responses, validate them with behavior analytics to ensure what users say matches what they do.
Use VWO’s integrated session recordings and heatmaps to observe user actions before and after survey interactions.
This helps you spot friction points, verify if perceived issues actually affect navigation or conversions, and discover patterns hidden behind user feedback.
As a result, you get a complete picture of user intent and experience, ensuring no gap in understanding.
5. Correlate NPS with key conversion metrics
Don’t just track your NPS in isolation. Connect it with conversion metrics to see how customer loyalty drives real business outcomes.
For instance, when you monitor the activity of customers who gave you a high NPS rating to see whether they have a higher add-to-cart rate as compared to other customers.
This will help you identify the total contribution of satisfied customers to the overall revenue and business growth. Some important conversion metrics to track and measure are:
Purchase completions
Repeat purchases
Renewals
Thanks to the metrics engine in VWO Data360, you can define and track both pre-built and custom metrics across campaigns.
It captures key actions like clicks, sign-ups, purchases, or revenue events, giving you flexibility in how conversions are measured.
By connecting these metrics with NPS data, you gain a unified view of how customer sentiment influences engagement, retention, and long-term value.
Final thoughts
A positive NPS is a strong signal for customer loyalty and advocacy, while a low score uncovers areas needing attention.
And with VWO, businesses can go beyond just measurement.
It connects NPS with user behavior insights so you can better understand how customers engage and what drives conversions.
To start measuring NPS, just run a simple survey with the core question: “How likely are you to recommend us to people you know?” Based on the responses, the net promoter score calculation can be done by subtracting the percentage of detractors in the survey from the percentage of promoters. The final NPS results will fall in the range: –100 to +100.
Q2. What is a high Net Promoter Score?
A high NPS score is typically above +50, indicating increased customer loyalty and satisfaction. Scores on the NPS scale between +30 and +70 are generally considered excellent for most industries. Brands with scores above +70 are seen as customer experience leaders with strong advocacy.
Q3. Is Net Promoter Score a percentage?
No, the NPS itself is not a percentage. Rather, it is calculated using percentages of promoters and detractors, and the final score is a whole number between –100 and +100. For instance, if 70% of survey respondents are promoters and 20% are detractors, your NPS value is +50, not 50%.
Q4. What is a poor NPS score?
A poor NPS typically falls below 0, meaning you have more detractors than promoters. NPS scores between ‘0’ and ‘+10’ suggest your customers are neutral but not loyal, while anything below ‘–10’ usually indicates significant dissatisfaction, risk of churn, and high friction in customer journeys.
Hi, there! I’m an Associate Manager of Content at VWO with 6 years of experience in B2B and B2C marketing. I work across blogs, SEO, thought leadership, newsletters, landing pages, and a video podcast I built and manage from scratch. At VWO, I’ve gained expertise in CRO, experimentation, user behavior research, and personalization, creating content that makes complex ideas clear and actionable. Outside of work, I enjoy experimenting with memes and short-form video on Instagram.
Uncover hidden visitor insights to improve their website journey
One of our representatives will get in touch with you shortly.
Awesome! Your meeting is confirmed for at
Thank you, for sharing your details.
, you're all set to experience the VWO demo.
I can't wait to meet you on at
Account Executive
, thank you for sharing the details. Your dedicated VWO representative, will be in touch shortly to set up a time for this demo.
We're satisfied and glad we picked VWO. We're getting the ROI from our experiments.
Christoffer Kjellberg
CRO Manager
VWO has been so helpful in our optimization efforts. Testing opportunities are endless and it has allowed us to easily identify, set up, and run multiple tests at a time.
Elizabeth Levitan
Digital Optimization Specialist
As the project manager for our experimentation process, I love how the functionality of VWO allows us to get up and going quickly but also gives us the flexibility to be more complex with our testing.
Tara Rowe
Marketing Technology Manager
You don't need a website development background to make VWO work for you. The VWO support team is amazing
Elizabeth Romanski
Consumer Marketing & Analytics Manager