How A/B Testing Tools Work: From Test Setup to Final Report
A/B testing tools help compare two or more variations of a page or element on websites and mobile apps to determine which performs better against a specific goal.
These tools help businesses make data-driven decisions by testing changes before rolling them out widely. The result is a more optimized user experience and improved performance across key metrics.

How A/B testing tools work: Step-by-step breakdown
A/B testing tools split your audience into different groups—each exposed to a different variation—and measure how each version impacts a defined goal, such as click-through rate, sign-ups, or purchases.
Here’s a more detailed breakdown.
1. Define your goal and hypothesis
Start by identifying what you want to improve, whether it is click-through rate, form sign-ups, demo requests, or checkout experience.
Formulate a hypothesis around that goal. For example: “Moving the free trial CTA to the first fold would increase sign-ups by 12%.”
Clear goal-setting ensures your experiment is focused and measurable.
2. Create variations (A and B)
The next step is to create an alternate version of the element or page to test:
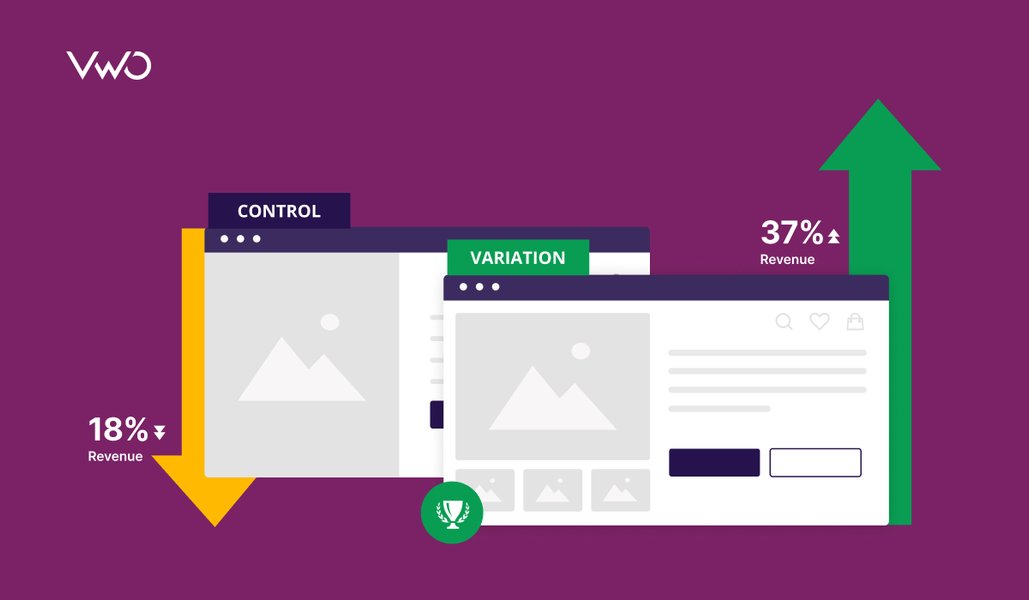
A (Control): The original version
B (Variation): The new version with the targeted changes or modifications
A lot of A/B testing tools also support testing multiple variations simultaneously, known as multivariate testing (MVT).
3. Allocate traffic to each variation
You can either let the tool assign visitors to different versions randomly, or you can adjust it depending on your goals.
It is best to have a controlled testing environment, especially when testing a new design or a feature.
So, rather than showing the new version to all visitors, you can start by showing it to only 10% or 20% of visitors. Once you’re confident of the variation’s performance, you can gradually allocate more traffic to it.
4. Track user interactions and metrics
As users engage with each version, your A/B testing tool tracks key actions based on your goals:
- Clicks on buttons or banners
- Page views or scroll depth
- Conversions or purchases
This data helps you evaluate and track the performance of each variation.
5. Analyze the test results
Once enough data is collected, the tool compares both versions and calculates key metrics like:
- Conversion rate
- Percentage uplift
- Statistical significance (i.e., whether the result is likely due to the change rather than chance)
This helps you determine if your hypothesis was right or whether you need to work on it a little more.
6. Choose the winning version
If one variation outperforms the other with statistical confidence, it’s declared the winner.
Some tools allow you to pick the winner manually, while others automatically declare one based on pre-set thresholds.
7. Implement and iterate
Deploy the winning version to all users, but don’t stop there.
Use insights from the test to:
- Refine future hypotheses
- Plan follow-up experiments
- Continuously optimize the user experience
A/B testing is most effective when it’s part of an ongoing experimentation and improvement cycle.
Use VWO Copilot’s segment discovery to automatically identify specific visitor groups that were highly engaged with your experiment—across both control and variation. You can monetize these key segments by launching targeted, personalized campaigns that drive conversions and improve KPIs like engagement, revenue, and retention.
Examples of A/B testing in action
A/B testing is used across various digital channels to optimize user experiences and improve performance. Let’s look at some real-world examples of how A/B testing can be implemented across different platforms.
Websites
Common tests on websites include:
Headlines: Test different versions of your headline copy to see which one resonates better with your visitors.
Checkout page: Run experiments on your checkout page to see how you can prevent drop-offs from the final stage of purchase, and make the experience more seamless.
Page structure and layout: Rearrange different sections or page elements to see how they impact engagement, bounce rates, time spent on the page, etc.
Mobile apps
A/B tests are also helpful for fine-tuning user experiences, improving feature adoption, and driving retention on mobile apps.
Onboarding flow: Try different welcome screen sequences or tweak your in-app messaging to improve activation rates and get users to take the desired actions.
UI elements: Experiment with icons, menu styles, or engagement patterns to increase usability and session time.
Feature adoption: Test how different prompts, tooltips, or walkthroughs influence the usage of important app features.
Emails
Testing is widely used to improve the performance of email campaigns and newsletters.
Subject lines: Test different versions of your subject lines to see how they impact open rates.
CTA copy: Try different phrases like “Get Started” vs “Become A Subscriber” to see which version drives more clicks and engagement.
Delivery schedule: Optimize when emails are delivered to improve engagement and target a wider audience.
Ads
A/B testing is commonly used in advertising across all platforms.
Creatives: Test variations in visuals, headlines, or ad formats.
Targeting: Compare performance across different audience segments.
Placement: Test how ads perform across various networks or positions, like main feed or sidebar.
Benefits of using an A/B testing tool
Rather than relying on assumptions, A/B testing tools offer a structured way to test ideas, measure outcomes, and refine experiences. Here are some other key benefits:
1. Make decisions backed by real data
A/B testing tools enable you to compare variations and understand how users actually respond, reducing reliance on opinions and helping you make changes based on measurable impact.
2. Reduce risk before rolling out changes
Rather than launching updates to all users at once, teams can test ideas on a smaller audience segment. This helps identify potential issues early and prevents large-scale negative effects on the user experience.
3. Understand what truly influences performance
From headlines and layouts to forms and navigation, testing tools help isolate which elements drive engagement or create friction. Over time, this builds a clearer picture of what works for your audience.
4. Improve efficiency of optimization efforts
A/B testing tools offer detailed reports and insights on campaign performances, helping you clearly understand the impact of your decisions while also enabling you to iterate confidently.
For instance, VWO’s AI-powered capabilities enable you to create an entire experiment in just one click.
Just prompt the VWO Copilot with details of your test, and it quickly sets up the test, helping you focus more on strategy and less on technical execution.
5. Build a culture of continuous learning
With continuous experimentation, teams develop a habit of testing ideas, learning from outcomes, and iterating regularly. This approach supports long-term growth by turning optimization into an ongoing process rather than a one-time project.
Final thoughts on how A/B testing tools work
A/B testing tools play a key role in helping teams move from guesswork to data-driven decisions.
By experimenting with different versions of content, design, or features, you can understand what truly drives engagement, conversions, and retention.
It’s important to evaluate different features of A/B testing tools like reporting flexibility, integrations, data handling, and compliance.
Tools like VWO go beyond A/B testing by offering built-in capabilities like heatmaps, session recordings, surveys, and form analytics, which enable you to:
- Identify friction points in your funnels
- Understand what factors influence visitor behavior
- Collect and analyze direct visitor feedback
- Watch how visitors navigate your platform
With AI capabilities like VWO Copilot, teams can now generate test ideas, build variations, and create audience segments more efficiently.
This lets you focus more on strategic decision-making while still delivering optimized experiences at scale.
Request a demo with VWO to know how you can test and build optimized experiences at scale.
FAQs
Yes, A/B testing tools can impact website performance, but the effect largely depends on how the tool is implemented.
Most client-side testing tools can slightly delay page rendering, especially if the testing script isn’t loaded asynchronously. This often creates a “flicker effect” where the original version is briefly displayed before the variation loads.
However, tools like VWO are increasingly optimized to minimize this. To avoid performance issues, it’s important to:
– Use only essential experiments per page.
– Load scripts via tag managers or asynchronously.
– Audit website performance regularly with Google Lighthouse or other similar tools.
Absolutely. Most A/B testing tools offer built-in integrations with popular analytics platforms like Google Analytics, Adobe Analytics, Mixpanel, and others.
These integrations allow you to push experiment data, such as variant performance or audience segments, into your analytics dashboard for deeper, cross-platform insights.
For example, with tools like VWO or Optimizely, you can:
– Track how each variation impacts long-term KPIs (e.g., LTV or churn).
– Analyze test results alongside other behavioral or funnel data.
– Set up goals in your analytics platform that sync with experiment outcomes.
Integrating your testing and analytics ecosystems ensures a unified view of performance and helps validate test results across multiple data sources.
Categories: