7 Best Data Tracking Software for 2026: Compare Top Tools
Behind every user interaction is a trail of decisions: what caught their eye, where they dropped off, what convinced them to buy, or why they bounced.
However, without the right tools to track and interpret data across touchpoints, it’s easy to miss patterns, and valuable insights get lost in scattered systems.
That’s where specialized tracking tools come in. Whether you’re optimizing a product experience, improving campaign performance, or diagnosing site issues, these tools help you see what’s happening clearly and take action with confidence. They also give you a fuller view of what’s working and what’s not, so you’re not left guessing.
In this guide, we break down 7 of the best data tracking tools for 2026. Each is built to focus on a specific area, such as user behavior, product usage, marketing attribution, sales performance, web speed, and more. Explore the list to find the tool or combination of tools that best fit your goals.
7 Best data tracking software: At a glance
- Google Analytics: All-in-one data tracker (Customer journey & lifecycle data)
- VWO Insights: User behavior data
- Mixpanel: Product usage data
- Zoho Analytics: Sales & revenue data
- Hubspot Marketing Hub: Marketing & campaign data
- Leadinfo: Intent data
- GTMetrix: Web performance (Technical) data
Disclaimer: The pros and cons listed are based on reviews and feedback from third-party sites such as G2, TrustRadius, and other sources.
7 Best data tracking software: In-depth overview
1. Google Analytics: All-in-one data tracker (Customer journey & lifecycle data)

Google Analytics is a free, widely trusted tool that helps businesses monitor user interactions across websites and mobile apps. It captures detailed data on traffic sources, user demographics, behavior flows, and conversions, giving teams a complete view of how visitors navigate their digital ecosystem. With intuitive dashboards and customizable reports, it enables better decision-making across marketing, content, and product functions.
Features like cross-platform tracking connect data from web and app channels to reveal multi-touchpoint behavior, while custom event and goal tracking allow teams to measure key actions, such as purchases or sign-ups, so they can focus on what drives real results.
Features
User Exploration using Segmentation, Real-Time Reporting, Funnel Analysis, Built-in Automation, Integrations, Predictive Analytics, Engagement Reports, Campaign Performance, Conversion Paths Reports, Cohort Exploration, Tag Management
Pricing
- Google Analytics is available at no cost to all users.
Pros:
- Simple setup, just add a tracking code to your website, and it starts collecting data instantly.
- Advanced features like comparison filters, rich demographic and interest data, and flexible attribution models for deeper analysis.
Cons:
- The user interface can feel a bit overwhelming at first, but it becomes easier to navigate with regular use.
- Customizing reports and connectors may require some technical knowledge, especially for more advanced setups.
2. VWO Insights: User behavior data

VWO Insights, part of a comprehensive experience optimization platform, is a behavior analytics tool that helps businesses understand how users interact with their websites, identify conversion barriers, and improve the user experience through data-driven insights. It combines multiple features that let you dive deep into user behavioral analysis:
- Heatmaps track clicks, scrolls, and taps, highlighting which parts of a page users engage with most and which areas they ignore, including popups and dynamic content.
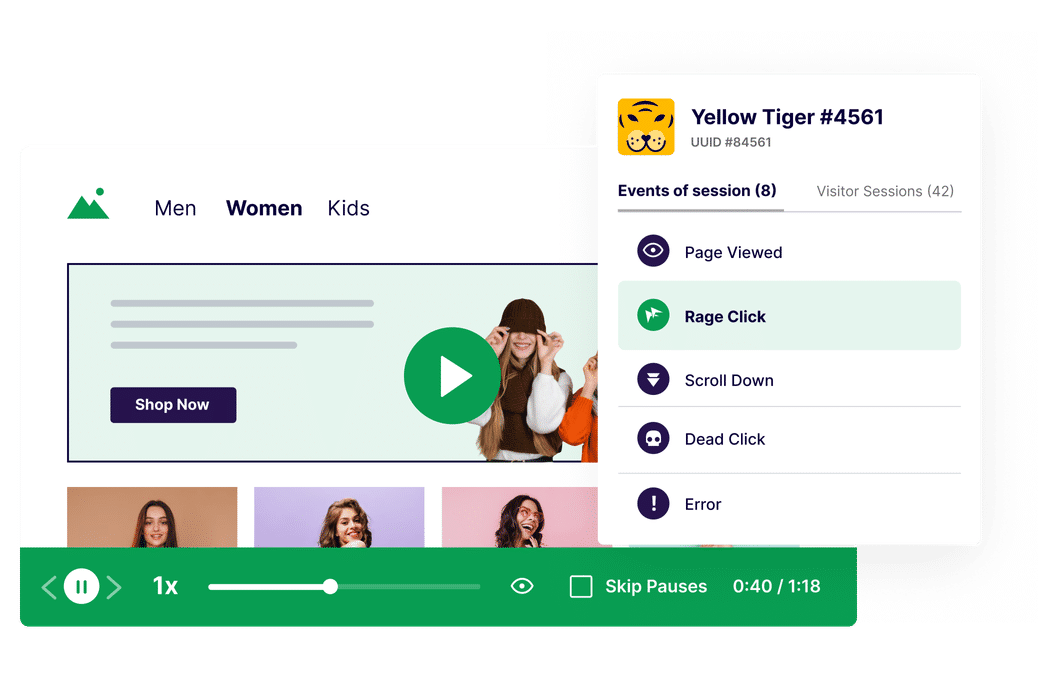
- Session recordings provide a replay of actual user sessions, revealing behaviors like hesitation, rage clicks, or abandonment, helping teams identify exactly where users struggle.
- On-page surveys offer contextual feedback by targeting specific user segments with AI-generated questions and summaries, giving you clarity on the ‘why’ behind user behavior.
- Form analytics uncovers friction in lead forms by showing which fields are skipped, refilled, or cause users to drop off, enabling better form design and higher completion rates.
- Funnels allow teams to map out multi-step journeys and pinpoint where users exit the flow, so optimization efforts are focused and effective.
- Segmentation enables detailed behavior analysis based on traits like device, browser, traffic source, or specific events, helping teams tailor insights to different user groups.
Kick off your analysis with the VWO Insights Dashboard to get a quick performance score (0 to 100) across various pages. It automatically surfaces UX issues from heatmaps, session recordings, and surveys, such as where users drop off or hesitate, so you can quickly identify friction points and prioritize what to optimize next.
Wondering how to turn insights into real conversion wins? Digital NRG did – with a 133% boost using VWO. Read their story, then give VWO a try with a free trial.
Features
AI-powered Heatmap Generator, Advanced targeting & segmentation, Multilingual survey support, No-Code Editor, Personalization, VWO Copilot, A/B Testing, Personalization, Program Management
Pricing
- Free trial: 30-day complete access to all features.
- Paid: Starts at $199/month, billed annually.
Pros:
- AI-powered summaries of session recordings make it easy to identify key user behaviors without manual effort.
- The platform is user-friendly, with a wide range of features that are simple to configure and quick to deploy.
Cons:
- Doesn’t offer in-depth quantitative analytics, so it’s best complemented with a tool like Google Analytics for a complete data picture.
3. Mixpanel: Product usage data

Mixpanel is a real-time product analytics platform that tracks how users interact with websites, apps, and digital products. Designed for teams focused on product performance and retention, it captures every action and presents insights through intuitive, self-serve dashboards – no SQL required.
It reveals where users drop off, how they navigate your product, and what drives long-term engagement. From onboarding flows to feature adoption, Mixpanel connects the dots between user behavior and outcomes, helping teams cut through data silos and make faster, smarter decisions.
Features
Cohort Analysis, Session Replays, Funnels, Custom Events, Flow Reports, Anomaly Detection, Retention, Insights, Alerts, Customizable Templates, Ranges & Filters
Pricing
- Free: Forever, for up to 1 million events per month.
- Paid: Growth plan starts at $0 for 1M events/month, then $0.00028 per additional event.
Pros:
- Smooth implementation process with well-documented SDKs for both web and mobile apps.
- Delivers accurate, well-structured data with clear visualizations that are easy to interpret.
Cons:
- Costs can add up as data volume grows, which might make it less budget-friendly for smaller teams.
- Using many filter values at once can sometimes slow down data loading.
4. Zoho Analytics: Sales & revenue data

Zoho Analytics is a self-service BI platform that helps businesses track and visualize data from 500+ sources, including cloud apps, files, and data warehouses. With drag-and-drop dashboards, interactive reports, and secure sharing options, it simplifies data analysis and collaboration across teams.
Zia, the AI assistant, answers questions, detects anomalies, forecasts trends, and generates insights through natural language queries. From predictive models to smart alerts, Zoho Analytics makes data tracking faster, smarter, and accessible, without needing technical expertise.
Features
Visual Pipeline Builder, Drag-And-Drop Visualization Builder, Dashboards, Interactive Map Charts, Generative AI, AI-Powered Analysis, Predictive AI, Trend Analysis, Anomaly Detection, Clustering, What-If Analysis
Pricing
- Free trial: 15 days on all paid plans.
- Free: 2 users, 10K rows, dashboards & reports.
- Paid: Starts from $30/month.
Pros:
- A user-friendly interface combined with powerful visualization tools makes data analysis easy and engaging.
- Integrates seamlessly with key platforms, including GA4, Google Ads, and Facebook, for unified marketing analytics.
Cons:
- Syncing with external data sources can occasionally be delayed, particularly with larger datasets.
- Real-time data is limited, as most integrations refresh on an hourly or daily basis.
5. Hubspot Marketing Hub: Marketing & campaign data

HubSpot Marketing Hub is an all-in-one platform that combines marketing automation with powerful CRM-backed analytics. It helps businesses attract the right audience, run personalized campaigns at scale, and convert leads, all while keeping every touchpoint connected through the HubSpot CRM.
With AI-powered insights and real-time tracking, marketers can monitor campaign performance, segment audiences, and optimize their return on investment (ROI) across multiple channels. Its centralized data view ensures smarter automation, faster decisions, and clear alignment with sales, making every campaign measurable and more impactful.
Features
AI Agents, AI-Driven Search, Email Marketing, Personalization, Marketing Analytics, Dashboards & Reporting, Marketing Automation, Campaign Reporting
Pricing
- Paid:
- Individuals: Free tools for up to 2 users; paid plans start from $ 9 per seat per month, billed annually.
- Business: Plans start at $800 per month.
Pros:
- Provides strong reporting on KPIs, helping teams track performance and make data-driven decisions.
- Manage social media, email campaigns, contacts, and files, all from one intuitive platform.
Cons:
- It would be helpful to have admin-set limits to avoid unintentionally exceeding usage thresholds.
- Reporting tools could benefit from more customization options to fit unique team needs.
6. Leadinfo: Intent data

Leadinfo is a B2B visitor identification tool that reveals which companies visit your website using a global database of 220 M+ businesses. It tracks real-time behavior, highlights high-intent leads, and provides rich company profiles for targeted outreach. With 70+ integrations and a quick 5-minute setup, it fits easily into your CRM and marketing workflows.
Its smart features, like lead scoring, instant alerts, and the Leadbot, boost conversions by prompting visitors to take immediate actions like quote requests or WhatsApp chats. Marketers can also connect campaign data to visitor activity for real-time optimization, turning anonymous traffic into qualified leads.
Features
Real-Time Visitor Identification, Automated Lead Scoring, Leadbot, Lead Prioritization, Multi-Channel Outreach Campaigns, CRM Integrations, Autopilot, Screen Recording
Pricing
- Free trial: 14 days to try out the features.
- Paid: Starts from $73/month, billed annually.
Pros:
- User-friendly interface with accurate and reliable data.
- Lead scoring highlights high-value prospects, making sales and marketing efforts more focused and efficient.
Cons:
- It would be helpful if triggers allowed filtering by continents for broader targeting.
- Pricing may feel a bit high for smaller businesses with limited budgets.
7. GTMetrix: Web performance (Technical) data

GTmetrix is a website performance monitoring and optimization platform that helps businesses analyze how their web pages load, identify what’s slowing them down, and understand how to fix it. It combines Lighthouse metrics, Core Web Vitals, and real user data from CrUX to deliver clear, actionable insights. With testing available across 22 global locations and 40+ simulated devices, it delivers accurate performance results across browsers, regions, and screen types.
The platform offers scheduled testing, historical trend tracking, and instant alerts when performance drops, making it easy to stay ahead of issues. Interactive reports with waterfall charts, speed visualizations, and device-specific analysis give teams a clear roadmap for improving load times and user experience. GTmetrix turns technical performance data into practical, action-ready insights.
Features
Web Vitals, Higher Queue Priority, Video Capture For Alerts, Unlimited Tags & Filters, Data Retention, Hourly Monitoring, PDF Reports, Speed Visualization, Performance Roadmap
Pricing
- A free sign-up is available to explore the features.
- Paid:
- Individual plans: Start at $4.25/month, billed annually.
- Business plans: Start at $72.5/month, billed annually.
Pros:
- The user-friendly interface makes it accessible even for non-technical users, making it a valuable tool for marketers working on SEO.
- It generates detailed performance reports that highlight issues and make it easy to collaborate with technical teams.
Cons:
- Page tracking is limited to just three pages in the free plan, which may be restrictive for users needing broader coverage.
Best data tracking software: A comparison summary
| Data Tracking Tool | Best for | Features | Pricing |
| Google Analytics | Customer journey & lifecycle data | User Exploration using Segmentation, Real-Time Reporting, Funnel Analysis, Built-in Automation, Integrations, Predictive Analytics, Engagement Reports, Campaign Performance, Conversion Paths Reports, Cohort Exploration, Tag Management | Google Analytics is available at no cost to all users. |
| VWO Insights | User behavior data | AI-powered Heatmap Generator, Advanced targeting & segmentation, Multilingual survey support, No-Code Editor, Personalization, VWO Copilot, A/B Testing, Personalization, Program Management | Free trial: 30-day complete access to all features. Paid: Starts at $199/month, billed annually. |
| Mixpanel | Product usage data | Cohort Analysis, Session Replays, Funnels, Custom Events, Flow Reports, Anomaly Detection, Retention, Insights, Alerts, Customizable Templates, Ranges & Filters | Free: Forever, for up to 1 million events per month. Paid: Growth plan starts at $0 for 1M events/month, then $0.00028 per additional event. |
| Zoho Analytics | Sales & revenue data | Visual Pipeline Builder, Drag-And-Drop Visualization Builder, Dashboards, Interactive Map Charts, Generative AI, AI-Powered Analysis, Predictive AI, Trend Analysis, Anomaly Detection, Clustering, What-If Analysis | Free trial: 15 days on all paid plans.Free: 2 users, 10K rows, dashboards & reports.Paid: Starts from $30/month. |
| Hubspot Marketing Hub | Marketing & campaign data | AI Agents, AI-Driven Search, Email Marketing, Personalization, Marketing Analytics, Dashboards & Reporting, Marketing Automation, Campaign Reporting | Paid: Individuals: Free tools for up to 2 users; paid plans start from $ 9 per seat per month, billed annually. Business: Plans start at $800 per month. |
| Leadinfo | Intent data | Real-Time Visitor Identification, Automated Lead Scoring, Leadbot, Lead Prioritization, Multi-Channel Outreach Campaigns, CRM Integrations, Autopilot, Screen Recording | Free trial: 14 days to try out the features. Paid: Starts from $73/month, billed annually. |
| GTMetrix | Web performance (technical) data | Web Vitals, Higher Queue Priority, Video Capture For Alerts, Unlimited Tags & Filters, Data Retention, Hourly Monitoring, PDF Reports, Speed Visualization, Performance Roadmap | A free sign-up is available to explore the features. Paid: Individual plans start at $4.25/month, billed annually. Business plans: Start at $72.5/month, billed annually. |
Frequently asked questions
A data tracking system is a tool or process that collects, monitors, and analyzes user behavior, business metrics, or system performance to gain insights, make data-driven decisions, and optimize outcomes.
Begin by outlining your objectives, identifying the key metrics to track, and determining what types of data are most relevant. Use tools like analytics platforms, heatmaps, and session recordings to capture user interactions and performance data. Ensure accuracy and consistency by regularly monitoring your tracking setup, validating data, and staying aligned with privacy standards.
Start by identifying your goals and key metrics, then choose tools that align with your needs. Set up data sources, define tracking events or parameters, and ensure proper integration across platforms. Use dashboards for ongoing analysis and refinement.
Companies use data tracking to understand user behavior, measure performance, improve customer experiences, make informed decisions, and ultimately drive growth more efficiently.
Categories:


![10 Best Enterprise Analytics Platforms [2026]: Expert Picks with Reviews and Comparisons](https://static.wingify.com/gcp/uploads/sites/3/2025/08/Feature-image-10-Best-Enterprise-Analytics-Platforms_-In-Depth-Reviews-and-Comparisons.jpg?tr=h-600)