Customer Experience Monitoring: A Guide to Improving CX
Exceptional customer experience has become the new battleground for digital businesses – it’s the biggest driver of loyalty, and the quickest way to lose it.
It takes just one poor interaction for 1 in 3 customers to walk away from a brand they once loved. At the same time, nearly 80% of consumers now define a great experience by speed, convenience, knowledgeable support, and friendly user interactions.
This dual reality makes one thing clear: winning loyalty today depends on delivering seamless, personalized customer journeys every single time. To do that, businesses must first be able to see what customers are experiencing.
The solution lies in customer experience monitoring, which provides a structured approach to observing, analyzing, and improving the digital journey in real time.
In this guide, we’ll explore what CX monitoring is, the benefits it brings, the key metrics to track, the tools that make it possible, and how VWO helps businesses turn these actionable insights into measurable impact.
What is customer experience monitoring?
Digital customer experience monitoring (CX monitoring) is the practice of tracking, analyzing, and understanding how users interact with a brand across digital and voice channels, such as web applications, mobile apps, chatbots, and social media. The goal is to uncover what delights customers, where friction occurs, and how the overall journey can be improved.
Customer experience monitoring brings together data from digital sources, like click paths, session replays, customer feedback, and social sentiment, to identify trends to give businesses a clear view of user behavior and motivations. These actionable insights help refine touchpoints, remove friction, and deliver personalized experiences that boost customer satisfaction, loyalty, and conversions.
Benefits of CX monitoring
When applied to digital journeys, customer experience monitoring does more than provide data; it enables businesses to transform how they serve, engage, and retain existing customers. Here’s how CX monitoring helps:
Proactive issue resolution
- Real-time visibility: Continuous monitoring identifies performance issues like slow page loads, response times, broken elements, or drop-offs before they escalate.
- Fewer disruptions: By resolving problems early, businesses minimize disruptions and reduce customer frustration.
- Preventive action: Teams can address risks proactively, cutting reliance on complaints and lowering support costs through smarter resource allocation.
Stronger customer relationships
- Faster, smoother journeys: Insights reveal where customers struggle, allowing businesses to simplify digital touchpoints.
- Personalized engagement: Monitoring uncovers customer behavior patterns and insights that can be used to deliver tailored recommendations, offers, and content.
- Greater satisfaction and loyalty: Consistently improving experiences builds trust, helps improve customer satisfaction, and encourages repeat engagement.
Business growth and competitive advantage
- Higher conversions and revenue: Optimized digital flows, like checkout, signups, or onboarding, directly boost outcomes and support customer acquisition.
- Lower churn and higher lifetime value: Happy customers stay longer and contribute more to long-term growth.
- Brand reputation and differentiation: Delivering superior digital experiences reduces negative reviews and positions the brand ahead of competitors.
How to effectively monitor customer experience?
Customer experience monitoring focuses on building a system that continuously evolves and improves the digital journey. Here’s a framework businesses can follow:
Map the digital journey
Identify every digital touchpoint where customers interact with your brand: websites, mobile apps, chatbots, or social media. Mapping the entire customer journey helps you visualize the complete customer flow and spot areas where drop-offs or frustrations occur.
Example: An online learning platform mapped its student journey across its website and email touchpoints. They discovered that while enrollments were high, most learners dropped off before completing the first lesson. By identifying this stage as a weak link, the platform could focus efforts on better onboarding tutorials and engagement nudges.
Collect data from multiple sources
Strong CX monitoring starts with diverse data inputs. This includes behavioral data (click paths, session replays, analytics), direct feedback (surveys, in-app ratings, chat responses), and unsolicited feedback (social media mentions, reviews). A multi-source approach ensures no blind spots.
Example: A fintech app noticed high drop-offs during money transfers. Funnel analytics highlighted where users abandoned, while app-store reviews revealed the root cause: uncertainty about transfer times and confirmations. By adding real-time progress indicators and clearer success messages, the app reduced abandonment and boosted customer trust.
Analyze data for insights
Raw data alone doesn’t drive improvement; analysis does. Effective CX monitoring combines quantitative signals (like drop-off analytics and exit rates) with qualitative signals (like session replays and observed hesitation) to uncover the “why” behind customer behavior. For instance, if analytics show high exit rates on a payment page, session replays can reveal whether slow load times or unclear forms are to blame.
Example: A SaaS analytics platform saw heavy drop-offs during the “create first report” step of onboarding. Funnel analytics revealed where the abandonment spiked, while deeper analysis of session replays showed users hesitated because the setup instructions were too technical. Simplifying the onboarding copy improved completion rates significantly.
Integrate customer feedback
Feedback shouldn’t sit in silos. Actively weave it into decision-making by addressing issues quickly and using customer suggestions to refine experiences. A closed feedback loop shows customers that their voices matter and strengthens trust.
Example: A telehealth service noticed survey comments about doctors frequently joining video consultations late. CX monitoring combined this feedback with consultation time data, confirming the delays. The service reduced wait times, cut down on complaints, and saw a measurable rise in patient satisfaction scores.
Enable real-time tracking
Digital expectations move fast. Real-time monitoring tools let businesses detect issues, like failed logins, chatbot errors, or checkout delays, as they happen, so teams can respond instantly and reduce negative impact.
Example: A music streaming service detected unusual buffering patterns in real time. Instead of waiting for complaints, engineers diverted traffic to backup servers instantly, keeping listening experiences smooth for thousands of users.
Benchmark against standards
Improvement is relative; tracking your customer experience metrics against industry performance benchmarks or competitor performance helps you understand where you stand. Benchmarking highlights whether your digital experience is truly world-class or just average.
Example: A ride-hailing app benchmarked its booking completion rate against industry averages and found it lagged behind competitors. Internal CX monitoring data pinpointed high drop-offs at the payment step. Acting on these insights, the team reworked the booking flow, adding clearer driver ETAs and simplified payment steps.
Test, act, and refine continuously
Turn insights into action by optimizing digital touchpoints and testing changes through A/B or multivariate experiments. Continuous refinement ensures your CX strategy evolves alongside shifting customer expectations.
Example: A digital news subscription service company noticed through monitoring that many users abandoned its website during onboarding. To address this, they ran an A/B test comparing two flows: one offering a free trial immediately and another after full sign-up. Funnel analytics revealed that the first flow increased trial sign-ups and, more importantly, improved long-term retention. Acting on these results, the service adopted the trial-first flow, proving that early value delivery drives loyalty.
Key metrics to monitor customer experience
To evaluate and improve digital journeys, businesses need to track metrics that reveal both customer sentiment and user behavior. Here are the most important CX monitoring metrics:
- Net Promoter Score (NPS): Measures customer loyalty by asking how likely users are to recommend your brand. A high NPS signals strong advocacy, while a low score highlights dissatisfaction that needs attention.
- Customer Effort Score (CES): Evaluates how easy it was for customers to achieve a goal, like signing up, resolving an issue, or making a transaction. Lower effort equals a smoother digital journey and higher satisfaction.
- Customer Satisfaction Score (CSAT): Measures the level of satisfaction customers experience during a specific interaction, such as completing a purchase, using a mobile app, or seeking online support. Because 96% of customers say service quality directly shapes their loyalty to a brand, CSAT offers an immediate pulse to gauge customer satisfaction and assess whether your experience is building trust or putting retention at risk.
- Task Success Rate: Measures the percentage of users who complete a task (e.g., submitting a form or booking a service), reflecting the effectiveness of a product or feature. A low success rate often points to usability issues or design flaws.
- Error/Failure Rate: Indicates the share of interactions that don’t go as intended, such as experiences that frustrate customers, trigger complaints, or require additional support to resolve. A rising error rate often points to gaps in systems, processes, or communication, while a low rate reflects dependable service and smoother journeys.
- Average Response Time: Tracks how long it takes customer service teams to reply to an inquiry across channels like chat, email, or messaging. It’s a key indicator of service efficiency: shorter response times usually signal efficient, attentive service, while longer delays often lead to frustration and lower CSAT scores.
- First Contact Resolution (FCR): Measures the share of customer issues resolved during the very first interaction, whether by phone, chat, or email. High FCR reflects clear processes and empowered support teams, reducing the need for follow-ups. It minimizes customer effort, boosts satisfaction, retention, and overall service efficiency.
- Uptime/Availability: Shows how consistently a system or application is accessible and performing as intended. Uptime is the percentage of time a service runs, while availability also factors in maintenance and error-free operation. Low availability disrupts customer journeys, reduces trust, and impacts business performance, making it a critical metric for ensuring reliable digital experiences.
- Time to First Value (TTFV): Measures how quickly a new customer experiences the first real benefit of a product or service, like completing setup or streaming content. It reflects onboarding effectiveness and strongly influences satisfaction, adoption, and retention. A shorter TTFV shows faster value delivery, driving engagement, renewals, and loyalty.
While not always directly measured through CX monitoring tools, these metrics are critical for tying experience to business outcomes. They should be integrated into a CX monitoring framework:
- Churn Rate: Tracks the percentage of customers who stop engaging with your brand over a set period. High customer churn indicates gaps in experience or value, while reducing churn directly boosts revenue stability.
- Customer Retention Rate: The inverse of churn, this metric measures the percentage of customers who continue to use your product or services. A strong retention rate reflects consistency and trust in the digital experience.
- Conversion Rate: Indicates the percentage of visitors who take desired actions, such as subscribing, downloading, or purchasing. It’s a direct measure of how effectively your digital touchpoints drive business results.
| Key Metric | Calculation Formula |
| NPS | % Promoters – % Detractors |
| CES | Sum of all responses/Number of respondents |
| CSAT | Total number of satisfied responses/Total number of responses |
| TSR | (Total of completed tasks/Total number of task attempts) X 100 |
| Error Rate | (Number of errors/ Total number of interactions) X 100 |
| ART | (Total response time for all tickets/Total number of tickets) |
| FCR | (Number of issues resolved on first call/Total issues reported) X 100 |
| Availability | Total uptime/(Uptime+Downtime) X 100 |
Customer experience monitoring tools
To capture a complete picture of the customer journey, businesses need digital experience monitoring tools that track customer data, uncover behavioral patterns, and measure sentiment. These three categories together create a holistic customer experience monitoring strategy. Let’s look at how this applies to a common scenario: improving an eCommerce checkout experience.
Web analytics tools
These tools focus on quantitative insights that reveal what is happening in the digital journey. They are directional, showing where to dig deeper while tracking performance at scale.
- Track visits, bounce rates, navigation paths, and conversions to spot performance issues; for example, identifying that a significant percentage of shoppers abandon the journey at the payment stage. This points to a drop-off but doesn’t explain the reason, highlighting the need to dig deeper.
Behavioral tools
Behavioral monitoring highlights how customers interact with your digital touchpoints.
Session recordings: Capture individual user journeys by replaying clicks, scrolls, and navigation paths. They show exactly how users move through a site or app and where they encounter friction. For example, a recording might reveal users hovering over the “Payment Method” section or repeatedly clicking on a non-interactive element, signaling confusion.
Heatmaps: Aggregate user behavior into a visual map, using colors to highlight high- and low-engagement areas on a page. For instance, a heatmap might reveal that users are clicking heavily on a promotional banner but almost ignoring the main “Checkout” button, or that most scroll activity stops well before important product details.
Sentiment tools (feedback & social listening)
Sentiment monitoring reveals why customers feel the way they do about their experience.
- Feedback & Surveys: Collect direct input from customers through a quick post-exit survey that asks, “What stopped you from completing your purchase?” Customers respond with reasons like “checkout was too long” or “payment options weren’t available.” These tools capture how users feel about their experiences in the moment.
- Social listening: Picks up conversations on Twitter or Instagram or other social media platforms where frustrated shoppers leave negative reviews about “clunky checkout” or “cards not working,” giving authentic, unfiltered feedback at scale.
Combining behavioral monitoring with sentiment analysis helps generate stronger A/B testing hypotheses. Behavioral data reveals how users behave, while sentiment feedback uncovers why. Together, they provide the clarity needed to design experiments that drive meaningful improvements in customer experience.
How VWO helps you monitor and improve customer experience
Improving digital customer experience requires three things: deep visibility into customer behavior, personalized engagement, and ongoing experimentation. VWO brings all of these together in one unified platform, enabling businesses to move from monitoring problems to actively enhancing every touchpoint.
Download Free: Customer Experience Optimization Guide
VWO Insights: Turning behavior into clarity
Every visit to a website or app produces signals: where people click, which forms they leave incomplete, and the exact moments they exit. VWO Insights translates this behavior into practical learnings that teams can act on.
- Heatmaps illustrate which parts of a page capture attention and where users disengage.
- Session recordings recreate individual journeys, making it easier to spot frustrations like repeated clicks or stalled navigation.
- Feedback surveys run directly on-page, helping uncover what users hoped to achieve versus what held them back.
- Form analytics highlight weak points in lead-generation forms, such as fields frequently abandoned or re-entered.
- Funnel tracking and segmentation show where customers drop out in multi-step journeys, helping prioritize improvements.
With Insights, brands see more than numbers; they gain visibility into what users experience in real time.
See how Greyson Clothiers used VWO Insights to uncover customer behavior across filters, navigation, and CTAs. By acting on these insights, they optimized collection page filters and improved mobile usability, leading to higher engagement, reduced bounce rates, and a 10.5% lift in revenue.
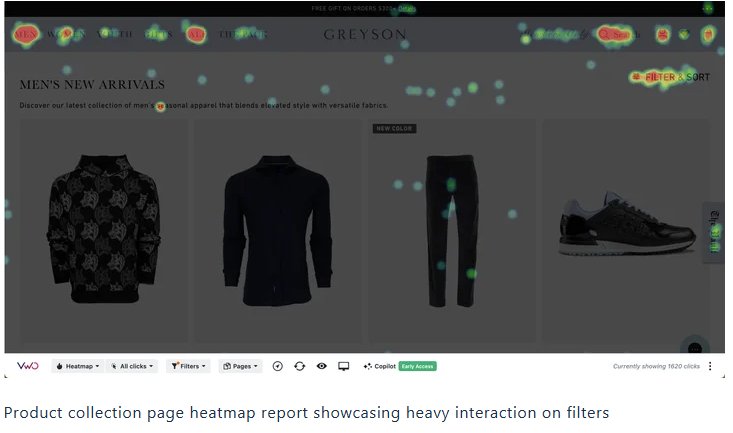
Tap into the VWO Insights dashboard to get a single view of how visitors behave across your site, turn clicks, drop-offs, and feedback into clear visual insights, and prioritize fixes where friction impacts conversions most.
VWO Personalize: Making experiences relevant
Modern customers expect experiences that feel tailored to them. VWO Personalize helps brands move from generic journeys to context-aware experiences by:
- Adjusting page content, banners, or offers based on a visitor’s intent, history, or device.
- Recognizing repeat visitors and serving content that matches their past behavior.
- Creating relevance that increases engagement, encourages return visits, and strengthens brand connection.
Orascom Hotels used VWO Personalize to deliver localized summer offers with 40% discounts in English and German, driving 873 bookings worth $352,377 and contributing 42% of total revenue. [Read the full success story here].

VWO Testing: Proving what works
Optimization doesn’t happen through assumptions; it comes from structured experimentation. VWO Testing enables businesses to validate changes before rolling them out widely.
- A/B testing compares two versions of a page to see which converts better.
- Multivariate testing explores combinations of multiple elements to find the most effective mix.
- Split URL testing evaluates completely redesigned pages hosted on different URLs.
- Mobile and server-side testing extend optimization beyond websites, covering native apps and backend functionality.
Testing with VWO turns hypotheses into measurable results, ensuring improvements are backed by evidence rather than guesswork.
Buyakilt.com, an online Scottish apparel retailer, enhanced its customer experience by using VWO to A/B test product filters on category pages, making it easier for shoppers to find exactly what they wanted. The result? A remarkable 76.1% boost in revenue, along with a 26% rise in conversions and a 19.76% increase in shopping cart visits.
VWO provides reliability at scale, offering global infrastructure, consistent uptime, and strict compliance with data privacy standards. That means businesses can experiment freely while knowing customer trust is protected.
Start your free trial or book a demo today to see how VWO can transform your customer experience.
FAQs
Customer experience monitoring is the practice of tracking and analyzing customer interactions across websites, apps, chatbots, and social media to understand user behavior, measure satisfaction, and optimize every touchpoint.
CX monitoring highlights where customers succeed, where they struggle, and why they abandon journeys. It uncovers friction points, like long forms or slow pages, while also showing opportunities to personalize and improve the overall experience.
The most important KPIs include:
a. NPS (Net Promoter Score): Customer loyalty and advocacy.
b. CSAT (Customer Satisfaction Score): Immediate satisfaction after an interaction.
c. CES (Customer Effort Score): Ease of completing a task.
d. Task Success Rate: Percentage of users completing key tasks
e. Error/Failure Rate: Frequency of interactions that result in errors, complaints, or require recovery.
f. Average Response Time: How quickly support teams respond to customer inquiries.
g. First Contact Resolution (FCR): Percentage of issues solved in the first support interaction.
h. Uptime/Availability: Consistency of system or application accessibility and reliability.
i. Time to First Value (TTFV): How quickly new customers experience their first tangible benefit.
Categories: