Top Conversion Metrics You Should Be Tracking in 2026
You fixed the design. Tweaked the CTA. Ran the ads.
But conversions? Still not where they should be.
Chances are, it’s not just what you’re doing, it’s what metrics you’re tracking and measuring. In 2026, the difference between a high-performing marketing strategy and a leaky funnel often comes down to the important metrics you’re tracking (or ignoring).
This isn’t another list of numbers. It’s a practical guide to the important conversion metrics that reveal what’s working, what’s holding you back, and where your next growth opportunity lies.

What are conversion metrics?
Conversion metrics are performance indicators that measure whether your digital efforts are prompting users to take meaningful actions. These could include actions like submitting a form, engaging with a feature, or completing a transaction, depending on what success looks like for your business.
By tracking how users respond to your website or campaign, these conversion metrics offer a way to evaluate how well your content drives real outcomes. They help marketers assess effectiveness, optimize strategies, and make informed decisions based on actual user behavior.
Importance of conversion metrics
Conversion metrics are more than just numbers; they offer actionable insights into how well your digital efforts translate into meaningful results. Here’s why they matter:
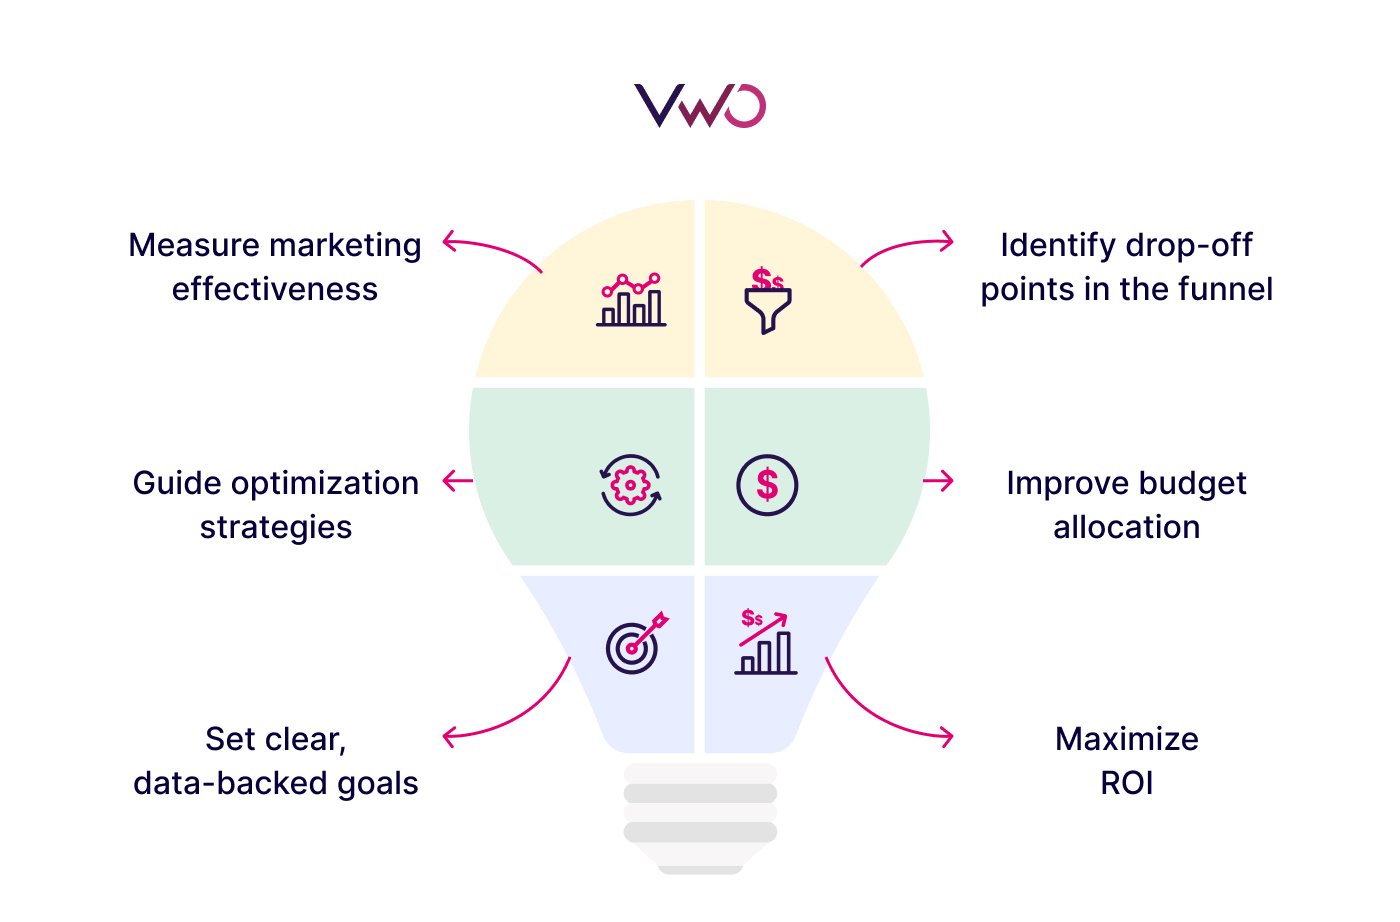
1. Measure marketing effectiveness
Conversion metrics show whether your marketing campaigns are prompting users to take desired actions, like clicks, sign-ups, or purchases, that contribute to your business goals. They go beyond just visibility (like impressions) and help assess if users are engaging with your content in ways that align with your business goals.
2. Identify drop-off points in the funnel
By tracking how users move through each stage of your sales funnel, conversion metrics help uncover where potential customers are dropping off. This makes it easier to pinpoint friction, optimize user journeys, and recover lost opportunities.
3. Guide optimization strategies
Conversion data forms the backbone of CRO (Conversion Rate Optimization). It helps teams test what’s working, whether it’s messaging, design, or targeting, and make iterative improvements based on evidence, not guesswork.
4. Improve budget allocation
With a clear understanding of what drives results, digital marketing budgets can be better allocated toward high-performing channels, creatives, or target audience segments. This ensures resources are invested where they deliver the highest return.
5. Set clear, data-backed goals
Conversion metrics provide a foundation for setting measurable performance benchmarks, like increasing form completion rates or improving trial-to-paid conversions. These goals align team efforts and create a shared view of key performance indicators, helping marketing, product, and sales work together more effectively toward growth, retention, and measurable progress.
6. Maximize ROI
Ultimately, optimizing for conversions leads to lower cost per acquisition and a better return on digital marketing investments, and a higher average conversion rate. It’s the difference between marketing campaigns that just attract clicks and those that deliver real, lasting value.
Key conversion metrics: Quick overview
Macro metrics:
- Conversion Rate
- Cost per acquisition (CPA)
- Customer acquisition cost (CAC)
- Customer lifetime value (CLV/LTV)
- Return on ad spend (ROAS)
- Revenue per visitor (RPV)
- Retention rate
- Customer churn rate
- Net promoter score (NPS)
Micro metrics:
- Website traffic & sources
- Click-through rate (CTR)
- Bounce rate
- Exit rate
- Average session duration
Breakdown of key conversion metrics: A detailed walkthrough
Macro conversion metrics
Macro conversions represent the primary business goals, such as completing a purchase, signing up for a paid plan, or submitting a lead form. Metrics tied to these actions directly reflect success in terms of revenue or growth.
Macro conversion metrics offer a high-level view of how effectively your website, funnel, or digital marketing campaign is driving key business outcomes. These metrics are especially valuable for eCommerce brands tracking purchases, SaaS companies monitoring upgrades and retention, and B2B or lead generation teams measuring qualified leads and cost per acquisition.
Below are some of the key macro conversion metrics that are useful across businesses:
Conversion rate
Conversion rate is the percentage measure of how many website visitors take the action you want, whether that’s buying a product, submitting a form, or signing up for a service. It’s a core metric for understanding how well your website or campaign turns traffic into meaningful results.

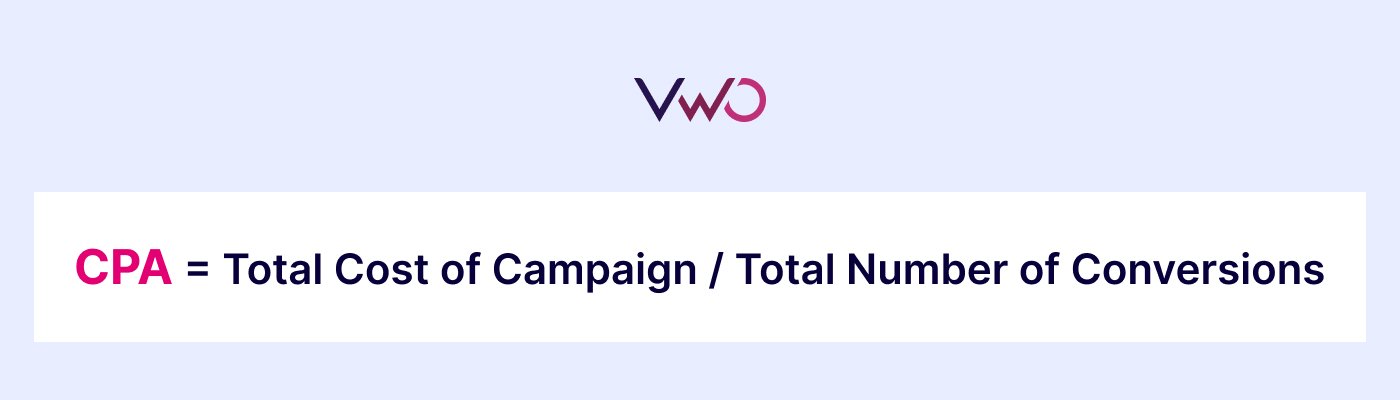
Cost per acquisition (CPA)
Cost per acquisition measures how much you spend to gain/acquire one customer through a specific campaign or channel, such as a purchase, form submission, or other goal. It helps evaluate the cost-efficiency of your digital marketing strategy and is key to managing paid campaign performance strategies, impacting your sales conversion rate.
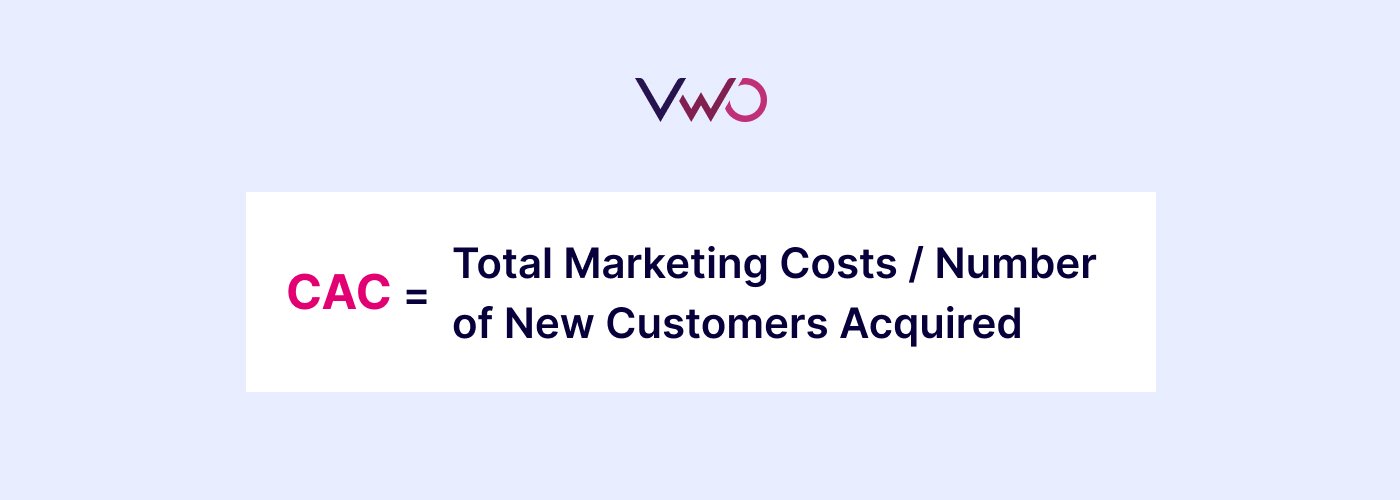
Customer acquisition cost (CAC)
Although similar to Cost per acquisition, CAC takes a broader view. While CPA tracks the cost of a single conversion (like a sign-up or download), Customer Acquisition Cost measures the total expense incurred to acquire one paying customer, including marketing, sales, analytics tools, and personnel costs.
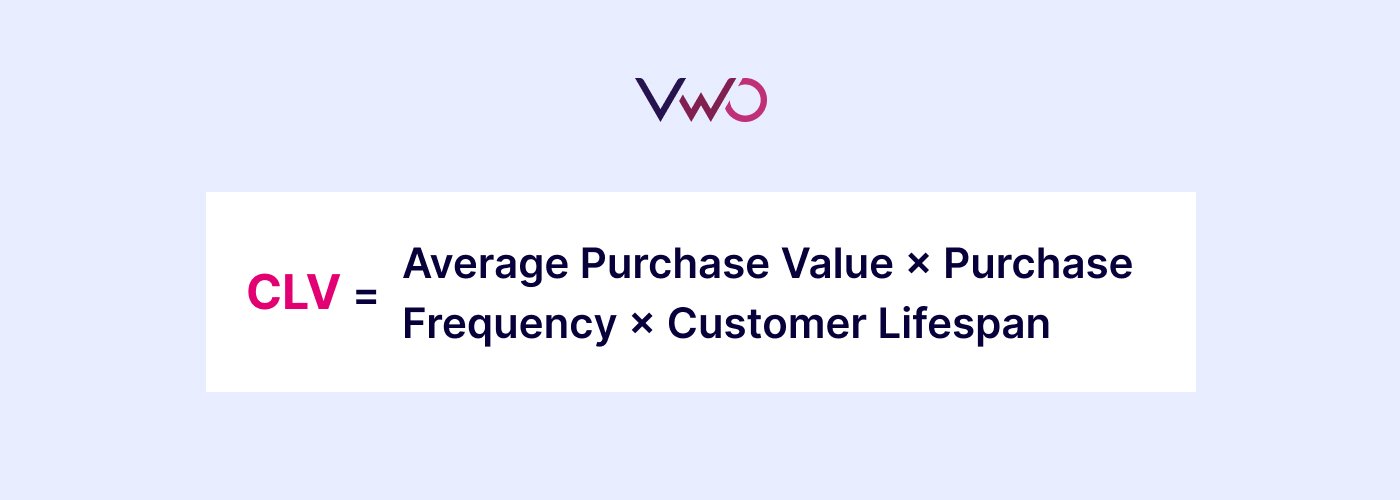
Customer lifetime value (CLV/LTV)
Customer Lifetime Value (CLV) measures how much income an eCommerce business can expect to earn from a customer across the full span of their engagement. Tracking CLV not only highlights the long-term worth of a customer but also helps fine-tune digital marketing strategies, retention efforts, and resource allocation. It also guides decisions around balancing acquisition costs and building profitable customer relationships.
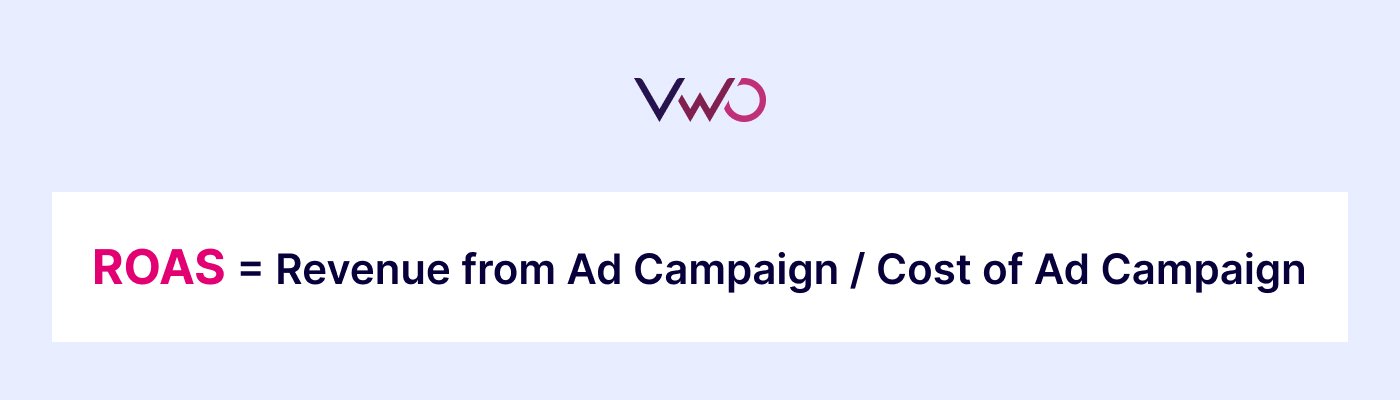
Return on ad spend (ROAS)
Return on ad spend indicates how much revenue you earn for every unit of currency spent on advertising. It’s a direct measure of ad efficiency and conversion rate optimization metrics, helping you understand whether your paid marketing campaigns are generating profitable returns.
A healthy ROAS means your digital marketing budget is being put to work effectively, while a low ROAS signals the need to revisit targeting, creatives, or bidding strategy. For example, a ROAS of 4 means you earn $4 in revenue for every $1 spent on ads.
Revenue per visitor (RPV)
Revenue Per Visitor measures the average revenue generated from each website visit. It helps assess how effectively your site turns traffic into revenue and is especially useful for evaluating landing pages, product pages, and monetization strategies.
RPV also uncovers opportunities to boost revenue through upselling, personalized recommendations, loyalty programs, cart reminders, live chat, and on-site optimization.

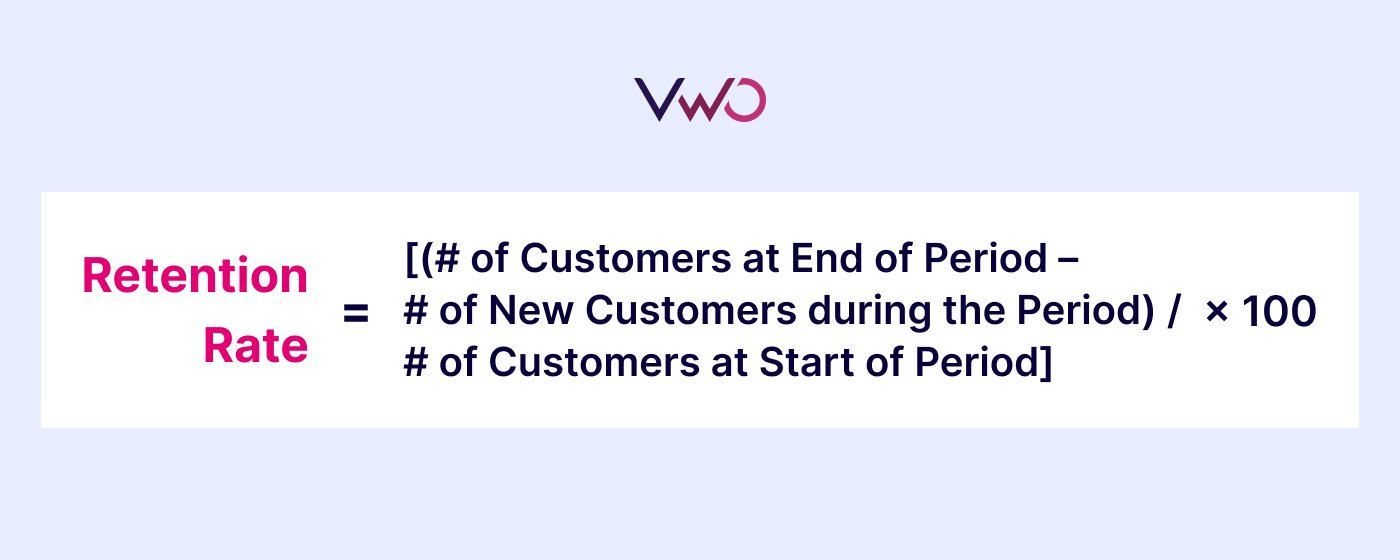
Retention rate
Retention Rate measures the percentage of customers who continue to engage with or purchase from an eCommerce business over a specific period. It’s a key indicator of customer satisfaction, product value, and loyalty for digital marketers. This metric is especially important for subscription-based businesses, as it reflects recurring revenue potential, regardless of whether new customers are acquired.
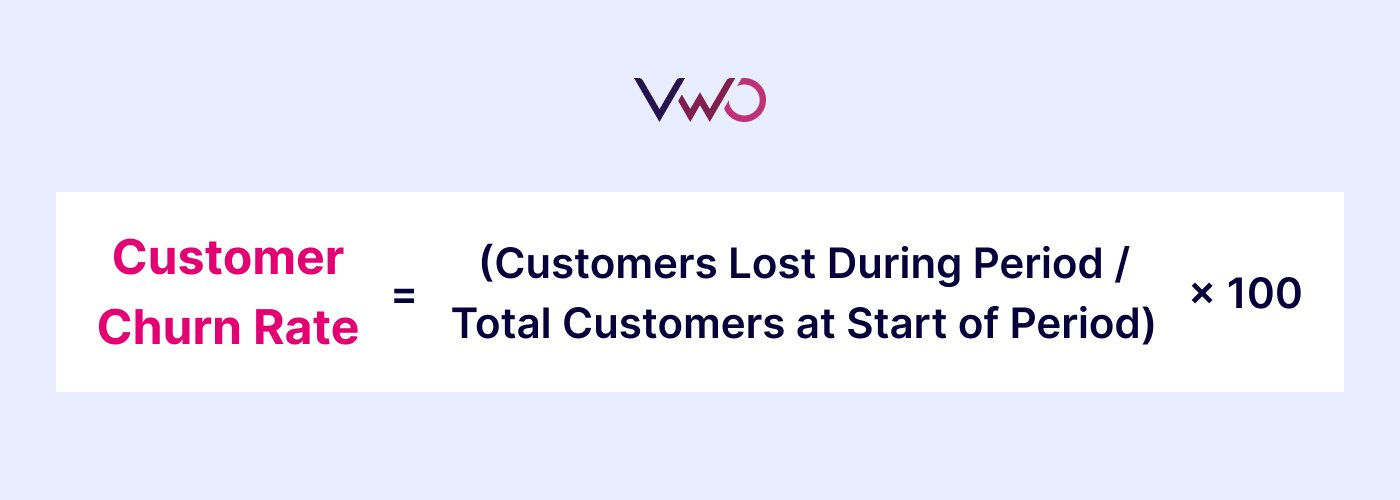
Customer churn rate
Customer Churn Rate indicates the percentage of customers who discontinue using your product or service within a given time frame. It’s the flip side of retention and is critical for understanding customer dissatisfaction or disengagement. A rising churn rate may also indicate that customers are switching to competitors, signaling deeper issues with product value, experience, or support.
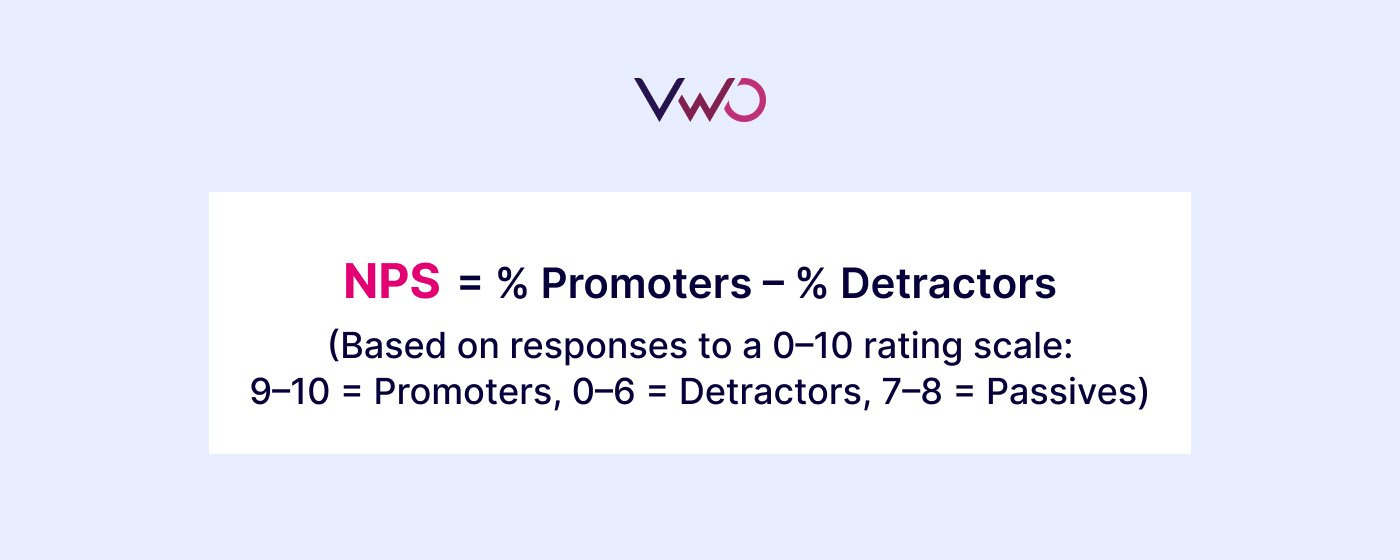
Net promoter score (NPS)
Net Promoter Score (NPS) measures how willing your customers are to recommend your product or service, offering a clear signal of overall satisfaction and brand loyalty.
Collected through a single survey question, it offers a clear snapshot of overall customer satisfaction and how strong their connection is with your brand.
Micro conversion metrics
Micro conversions are smaller actions that show user interest, engagement, or progress toward a macro goal. These can be navigational, informational, or behavioral, such as clicking a CTA, spending time on a product page, adding a product to the cart, starting the checkout process, or signing up for a newsletter.
While they don’t represent final conversions, they help identify bottlenecks and drop-off points. Micro metrics are especially useful for diagnosing where users are losing interest and improving the user experience. They’re especially relevant for SaaS and tech platforms tracking interaction patterns, media and content sites monitoring engagement, and eCommerce brands optimizing product discovery and cart progression.
Some key micro conversion metrics to track are:
Website traffic & sources
Website traffic refers to the total number of visits your site receives, while traffic sources indicate the origin of those visitors. Together, they help evaluate the reach of your marketing efforts, reveal which channels drive the most engagement, and provide a foundation for analyzing conversions.
Tools like Google Analytics help track traffic volume and its sources, including:
- Direct: Users who visit by typing the website URL directly.
- Search: Traffic from search engines like Google or Bing.
- Referral: Visitors arriving via links from other websites or social platforms.
- Paid: Traffic driven by paid ads such as Google Ads or social media campaigns.
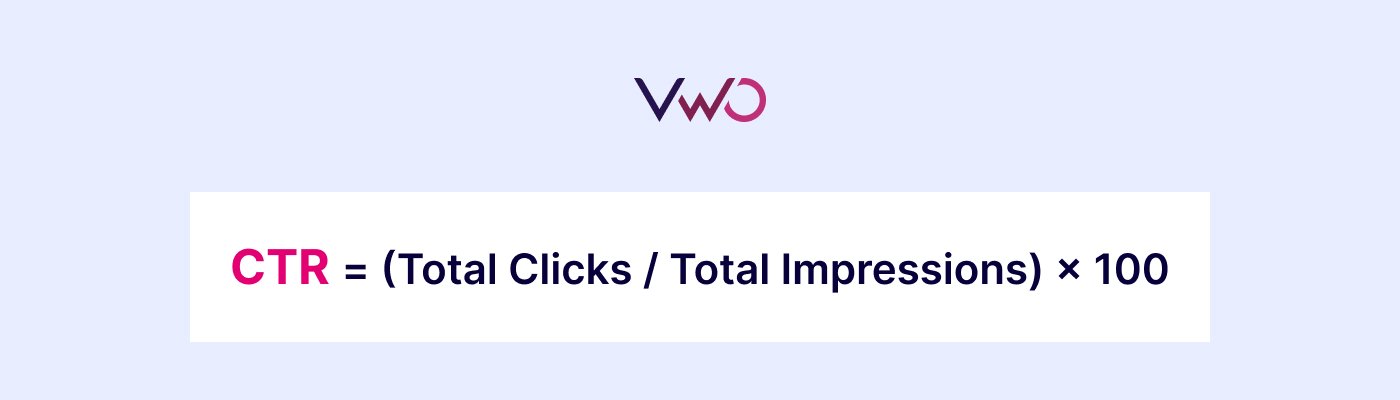
Click-through rate (CTR)
CTR indicates the percentage of users who clicked on a link, ad, or call-to-action after viewing it. It reflects how effective your content is at grabbing attention and driving engagement, particularly in paid campaigns, emails, and search listings.
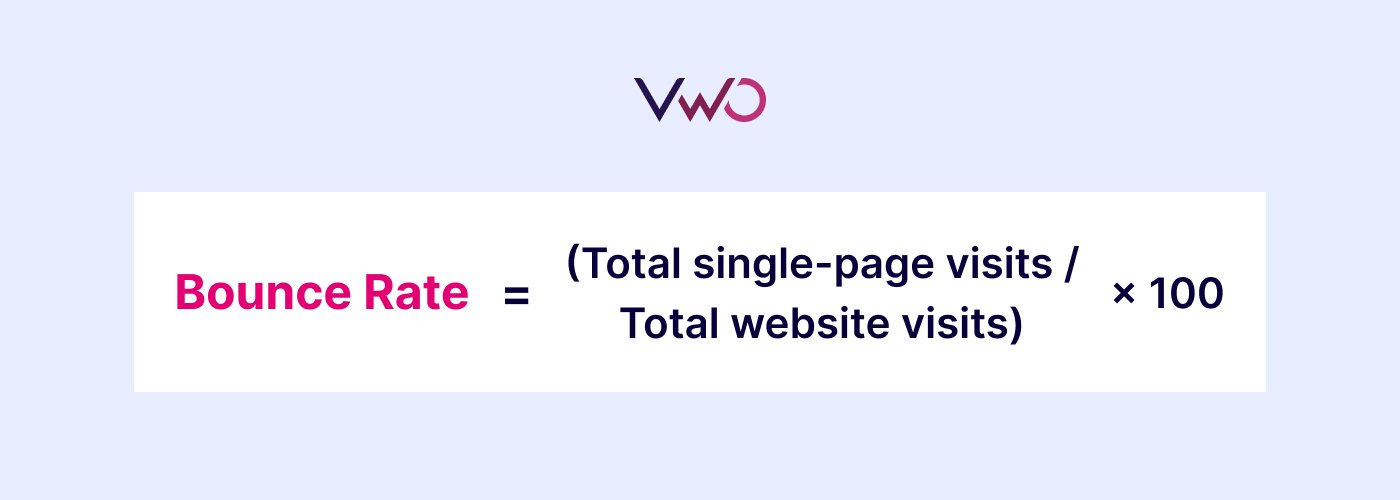
Bounce rate
Bounce rate tracks how many users exit your site after landing on a single page, without clicking or exploring any further. A high bounce rate may indicate issues with page relevance, load time, design, or user expectations, making it a key metric for identifying weak points in the user experience.
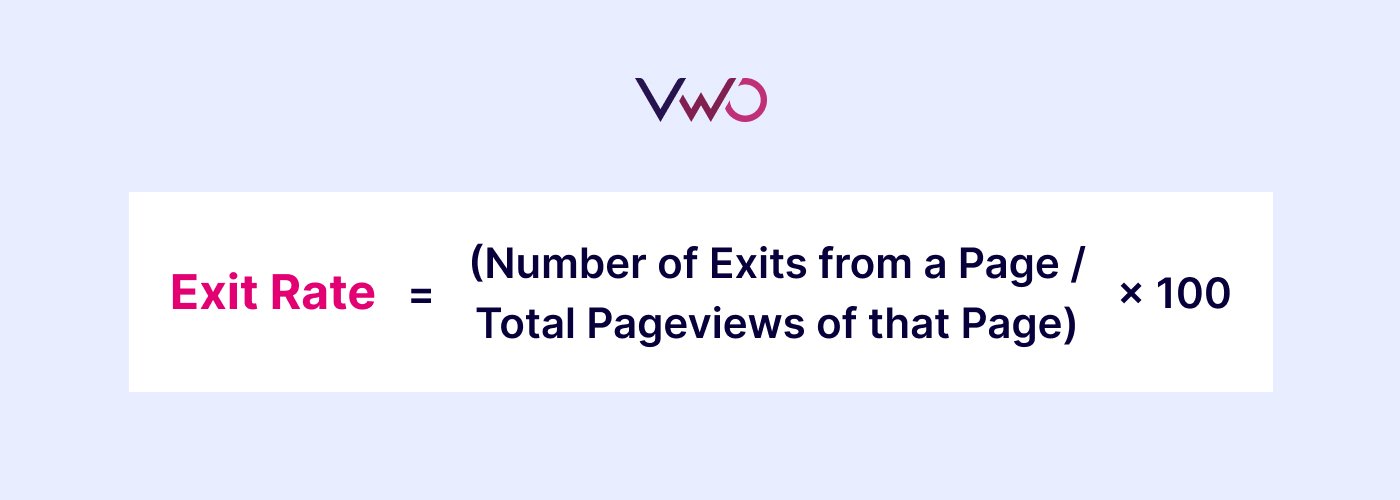
Exit rate
Exit rate reflects the proportion of users who leave your site from a particular page, no matter how many pages they visited beforehand. Unlike bounce rate, which tracks exits from the entry page, exit rate highlights the specific points in the journey where users choose to leave.
A high exit rate on critical conversion pages, like a cart, pricing, or checkout, can signal friction, confusion, or a loss of trust, making it a vital metric for optimizing the user journey.
Average session duration
Average session duration measures how long a visitor stays on your website during one visit. It provides insight into user engagement and content relevance; longer sessions often suggest higher interest, while shorter ones may indicate poor UX or unengaging content.

Analyze your eCommerce website for free
Tools for measuring and tracking conversion metrics
VWO’s Metrics feature unites every conversion goal into a single, reusable library, no matter whether you’re running A/B tests in VWO Testing, personalizations in VWO Personalize, feature flags in VWO FME, or insights studies in VWO Insights.
Instead of defining “Demo Request” or “Add to Cart” over and over, you simply go to Data360 → Metrics, give it a name and description, pick from six built-in event types (Page Visit, Click, Form Submit, Engagement, Page Unload, Bounce) or any custom event, and choose how you want to count it (once per unique visitor, every occurrence, or by summing an event property such as revenue). That definition lives forever, ready to drop straight into any campaign, eliminating setup friction and ensuring you’re always measuring the same thing, consistently.
Because Metrics captures everything from page visits and button clicks to scroll depth, video plays, and custom interactions, you get a full-spectrum view of user behavior. You can track repeated actions, how many times a visitor added items to the cart or attempted payment, and even pull in revenue values or time-on-page automatically.
When it’s time to analyze, you don’t have to stitch together separate goal reports. Your standard, custom, and calculated metrics appear side by side wherever you look, whether in the campaign’s primary/secondary metric pickers or Data360’s consolidated dashboards. Filters for date range, visitor segment, or revenue band let you zero in on the exact cohort or timeframe you care about.
Find out how to get started with metrics inside VWO.
Leverage AI-Suggested Metrics by opening the METRICS tab in the VWO Editor bar. VWO Copilot will scan your page for key interactions (Add to Cart clicks, filters, form submissions) and instantly recommend the most relevant metrics to track.
With VWO Funnels, you can map the entire user journey step by step, where each stage must be completed for a conversion to count. Funnel reports, managed through a central dashboard, display conversion rates, drop-offs, and trends over time. Filters like date range, revenue, or user segment help pinpoint where users drop off.
Once you identify where users drop off, VWO helps uncover the “why” through detailed behavior tracking. It captures interactions like clicks, scrolls, rage clicks, and form hesitations across devices. Tools like session recordings, heatmaps, and form analytics reveal friction points, while the Insights dashboard adds behavioral scores and automated analysis to flag issues like dead clicks and poor UX, making it easier to prioritize fixes.
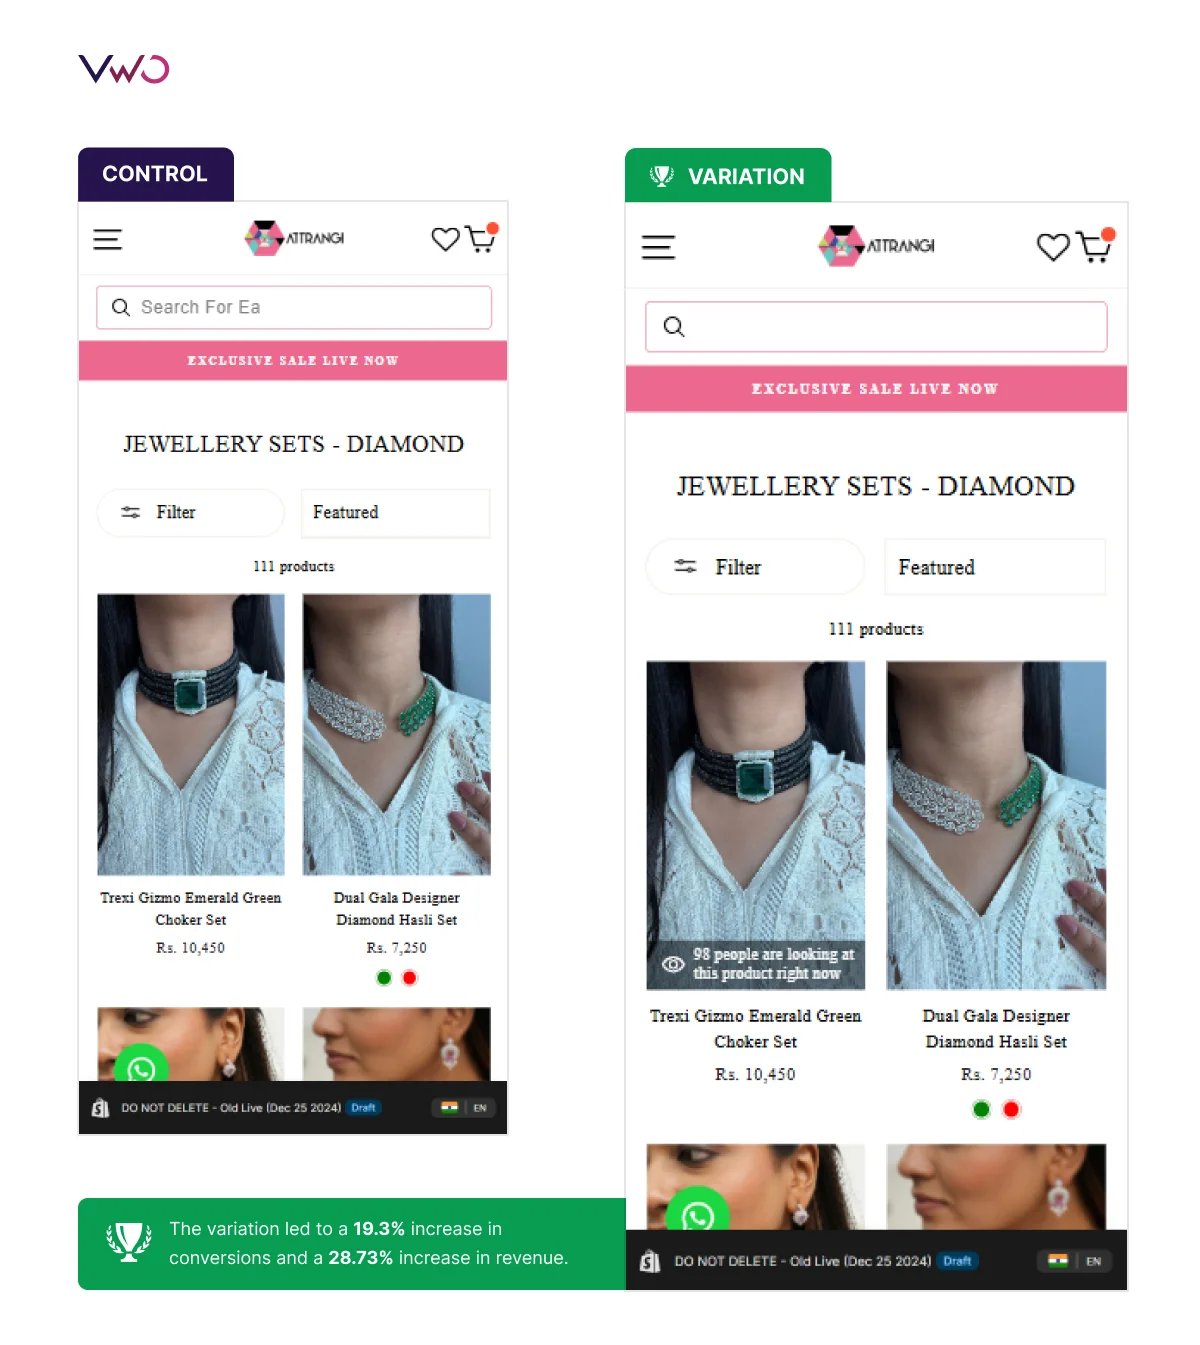
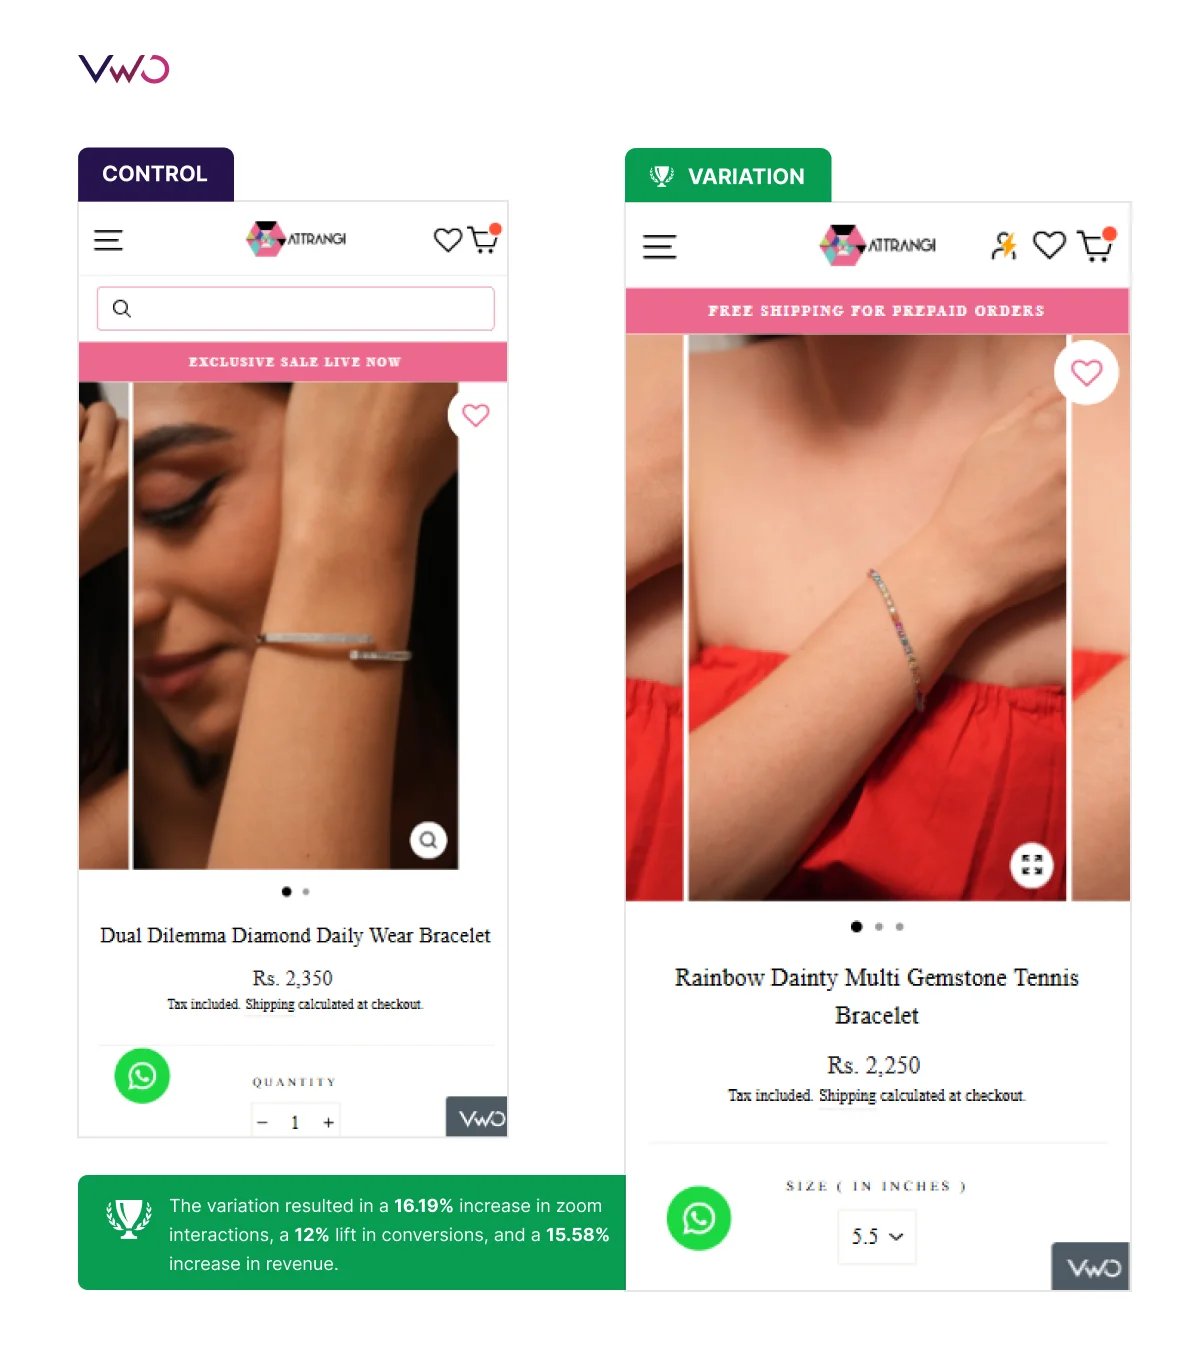
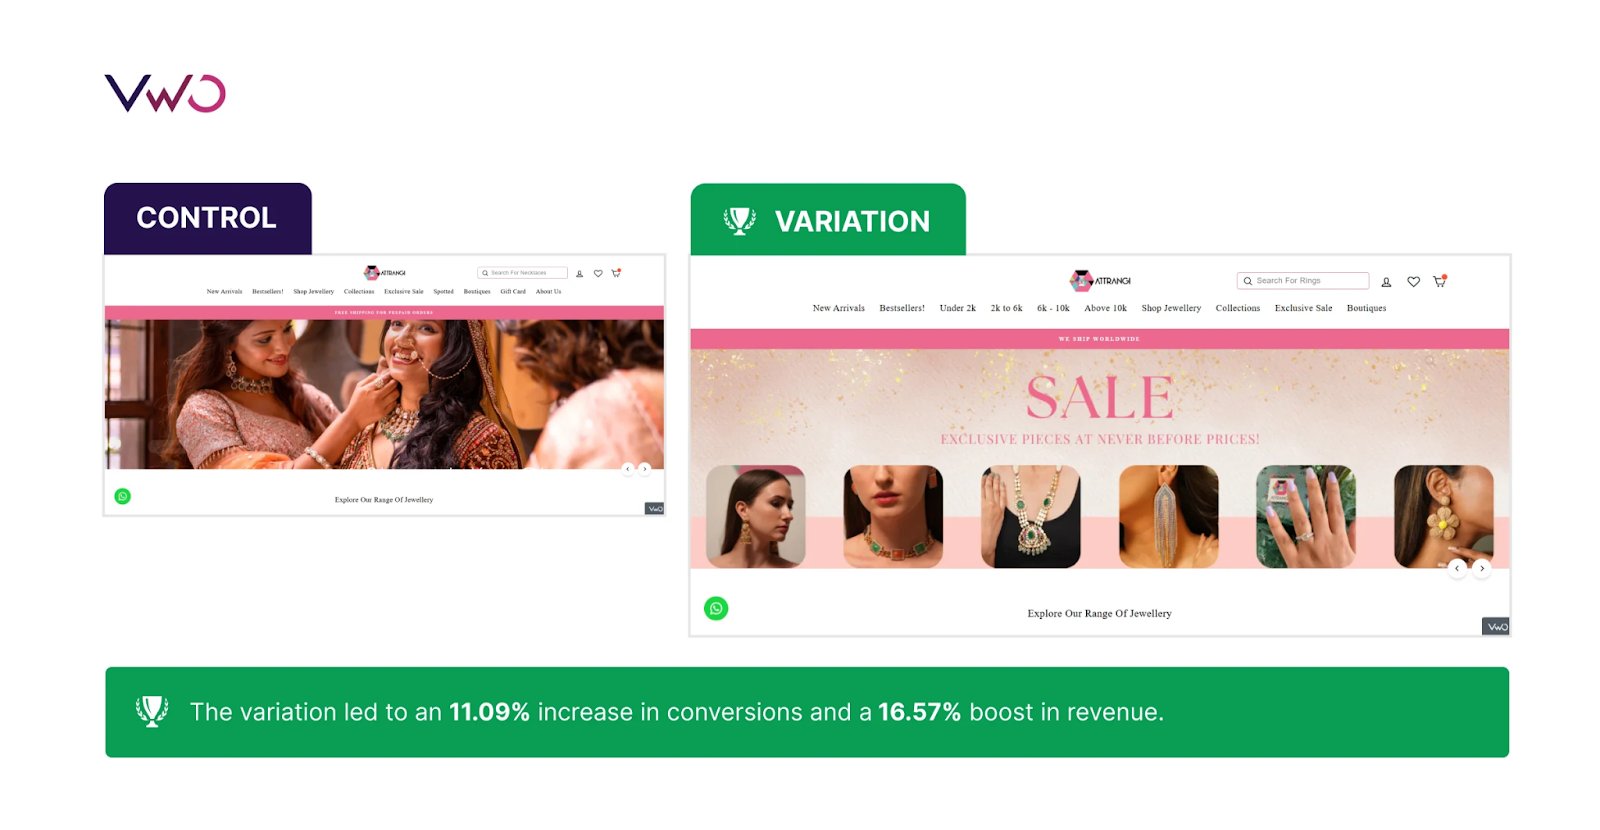
A real-world example:
Using VWO, Attrangi, a modern Indian fashion brand, tracked both high-impact metrics like revenue and conversion rate, as well as interaction-level actions such as zoom icon clicks and size guide usage. VWO’s intuitive setup made it easy to link each experiment to the right metrics, allowing the team to identify drop-off points, test targeted improvements across the mobile journey, and achieve a 50% increase in conversions and a 78.68% uplift in revenue. [Read the full success story here.]
Start your 30-day free trial and see how VWO helps you simplify, streamline, and scale your optimization efforts
FAQs
Tracking conversion metrics provides insights about campaign effectiveness, what’s working, where users drop off, and how to improve performance. It enables data-driven decisions, better resource allocation, and higher ROI.
Key metrics include conversion rate, CPA, CAC, CLV, ROAS, and funnel performance. The most important ones vary by business model, but all should align with defined goals.
Ideally, important conversion metrics should be monitored continuously and reviewed weekly or monthly, depending on campaign scale. Frequent analysis helps spot issues early and track progress against goals.
Conversion metrics focus on how effectively your digital efforts, like campaigns, landing pages, or website design, drive users to complete defined actions such as purchases, sign-ups, or downloads.
The main KPI for conversions is the conversion rate; it shows what portion of your website visitors take a specific action, such as making a purchase or signing up. Other KPIs include cost per conversion, revenue per visitor, and goal completion rate.
Yes. Short-term metrics like CTR and bounce rate guide quick campaign adjustments, while long-term metrics like CAC, CLV, and retention rate support strategic decision-making and growth planning.
Categories: