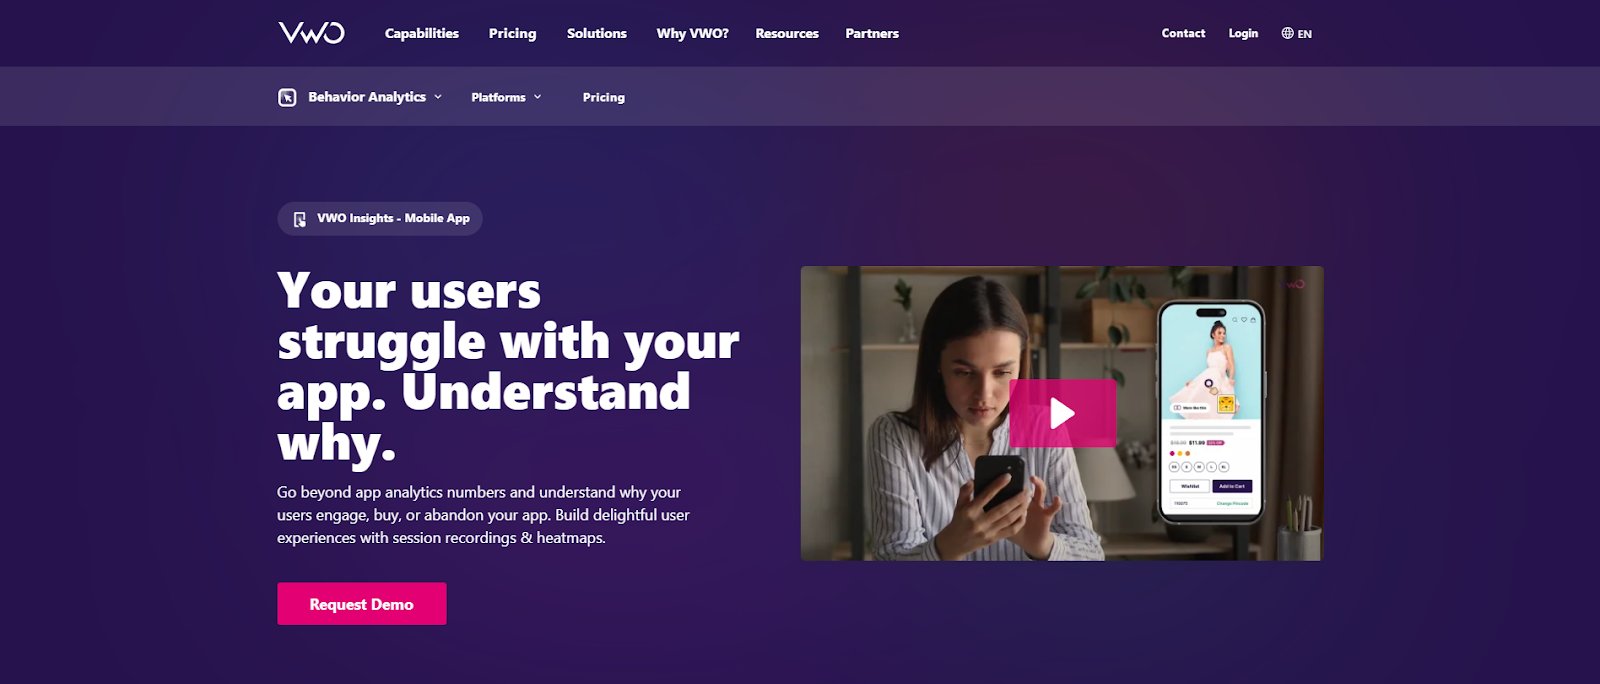
Go beyond app analytics numbers and understand why your users engage, buy, or abandon your app. Build delightful user experiences with session recordings & heatmaps.
Your app is live, downloads are rolling in, and users are signing up. But then—silence. Engagement drops, churn rises, and you’re left wondering: What went wrong?
The truth is, your app is only as good as the experience it delivers—and without the right insights, you’re flying blind. Are users abandoning the onboarding flow? Struggling with navigation? Encountering crashes?
With over 72% of online sales happening on mobile, every lost user means missed revenue. App analytics tools don’t just give you data; they reveal the “why” behind user behavior, helping you fine-tune performance, optimize conversions, and keep users coming back.
With countless analytics solutions out there, which one fits your needs best? We’ve done the legwork and rounded up five tools that are free to get started with—so you can jump in, uncover what’s working (and what’s not), and make smarter decisions without any upfront investment. Let’s dive in!
What are mobile app analytics tools?
Mobile app analytics tools track and analyze user interactions, app performance, and marketing effectiveness, helping businesses and developers understand where users click, which features they engage with, why they churn, and how campaigns perform. These tools provide real-time data, session tracking, conversion analysis, and in-app event monitoring, offering a clear view of the customer journey.
5 Best free mobile app analytics tools: Quick glimpse
Free trial: 30 days for the Zero and Growth plans. Free: For life, deep linking, and engagement features. Paid: Starts from 7 cents/conversion; 12K conversions in the first year.
Free: Countly Lite is free forever with limited features. Paid: The Flex plan is free for up to 1000 MAUs; the paid tier starts from $80/month.
Smartlook
Native Rendering Mode, Games Recording Mode, Easy Integration, Click Tracking
Free trial: 30 days on all plans. Free: Basic product analytics and 3000 monthly sessions. Paid: Starts from $55/month.
5 Top free mobile app analytics tools: Detailed review
Disclaimer: The pros and cons listed are based on reviews and feedback from third-party sites such as G2, TrustRadius, and other sources.
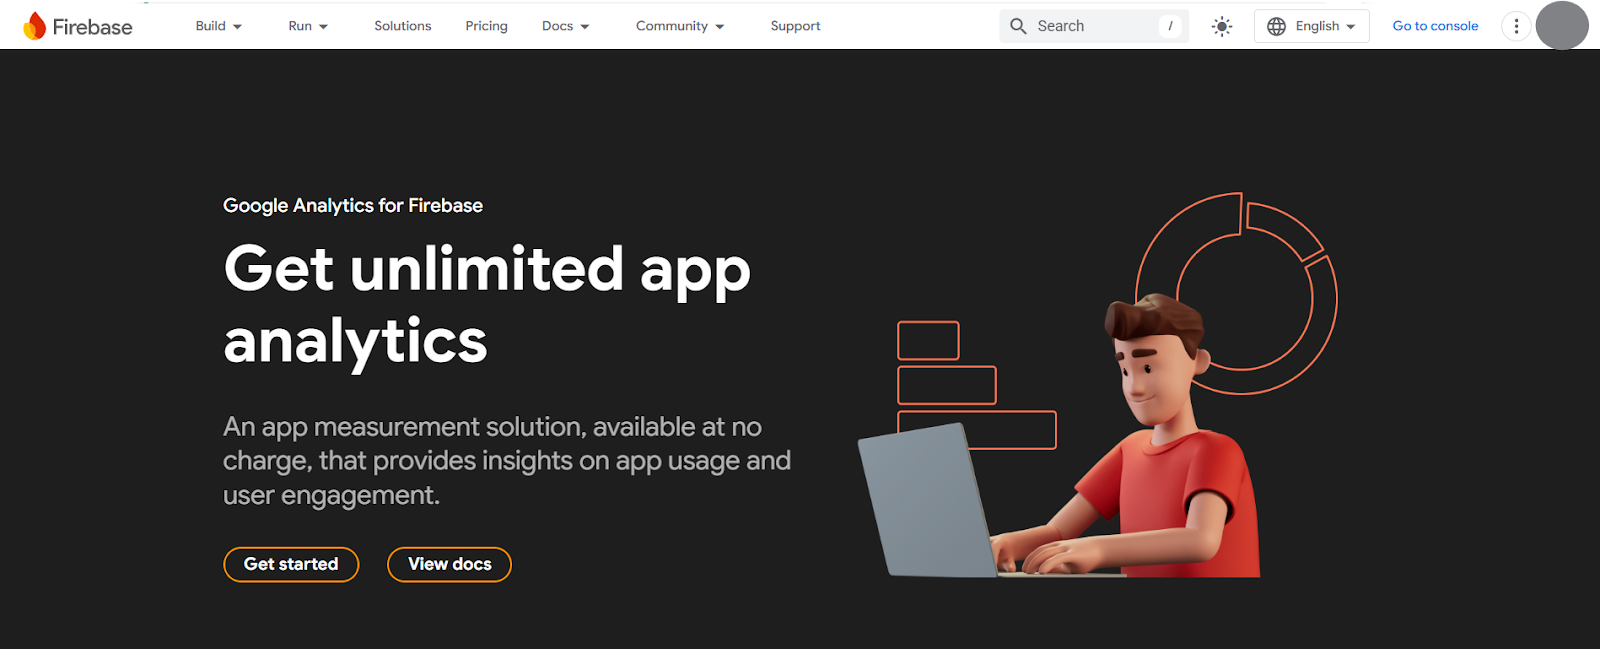
1. Firebase (Google Analytics)
Google Analytics for Firebase helps businesses track app usage and user engagement at no cost, offering unlimited reporting on up to 500 events. It automatically captures key user actions while allowing customization for deeper insights.
With real-time analytics, businesses can monitor live user behavior through StreamView and validate data with DebugView. Attribution tracking across multiple ad networks ensures better campaign measurement and optimization. It also provides seamless integration with BigQuery and Google Data Studio for advanced reporting.
Best features
Crash Reporting
Deep-Link Tracking
In-App Purchase Insights
Segmentation
Integrations
In-App Messaging
Pricing
It is free of cost for all.
Pros and cons
Pros
Cons
Simplifies app development by handling backend infrastructure, real-time data syncing, user authentication, and performance monitoring.
Real-time data may occasionally show inconsistencies.
Scalable and cross-platform, with a serverless approach that adapts to app growth while ensuring consistency across iOS, Android, and the web.
Advanced analytics features are limited compared to specialized platforms.
A customer experience as per G2 reviews:
Google Cloud is one of the most reliable cloud hosting provider, I have been using it for the past 2 years and so far I did not face any issues. Mostly I use Google Cloud Virtual Machine with Static IP, they charge for the ingress and egress charges through that IP Address, the configuration I choose for the VM comes under always free tier and I don’t have to may anything for the VM.
Bishal D. Founder and CTO
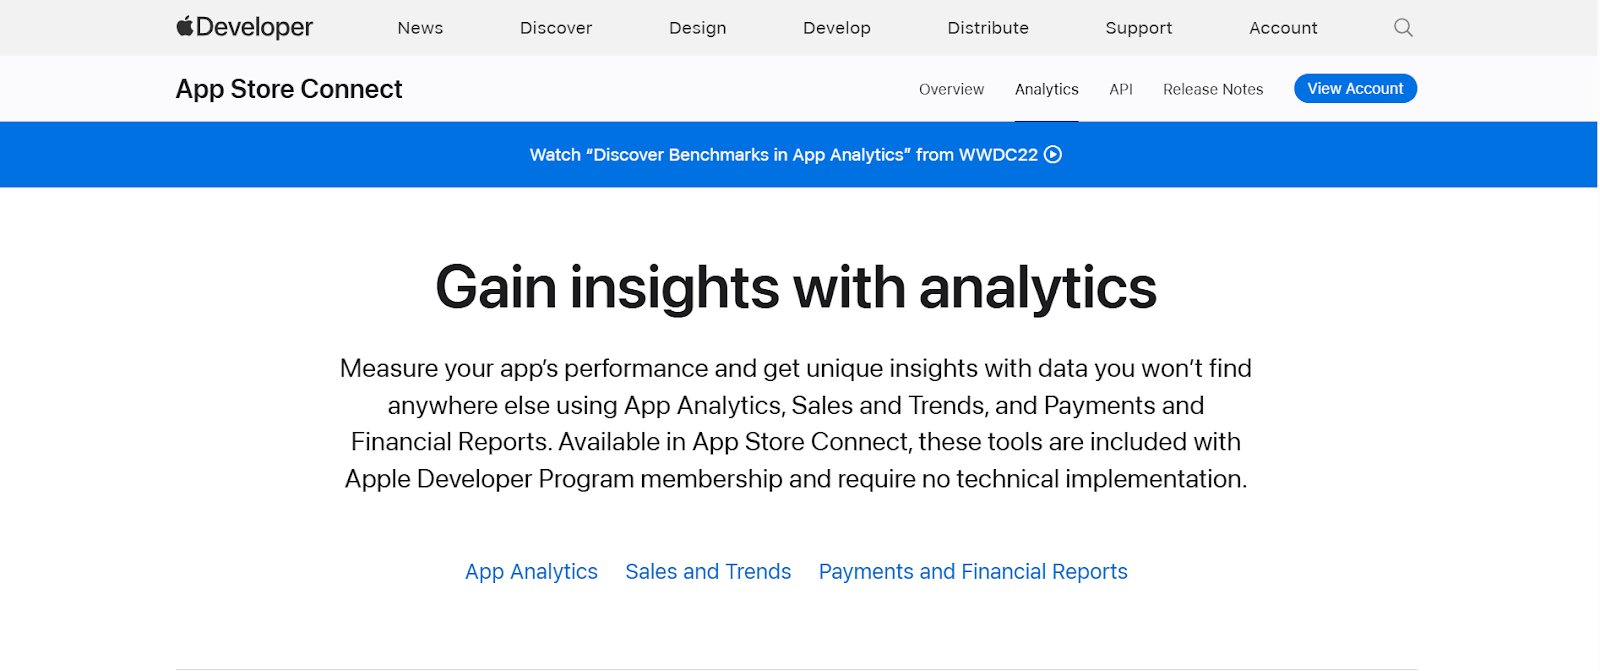
2. Apple App Analytics
Apple App Analytics, available in App Store Connect, provides iOS developers with data-driven insights to track app performance, user engagement, and marketing campaign impact. Included with the Apple Developer Program membership, it requires no technical setup, making it easy to monitor app visibility, downloads, retention, revenue, and campaigns.
The App Engagement and Usage feature helps app developers to understand user interactions by tracking installations, sessions, active devices, and crash data. By identifying engagement trends and drop-off points, they can optimize onboarding, enhance features, and improve retention, driving long-term app success on the App Store.
Best features
App Store Performance
View Paying Users
App Clip Performance
In-App Event Performance
Peer Group Benchmarks
Sales & Trends Reports
Subscription Activity
Business Performance
Payments & Financial Reports
Pricing
It is free for all members of the Apple Developer Program.
Pros and cons
Pros
Cons
Provides detailed insights into app performance and user behavior.
Limited to Apple/iOS apps; not compatible with other platforms.
3. AppsFlyer
AppsFlyer is a leading mobile app analytics and attribution platform that helps businesses optimize mobile marketing and performance, drive user engagement, and maximize revenue.
It provides real-time reporting, cross-channel insights, and advanced attribution modeling, enabling marketers to understand user behavior, improve retention, and drive conversions. With fraud protection technology ensuring data accuracy and a unified analytics suite simplifying complex metrics, AppsFlyer empowers businesses to make informed decisions, maximize ROI, and achieve sustainable growth.
Best features
Overview Dashboard
Cohort Reports
Retention Reports
Incrementality Dashboard
Custom Dashboards
Measurement Suite
Creative Optimization
Audience Segmentation
Pricing
Free trial: 30 days for the Zero and Growth plans.
Free: For life- 12K conversions in the first year, marketing analytics tools, 30-day access to a few premium add-ons, deep linking, and basic reports.
Paid: Starts from 7 cents/conversion; 12K conversions in the first year.
Pros and cons
Pros
Cons
Robust attribution tech stack with flexible UI for custom and saved dashboards covering various use cases.
Navigation can be challenging at times, and pricing could be more competitive.
OneLinks and adaptive deferred deep linking for seamless user experience and tracking.
Data download restrictions allow only 90 days of data at a time.
A customer experience as per G2 reviews:
What I like best about AppsFlyer is the reliable, real-time attribution across all our marketing channels. It gives us a clear, unified view of performance, helping us make smarter decisions and allocate budget more effectively.
The granularity of data is also incredibly helpful — we can drill down into cohorts, events, and revenue by source, which is key for a subscription-based app like Emma.
On top of that, their partner integrations and deep linking are seamless, and their customer support has been consistently responsive and knowledgeable.
Giuliano Maria F. Sr. Growth Marketing Manager
4. Countly
Countly is a product analytics platform that empowers teams to track product performance, customer behavior, and user journeys across mobile, web, and desktop applications.
With real-time crash analytics, Countly helps detect and fix issues instantly for a seamless user experience. Its granular data access and segmentation enable data-driven decisions, refined engagement strategies, and improved product design. By integrating the Countly SDK, businesses can instantly leverage real-time insights to enhance app performance and user satisfaction.
Best features
Push NotificationsDashboards
Cohorts
Funnels
Heatmaps
Retention
Surveys
Performance Monitoring
Pricing
Free: Countly Lite is free forever with limited features, including a mobile app and session analytics.
Paid: Extensive features start with the Flex plan, which is free for up to 1000 MAUs; the paid tier starts from $80/month.
Pros and cons
Pros
Cons
Round-the-clock analytics access, enabling clients to monitor insights anytime.
Lacks omnichannel capabilities despite being a web and mobile analytics tool.
Extensive feature set, consolidating key mobile ecosystem metrics in one dashboard.
Complex queries can be challenging to process, and occasional data loss due to system crashes is reported.
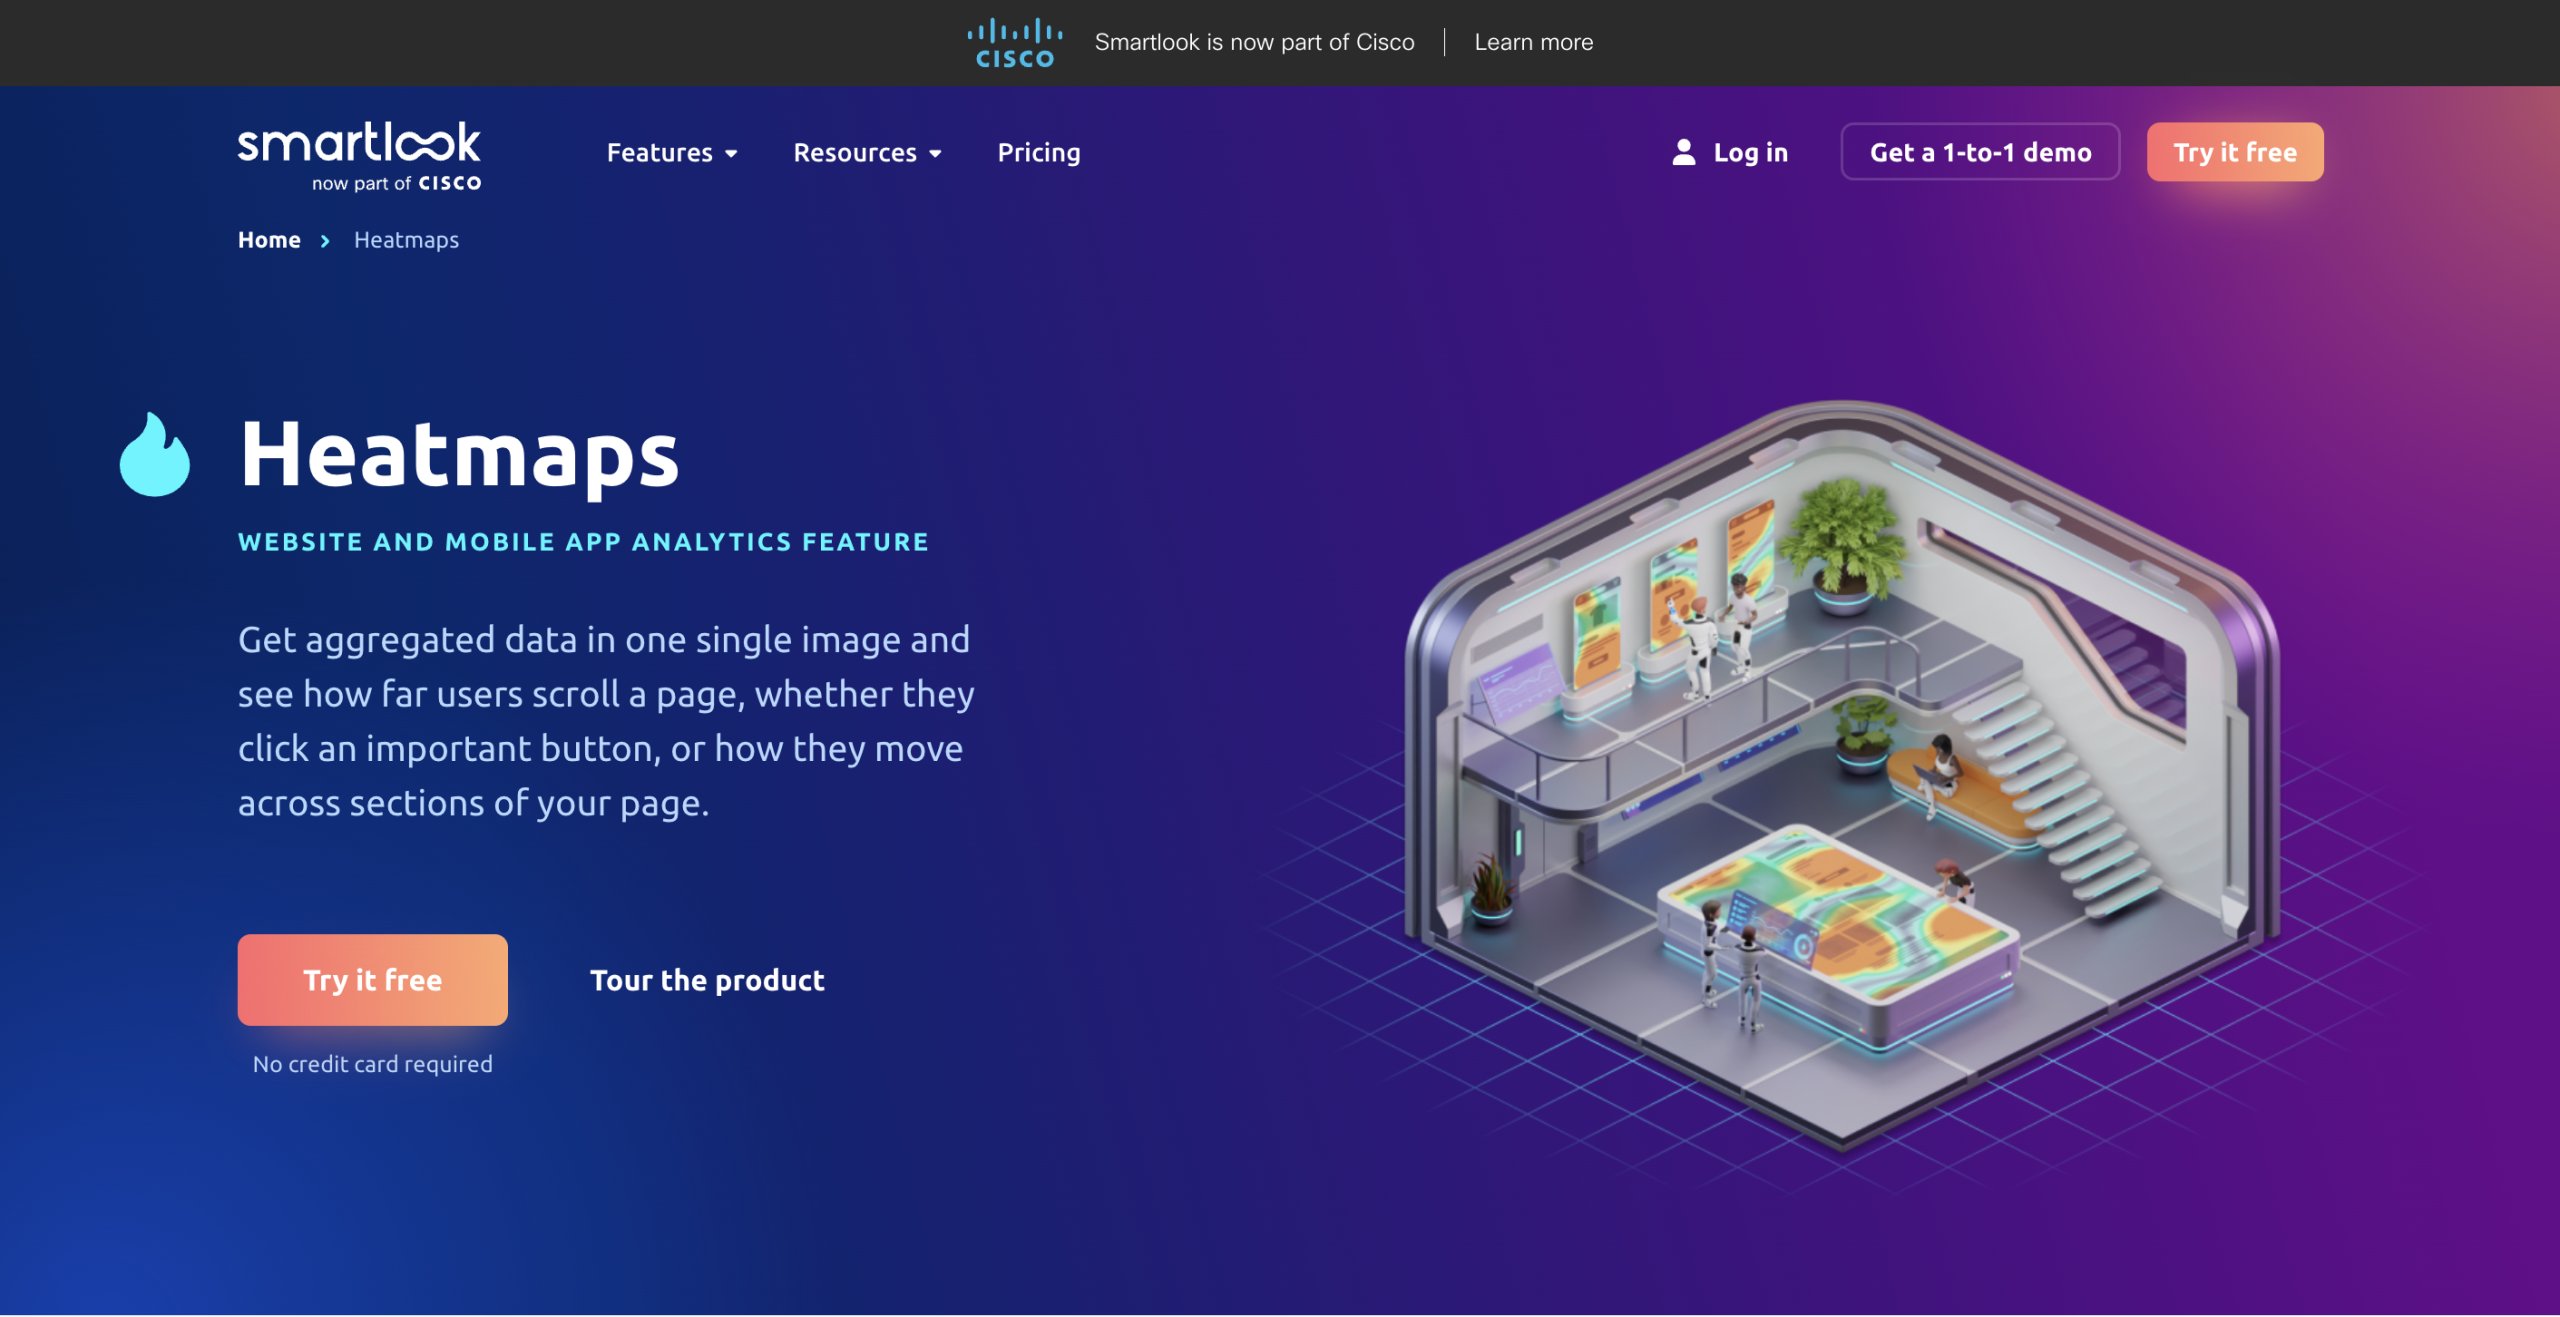
5. Smartlook
Smartlook offers a mobile app analytics platform that tracks user engagement, acquisition, and performance across iOS, Android, and major frameworks. Its lightweight SDK ensures seamless insights without affecting app performance.
Smartlook captures real user interactions with session recordings, helping businesses analyze engagement and troubleshoot issues while ensuring privacy with wireframe mode. It also offers event tracking for real-time insights, funnels to map conversion paths, heatmaps for interaction analysis, and crash reports linking errors to session data for faster debugging.
Best features
Native Rendering Mode
Games Recording Mode
Easy Integration
Click Tracking
Pricing
Free trial: 30 days on all plans.
Free: Basic product analytics, historical heatmap data, and 3000 monthly sessions with one-month retention.
Paid: Advanced features start from $55/month.
Pros and cons
Pros
Cons
In-depth visitor recordings provide valuable insights into user behavior for improving the user experience.
Limited tracking history to one month on the free plan.
Full-screen capture with tagging and comments helps developers identify and resolve issues efficiently.
The platform lacks a bulk search feature based on user IDs.
A customer experience as per G2 reviews:
It is currently used in the organization’s marketing, design, and web development areas to see how users interact with our websites and mobile apps. So far, there are no issues. It is an excellent tool for user analytics and real-time experience understanding; through this tool, we can view real-time recordings of user sessions, track events, gather contextual information, and much more. An implicit advantage of Smartlook is its ease of use; implementation is simple and does not require specialized technical knowledge, making it accessible to teams of all sizes. Moreover, it also supports various platforms such as websites, mobile apps, and desktop applications.
Sumant R. Software Engineer
Why are mobile app analytics important?
To understand the importance of mobile app analytics, let’s consider an example. Imagine ShopEase, an e-commerce app experiencing high drop-off rates, a decline in daily active users, and low average order value. Mobile analytics show that users struggle with navigation, abandon carts, and encounter checkout crashes.
Without mobile app analytics, diagnosing the reasons behind the underperforming metrics would be challenging. By leveraging mobile analytics, ShopEase gains actionable insights, optimizes the app, and improves both user experience and key app metrics. Here’s how:
1. Enhancing user experience
ShopEase discovers through session recordings and heatmaps that users struggle to find product categories. A redesigned navigation layout makes browsing easier, increasing click-through to the app’s product screen by 20%.
2. Boosting retention & engagement
Funnel analysis and cohort reports reveal that many first-time users leave without returning to the app. By introducing personalized push notifications and loyalty rewards, ShopEase saw a 30% increase in repeat visits.
3. Optimizing marketing efforts
Attribution tracking shows that some ad campaigns bring more engaged users than others. By reallocating ad spending to the most effective channels, ShopEase improved its return on ad spending (ROAS) by 40%.
4. Increasing app revenue
Metrics revealed a rise in cart abandonment, prompting further investigation. Session recordings identified crashes during checkout, showing exactly where users dropped off. With crash reports and performance monitoring, the issue was quickly diagnosed and resolved, leading to a 25% increase in completed transactions.
With mobile app analytics, ShopEase turns friction points into opportunities, enhancing user experience, refining marketing strategies, and driving business growth. Whether it’s identifying usability issues, optimizing retention, or fixing technical problems, mobile analytics can provide the data-driven insights necessary for success in a competitive mobile landscape.
Which free mobile app analytics tool will you choose?
Choosing the right free mobile app analytics tool depends entirely on your specific needs and priorities. Different tools offer various features, and the best fit for your app will depend on what insights you need and how you plan to use them. Here are some key factors to consider:
User behavior tracking – If understanding user interactions, engagement patterns, and drop-off points is a priority, look for a tool that offers session recordings, heatmaps, and funnel analysis.
Attribution & marketing analytics – If measuring ad campaign effectiveness and user acquisition is essential, choose a platform with attribution tracking, real-time campaign insights, and audience segmentation.
Performance monitoring – If app stability and performance are your main concerns, opt for a tool that provides crash reports, error tracking, and load time analysis.
Privacy & compliance – If your app deals with sensitive user data, select a tool with built-in privacy features, data masking, and compliance with regulations like GDPR and CCPA.
Integration & scalability – If you need seamless integration with other tools or plan to scale, ensure the platform supports cross-platform tracking, API access, and compatibility with cloud databases.
Before making a decision, it’s essential to evaluate the features that align with your business goals, app type, and data collection needs. While many free tools provide valuable insights, some come with limitations on data retention, reporting depth, or advanced analytics, making it important to choose a solution that supports your long-term growth.
If you’re looking for a mobile app analytics tool that not only tracks user behavior but also delivers actionable insights and testing capabilities, VWO is a solution worth exploring.
VWO for mobile app analytics and testing
VWO provides powerful mobile app analytics that help businesses understand user behavior and identify friction points in apps. But it doesn’t stop at analytics; VWO enables teams to test, experiment, and optimize app experiences. By combining behavioral insights with testing, businesses can validate changes, improve usability, and drive higher engagement and conversions with confidence.
VWO Insights
Understanding how users interact with your app is crucial for delivering a seamless experience. Behavior analytics plays a key role in tracking and analyzing user actions, providing insights into what drives engagement, frustration, or drop-offs.
1. Session recordings: Capture user interactions, scrolls, swipes, taps, and navigation flows, helping businesses uncover usability issues and engagement bottlenecks.
They reveal friction points leading to app abandonment, streamline issue resolution by eliminating guesswork, and enhance UX research with real user insights. By sharing session data, teams can collaborate more effectively and make data-driven product improvements.
2. Heatmaps: Track where users tap on the screen to identify areas of high and low engagement. They help businesses understand user attention, optimize CTA placements, and identify UI clutter that may hinder engagement.
Insights from heatmaps support hypothesis testing for redesigns, helping businesses enhance conversions, improve retention, and create a more seamless in-app experience.
3. Funnel analysis: Identify drop-off points to understand barriers to conversion, whether it’s an unclear call to action, a slow-loading screen, or a confusing checkout process. By analyzing user journeys, businesses can reduce churn, optimize experiences, and drive app growth.
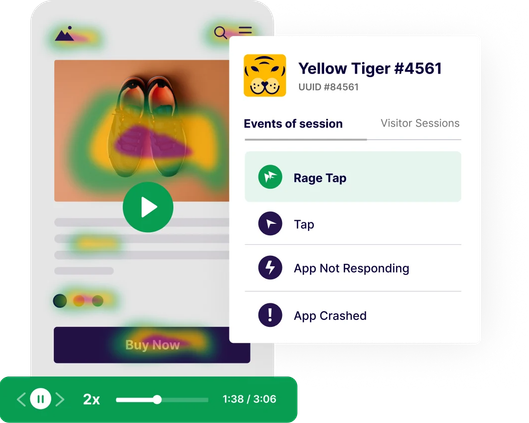
Pro Tip!
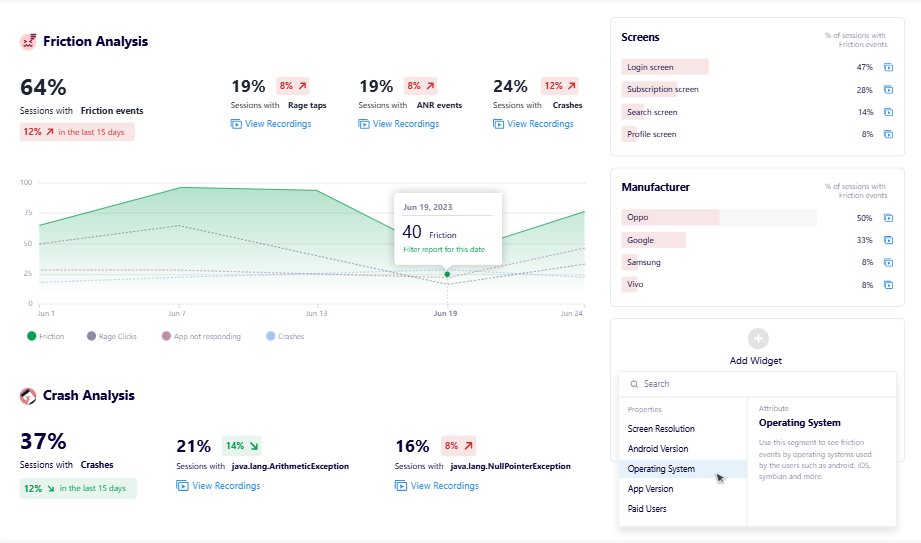
Filter sessions by crashes, rage taps, or ANRs to instantly surface friction points and streamline issue resolution.
VWO Insights – Mobile app dashboard overview
VWO’s Mobile App Insights Dashboard provides a unified view of user friction, highlighting crashes, ANRs, and rage taps across sessions and user segments. With one-click access to session recordings, teams can quickly identify, prioritize, and resolve issues. The dashboard also offers user segmentation-specific insights and crash analysis, helping businesses track trends, diagnose problems, and optimize app performance efficiently.
VWO Mobile App Testing
Insights from user behavior analytics further help teams identify friction points and form data-backed hypotheses for their next A/B test. With VWO Mobile App Testing, you can then experiment with everything from UI changes like CTAs and banners to server-side logic and in-app algorithms—all aimed at improving engagement, retention, and conversions.
Let’s take a hypothetical example of a food delivery app that notices a higher-than-expected drop-off rate at checkout. Despite offering discounts and a seamless order process, many users may be abandoning their carts before completing their orders. To improve conversions, the team might turn to VWO’s mobile app analytics for insights.
Using heatmaps and session recordings, they may discover that users hesitate on the payment screen, often tapping repeatedly on the “Apply Coupon” button, possibly leading to rage taps or leaving the app, perhaps to search for discounts. Funnel analysis could indicate a spike in drop-offs at this stage, suggesting friction in the checkout experience.
To address this, the team might run an A/B test using VWO:
Variation A: Introduces an “Apply Best Coupon” feature that automatically selects the highest discount, showing exactly how much you saved.
Variation B: This shows all available discounts right on the checkout page with the savings amount for each, letting you pick one with a single tap instead of entering coupon codes.
After two weeks, the results may reveal:
Variation A leads to a 28% increase in completed transactions, as users appreciate the automated discount feature.
Variation B improves engagement but results in a slightly lower boost in conversions (12%).
With these data-backed insights, the team may choose to implement Variation A, simplifying the discount process and potentially reducing cart abandonment.
This approach isn’t just about checkout optimization; it’s about understanding user behavior, testing possible solutions, and making informed decisions. By leveraging VWO’s app analytics and experimentation tools, app owners can transform the checkout experience into a frictionless, high-converting process.
We’re spending more and more time on improving our user experience to cater to mobile-first customers. We plan to use VWO to observe mobile visitors, identify conversion leaks, and enhance customer journeys.
Jon Corwin Director of Growth Marketing at One Click Ventures
VWO enables teams to eliminate guesswork, optimize user experiences, and improve business outcomes, all through a single, integrated platform designed for data-driven mobile app growth. Take the 30-day free trial today and explore how VWO can transform your app’s performance!
FAQs
Q1. What is Mobile App Analytics?
Mobile app analytics refers to the process of tracking, measuring, and analyzing user behavior and engagement to optimize user experience and business outcomes.
Q2. What are app analytics?
App analytics involve collecting and analyzing data on user behavior, engagement, retention, and app performance to improve functionality and user experience.
Q3. Why is App Analytics important?
App analytics helps businesses understand user interactions, improve retention, optimize marketing efforts, and enhance app experience by providing data-driven insights.
Q4. What are Mobile App Analytics tools?
These are software platforms that track user activity, conversions, and marketing attribution, helping businesses make informed decisions.
Q5. What are the best app analytics tools?
The best tools depend on your needs, whether it’s user behavior tracking, marketing attribution, crash reporting, or real-time analytics. Choosing the right tool requires evaluating your business goals and data requirements.
Q6. Which tool is often used for in-app analytics?
Various tools provide in-app analytics, depending on your needs. Look for solutions that offer session recordings, heatmaps, event tracking, and funnel analysis to gain insights into user interactions.
Q7. Are app analytics free?
Some platforms offer free versions with limited features, while advanced analytics, extended data retention, and premium insights usually require paid plans.
Q8. How do you use Mobile App Analytics tools?
Most tools require integrating an SDK into your app, after which you can track key metrics, set up event tracking, analyze user journeys, monitor app performance, and optimize based on insights.
Q9. How to check traffic on an app?
Apps don’t receive “traffic” like websites do. Instead, you can monitor user engagement through analytics platforms that track active users, session counts, screen views, and interaction patterns within your mobile app.
I've worked as a writer and editor in the B2B SaaS space for over 6 years. I read and write on all things CRO and experience optimization.
I'm a chai fanatic and a paranoid parent. When I'm not copyediting or working on marketing projects, I love to spend my time reading. Besides B2B content, my passion lies in modern, behavioral astrology. I'm a dreamer and wish to write stories for children someday :)
Uncover hidden visitor insights to improve their website journey
One of our representatives will get in touch with you shortly.
Awesome! Your meeting is confirmed for at
Thank you, for sharing your details.
, you're all set to experience the VWO demo.
I can't wait to meet you on at
Account Executive
, thank you for sharing the details. Your dedicated VWO representative, will be in touch shortly to set up a time for this demo.
We're satisfied and glad we picked VWO. We're getting the ROI from our experiments.
Christoffer Kjellberg
CRO Manager
VWO has been so helpful in our optimization efforts. Testing opportunities are endless and it has allowed us to easily identify, set up, and run multiple tests at a time.
Elizabeth Levitan
Digital Optimization Specialist
As the project manager for our experimentation process, I love how the functionality of VWO allows us to get up and going quickly but also gives us the flexibility to be more complex with our testing.
Tara Rowe
Marketing Technology Manager
You don't need a website development background to make VWO work for you. The VWO support team is amazing
Elizabeth Romanski
Consumer Marketing & Analytics Manager


![10 Best Enterprise Analytics Platforms [2026]: Expert Picks with Reviews and Comparisons](https://static.wingify.com/gcp/uploads/sites/3/2025/08/Feature-image-10-Best-Enterprise-Analytics-Platforms_-In-Depth-Reviews-and-Comparisons.jpg?tr=h-600)