Calculadora de significancia estadística para pruebas A/B
¿Vas a realizar una prueba A/B test? Calcula la significancia de tus resultados con nuestra calculadora bayesiana, diseñada para equipos que optimizan con datos: experimentación, CRO y UX.
Descubre la lógica de VWO Testing
Agendar llamada- Automatiza la significancia y crea tests fiables
- Explora parámetros estadísticos avanzados como ROPE, MDR y FPR
- Profundiza en Sequential Testing, Corrección de Bonferroni y Fixed Horizon Tests.
P-Value
(Desde 0-1)0.334
Significancia
No
¿Qué es la significancia estadística?
La significancia estadística indica si un resultado se debe al azar o a un cambio real. Usa esta calculadora para interpretar tus resultados con confianza y tomar decisiones más inteligentes para optimizar tu página web.
Diferentes enfoques para calcular la significancia estadística
Los dos métodos más utilizados son el frecuentista y el bayesiano, que impulsan distintos tipos de calculadoras de estadística de prueba. A continuación, una breve descripción de cada uno.
Frecuentista
La estadística frecuentista analiza la frecuencia con la que ocurren los eventos. Se centra en cuántas veces sucede algo en una situación determinada.
Bayesiano
La estadística bayesiana consiste en ajustar tus creencias según la evidencia. Parte de una creencia inicial (prior) basada en experiencia o conocimiento previo. Luego, incorpora nueva información para confirmarla o cuestionarla, y actualiza esa creencia según los datos obtenidos.
¿Cómo calculamos la significancia estadística?
Así es como puedes calcular la significancia estadística utilizando los enfoques frecuentista y bayesiano.
Enfoque frecuentista
El enfoque frecuentista para determinar la significancia estadística se basa en el valor p. Para determinar el valor p utilizando este enfoque, necesitarás la siguiente información clave:
- La diferencia media entre las dos hipótesis
- La desviación estándar de la diferencia entre las dos hipótesis
- El tamaño de muestra de cada hipótesis
Una vez que hayas recopilado estos datos necesarios, puedes calcular fácilmente el valor p utilizando una herramienta de prueba de significancia o una calculadora de nivel de significancia. Si el valor p obtenido es 0,05, la probabilidad de la variación es del 5 %.

Enfoque bayesiano
En este enfoque, el cálculo de la significancia estadística se realiza mediante la probabilidad posterior. La probabilidad posterior considera los datos disponibles y representa la probabilidad de que la hipótesis A o B sea verdadera. Este enfoque tiene en cuenta tanto las creencias previas como la evidencia observada en los datos.
Para calcular la probabilidad posterior se utiliza el teorema de Bayes. El teorema de Bayes es una fórmula matemática que combina la probabilidad previa de una hipótesis con la probabilidad de los datos para obtener la probabilidad posterior o actualizada.
Una probabilidad posterior superior al 95 % se considera una fuerte evidencia a favor de la hipótesis.
Conoce más sobre nuestro enfoque bayesiano en la serie de artículos que hemos creado sobre pruebas A/B bayesianas en VWO.

¿Por qué usamos estadística bayesiana?
Informes de tests intuitivos
En VWO reconocemos que los usuarios sin formación estadística suelen interpretar erróneamente el valor p frecuentista como una probabilidad posterior bayesiana, lo que lleva a conclusiones incorrectas sobre la superioridad de una variación frente a otra. Para resolver este problema, desarrollamos el primer motor estadístico bayesiano de la industria.
Nuestro motor estadístico bayesiano ofrece resultados fáciles de comprender, eliminando el riesgo de cometer errores al realizar pruebas A/B relacionadas con los ingresos u otros indicadores clave (KPI). Al adoptar un enfoque más intuitivo, garantizamos que nuestros usuarios obtengan conclusiones precisas con nuestra calculadora de significancia estadística.
Con nuestra solución, puedes confiar en la significancia estadística de tus resultados y tomar decisiones informadas para optimizar tus pruebas, aumentar los ingresos y mejorar la experiencia general del usuario. Di adiós a las interpretaciones erróneas y aprovecha el poder de la calculadora bayesiana de pruebas A/B para obtener resultados fiables y accionables.

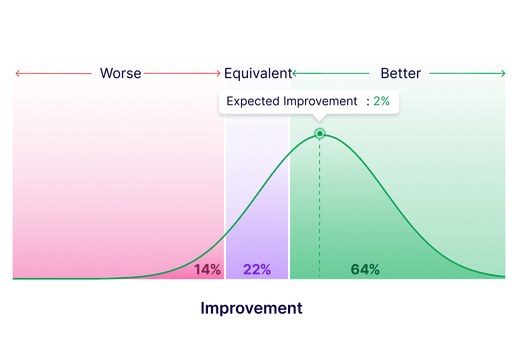
Comparaciones claras con la línea base
Identifica si las variaciones superan, igualan o tienen un rendimiento inferior a la línea base con nuestro motor estadístico avanzado. Los resultados se muestran con un umbral de probabilidad del 95 %. Los gráficos detallados ofrecen una visión clara para tomar decisiones rápidas y con fundamento.
Resultados procesables, más rápidos
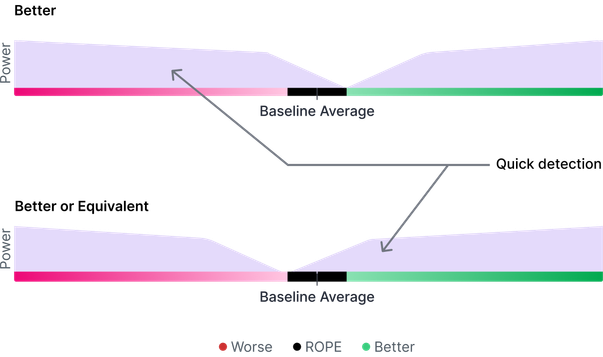
VWO ofrece dos objetivos de prueba: “Mejor” y “Mejor o Equivalente”, ambos basados en el principio ROPE (Región de Equivalencia Práctica), que ofrece una potencia asimétrica en los tests.
El objetivo “Mejor” te ayuda a identificar rápidamente las variaciones con bajo rendimiento, acelerando las evaluaciones y la implementación de cambios exitosos.
El objetivo “Mejor o Equivalente” ofrece resultados más rápidos cuando buscas una mejora o un rendimiento estable respecto a la línea base.
Preguntas frecuentes
La hipótesis nula establece que no existe diferencia entre el control y la variación. Esto significa que la tasa de conversión de la variación será similar a la tasa de conversión del control.
El valor p se define como la probabilidad de obtener resultados al menos tan extremos como los observados, teniendo en cuenta que la hipótesis nula es correcta (siendo la hipótesis nula en A/B testing la idea de que la variación y el control son lo mismo).
La significancia estadística cuantifica si un resultado obtenido se debe probablemente al azar o es fruto de un factor relevante. Cuando se establece que un descubrimiento es estadísticamente significativo, esto quiere decir que puedes tener la certeza de que la diferencia es real, y no que simplemente tuviste suerte (o mala suerte) a la hora de escoger la muestra.
El poder estadístico es la probabilidad de detectar un efecto cuando dicho efecto es real. Por lo tanto, un poder estadístico del 80 % significa que de 100 tests en los que las variaciones son diferentes, hay 20 en los que las variaciones son lo mismo y, como consecuencia, no existe efecto.


