
Statistischer Signifikanzrechner für A/B-Tests
Planen Sie einen A/B test? Ermitteln Sie die Signifikanz Ihrer Ergebnisse mit unserem bayesianischen Rechner – entwickelt für datengetriebenes Experimentieren, Conversion-Optimierung und UX-Verbesserung.
Blicken Sie hinter die Kulissen von VWO-Testing
Gespräch buchen- Signifikanz automatisieren & verlässliche Tests durchführen
- Erweiterte Parameter wie ROPE, MDR und FPR entdecken
- Deep Dive: Sequential Testing, Bonferroni-Korrektur & Fixed Horizon Test
P-Value
(Bereich von 0-1)0.334
Bedeutung
Nein
Was bedeutet statistische Signifikanz?
Statistische Signifikanz zeigt, ob ein Ergebnis auf Zufall oder auf einen echten Effekt zurückzuführen ist. Mit unserem Rechner bewerten Sie Ihre Ergebnisse sicher, treffen datenbasierte Entscheidungen und optimieren Ihre Tests gezielt.
Verschiedene Ansätze zur Berechnung statistischer Signifikanz
Die beiden am häufigsten verwendeten Ansätze sind der frequentistische und der Bayessche, die jeweils unterschiedliche Teststatistik-Rechner nutzen. Hier finden Sie eine kurze Übersicht.
Frequentistisch
Die frequentistische Statistik betrachtet, wie oft ein Ereignis eintritt. Sie analysiert die Häufigkeit, mit der etwas in einer bestimmten Situation passiert.
Bayessch
Die Bayessche Statistik basiert darauf, Überzeugungen auf Grundlage neuer Daten anzupassen. Sie beginnt mit einer anfänglichen Annahme (dem Prior), die auf Erfahrung oder Fachwissen beruht. Anschließend werden Daten gesammelt, um diese Annahme zu bestätigen oder zu widerlegen. Nach der Auswertung wird die Annahme anhand der neuen Erkenntnisse aktualisiert.
Wie berechnen wir die statistische Signifikanz?
So können Sie die statistische Signifikanz mit den frequentistischen und Bayes’schen Ansatz berechnen.
Frequentistischer Ansatz
Der frequentistische Ansatz zur Bestimmung der statistischen Signifikanz basiert auf dem p-Wert. Um den p-Wert mithilfe des frequentistischen Ansatzes zu bestimmen, benötigen Sie die folgenden wichtigen Informationen:
- Die mittlere Differenz zwischen den beiden Hypothesen
- Die Standardabweichung der Differenz zwischen den beiden Hypothesen
- Die Stichprobengröße jeder Hypothese
Sobald Sie diese erforderlichen Daten gesammelt haben, können Sie den p-Wert einfach mit einem Signifikanztest-Tool oder einem Signifikanzrechner berechnen. Wenn der p-Wert 0,05 beträgt, liegt die Wahrscheinlichkeit der Variation bei 5 %.

Bayes’scher Ansatz
Hier erfolgt die Berechnung der statistischen Signifikanz über die Posterior-Wahrscheinlichkeit. Diese berücksichtigt die verfügbaren Daten und beschreibt die Wahrscheinlichkeit, dass Hypothese A oder B zutrifft. Der Ansatz bezieht sowohl frühere Annahmen (Prior) als auch die beobachteten Daten ein.
Zur Berechnung der Posterior-Wahrscheinlichkeit wird das Bayes-Theorem verwendet – eine mathematische Formel, die die Prior-Wahrscheinlichkeit einer Hypothese mit der Wahrscheinlichkeit der Daten kombiniert, um die aktualisierte oder Posterior-Wahrscheinlichkeit abzuleiten.
Eine Posterior-Wahrscheinlichkeit von über 95% gilt als starker Hinweis zugunsten der Hypothese.
Erfahren Sie mehr über unseren Bayes-Ansatz in unserer Artikelreihe zum Bayes-basierten A/B-Testing bei VWO.

Warum setzen wir auf Bayes’sche Statistik?
Intuitive Testberichte
Bei VWO wissen wir, dass viele User ohne Statistikkenntnisse den frequentistischen p-Wert oft mit einer Bayes’schen Posterior-Wahrscheinlichkeit verwechseln. Das führt schnell zu falschen Schlüssen darüber, welche Variante wirklich besser ist. Um das zu vermeiden, haben wir die erste Bayes’sche Statistik-Engine der Branche entwickelt.
Unsere Bayes’sche Statistik-Engine liefert leicht verständliche Ergebnisse und minimiert das Risiko von Fehlern bei A/B-Tests, die auf Umsatz oder andere wichtige KPIs abzielen. Mit diesem intuitiveren Ansatz stellen wir sicher, dass unsere User verlässliche Insights aus unserem A/B-Test-Signifikanzrechner gewinnen.
Mit unserer Lösung können Sie der statistischen Signifikanz Ihrer Ergebnisse vertrauen und fundierte Entscheidungen treffen, um Tests, Umsatz und das gesamte User Experience zu optimieren. Verabschieden Sie sich von Fehlinterpretationen – und nutzen Sie die Vorteile des Bayes’schen A/B-Test-Rechners für zuverlässige, umsetzbare Ergebnisse.

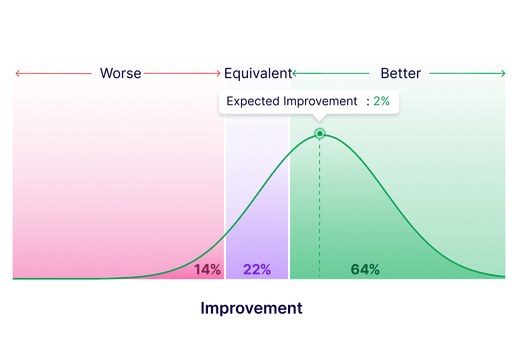
Klare Vergleiche mit dem Basiswert
Erkennen Sie mit unserer fortschrittlichen Statistik-Engine, ob Varianten besser, gleichwertig oder schlechter als der Basiswert abschneiden. Ergebnisse werden bei einer Wahrscheinlichkeit von 95 % angezeigt. Detaillierte Diagramme liefern klare Insights für schnelle, fundierte Entscheidungen.
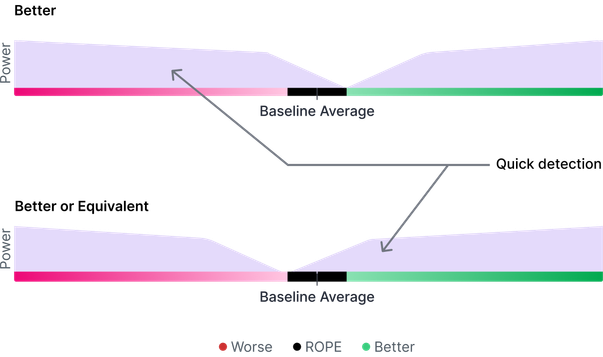
Kommen Sie schneller an umsetzbare Resultate
VWO bietet zwei Testziele – „Besser“ und „Besser oder Gleichwertig“ – basierend auf dem ROPE-Prinzip (Region of Practical Equivalence), das asymmetrische Teststärke ermöglicht.
Das Ziel „Besser“ hilft Ihnen, leistungsschwächere Varianten schnell zu erkennen. So können Sie erfolgreiche Änderungen schneller umsetzen.
Das Ziel „Besser oder Gleichwertig“ liefert schnellere Ergebnisse, wenn Sie eine Verbesserung oder eine gleichbleibende Performance im Vergleich zum Basiswert nachweisen möchten.
Häufig gestellte Fragen
Die Nullhypothese gibt an, dass zwischen der Kontrolle und der Variation kein Unterschied besteht. Das bedeutet im Prinzip, dass die Konversionsrate der Variation ähnlich sein wird wie die Konversionsrate der Kontrolle.
Der P-Wert ist definiert als die Wahrscheinlichkeit, ein mindestens so extremes Ergebnis wie die beobachteten zu erhalten, vorausgesetzt, die Nullhypothese ist korrekt, wobei die Variante und Kontrolle bei der Nullhypothese beim A/B-Testing gleich sind.
Die statistische Signifikanz misst, ob ein erhaltenes Ergebnis aufgrund einer Möglichkeit oder einer interessanten Tatsache wahrscheinlich ist. Wenn ein Ergebnis signifikant ist, bedeutet das im Prinzip, dass man darauf vertrauen kann, dass eine Differenz real ist (und man nicht einfach nur Glück oder Pech bei der Auswahl des Beispiels hatte).
Die statistische Trennschärfe ist die Wahrscheinlichkeit, eine Folge zu finden, wenn die Folge real ist. Eine statistische Trennschärfe von 80 % bedeutet also, dass bei 100 Tests mit unterschiedlichen Variationen 20 Tests zu dem Schluss kommen werden, dass die Variationen gleich sind und keine Folge existiert.


