Uncover hidden visitor insights to improve their website journey
Understand the obstacles visitors encounter, pinpoint their most engaging touch points, and analyze their actions on your website to identify areas for improvement, resulting in enhanced experiences and increased conversions.
Behind every data point is a story—a frustrated customer, a satisfied client, or a game-changing idea.
As businesses shift to customer-centric models, understanding qualitative data is non-negotiable. Organizations must not only collect data but also interpret it with empathy and precision.
Qualitative data analysis is no longer about manual coding or hours of highlighting transcripts. Today’s tools extract insights from unstructured data faster, smarter, and more efficiently.
They turn scattered narratives into actionable insights, empowering businesses to make informed decisions with confidence. Explore our guide to the top tools that will take your analysis to the next level.
What are qualitative data analysis tools?
Qualitative data analysis tools help researchers systematically analyze non-numeric data such as text, audio, video, and images. These tools assist in organizing, coding, and interpreting qualitative data to identify patterns, themes, and meaningful insights from complex information.
The primary functions include:
Data organization and management
Coding and categorization of content
Advanced search and retrieval capabilities
Visualization of relationships between different data elements
They enable researchers to apply systematic approaches to analyzing interviews, focus groups, observations, documents, and other qualitative materials.
Top qualitative data analysis tools: Quick summary
Top 8 Qualitative data analysis tools: A comparison table
Sr no.
Tool name
Capabilities
Free trial
Starting price
1
NVivo
Data organization (text, audio, video, images), coding & categorization, AI-powered autocoding, data visualization, research transparency
14-day free trial
$118/month (billed annually)
2
ATLAS.ti
Data management, manual & AI-powered coding, thematic analysis, conversational AI, data visualization, querying & reporting
5-day free trial
$10/month (per user)
3
MAXQDA
AI integration, versatile data import, coding & categorization, memo tools, text search & auto coding, visual text exploration
14-day free trial
$535/year (Business pricing)
4
Dedoose
Qualitative & mixed-methods support, media support, cloud-based, interactive visualizations and analytics, support inter-rater reliability
30-day free trial
$17.95/month
5
QDA Miner
Data organization, codebook creation and management, on-screen text coding and advanced assistance, statistical & visualization tools, geotagging & time tagging
14-day free trial
$595/year
6
Quirkos
Text analyzer, visualization tools (bubble interface, word clouds), real-time collaboration, cloud syncing, side-by-side comparison
14-day free trial
$5/month
7
Raven’s Eye
Advanced text analysis, group & individual insights, panoramic wisdom, customizable input, big data technology, automated data processing
No free trial
$39.95/month
8
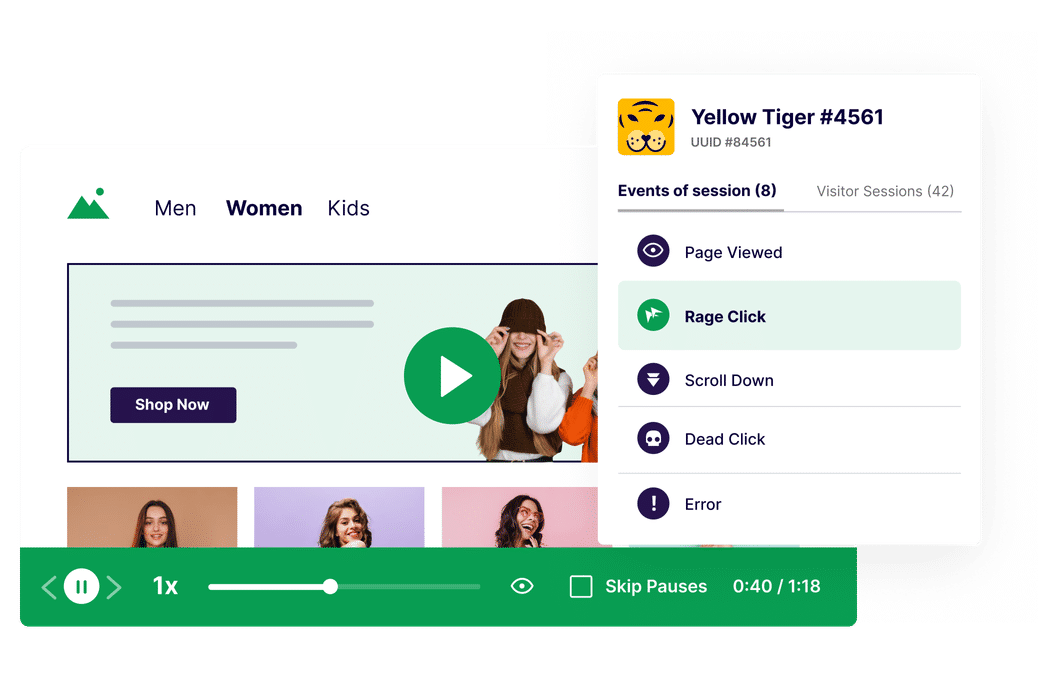
VWO
Open-ended surveys, AI-generated summaries, heatmaps, clickmaps, session recordings, form analytics
30-day free trial
Custom pricing
8 Top qualitative data analysis tools
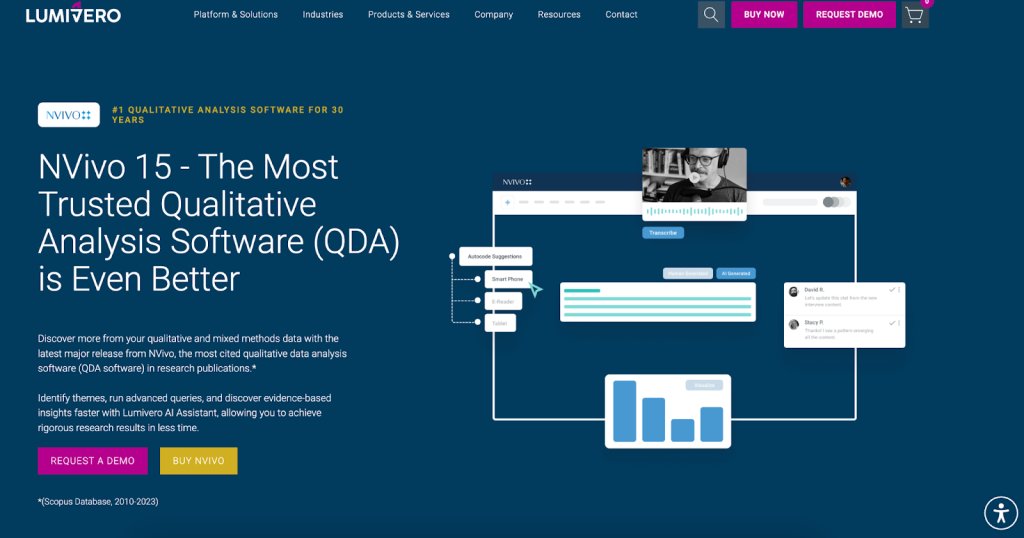
1. NVivo
Top Qualitative Data Analysis Tools | 1. Nvivo
NVivo is a qualitative data analysis (QDA) software developed by QSR International. It is widely recognized for its ability to help researchers organize, analyze, and find insights in unstructured or qualitative data such as interviews, focus groups, surveys, videos, and social media content.
Features
Data organization: NVivo supports diverse data formats such as text, audio, video, images, and social media imports via NCapture.
Coding and categorization: Facilitates systematic coding and thematic analysis, enabling researchers to tag data and identify trends.
Data visualization: Provides tools to create charts, graphs, mind maps, word clouds, and query visualizations for in-depth analysis.
Transparency in research: Facilitates transparent research through memos, maps, and query documentation, demonstrating the evolution of findings and methodologies.
Automated insights with AI: Features autocoding powered by AI to quickly organize structured data and extract themes.
Integration: Seamlessly integrates with other tools.
Pros
Cons
Allows users to organize data in multiple formats, such as text, audio, video, and images
Considered expensive compared to other options available in the market
Offers charts, graphs, and diagrams that aid in presenting and understanding complex data patterns
Lack of direct customer support options
Suitable for both individual researchers and large teams
Pricing
Free trial: Offers a 14-day free trial
Paid plan: Starts at $118 per month (billed annually)
A customer experience as per G2 reviews:
It helps me become a more efficient social science researcher by storing different types of qualitative data in one place, and making it easy to create multiple subgroups.
Weixin L. Criminal Appellate Practice Student Attorney
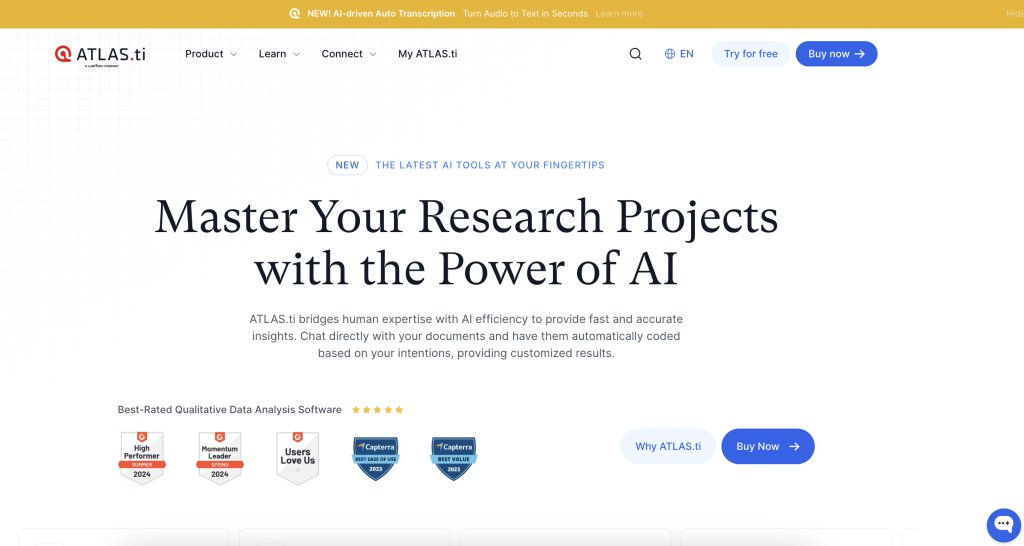
2. ATLAS.ti
ATLAS.ti is a qualitative data analysis software designed to facilitate coding, organization, and interpretation of unstructured or qualitative data. It is widely used in academic, market research, and policy-making fields to explore complex datasets, identify patterns, and derive meaningful insights.
Features
Data management: Supports diverse data types such as text, audio, video, images, and survey responses.
Coding tools: Provides intuitive manual coding as well as AI-powered autocoding to streamline data tagging and theme identification.
Thematic analysis: Helps researchers identify recurring themes and patterns within qualitative datasets.
Conversational AI: You can chat with documents and auto-code insights based on your research goals.
Data visualization: Offers tools like word clouds, code co-occurrence networks, and concept maps to help visualize data relationships.
Querying and reporting: Advanced tools to query data for specific patterns and generate detailed reports.
Pros
Cons
Easy to navigate, even for beginners, with helpful online resources and support
Lacks customizable graphs (e.g., pie/bar charts) directly in the software
Fast insights through AI-driven coding
Occasional performance issues with large datasets
Seamless project transfer between Web, Windows, and Mac
Pricing
Free trial: Offers a 5-day free trial
Paid plan: Starts at $10 per month (per user)
A customer experience as per G2 reviews:
I use ATLAS.ti for helping me conducting coding analysis and of course for quantitative analysis from the coding result. Its help me a lot, efficient, and safe my time!
Frensen S. Researcher (UX and HCI)
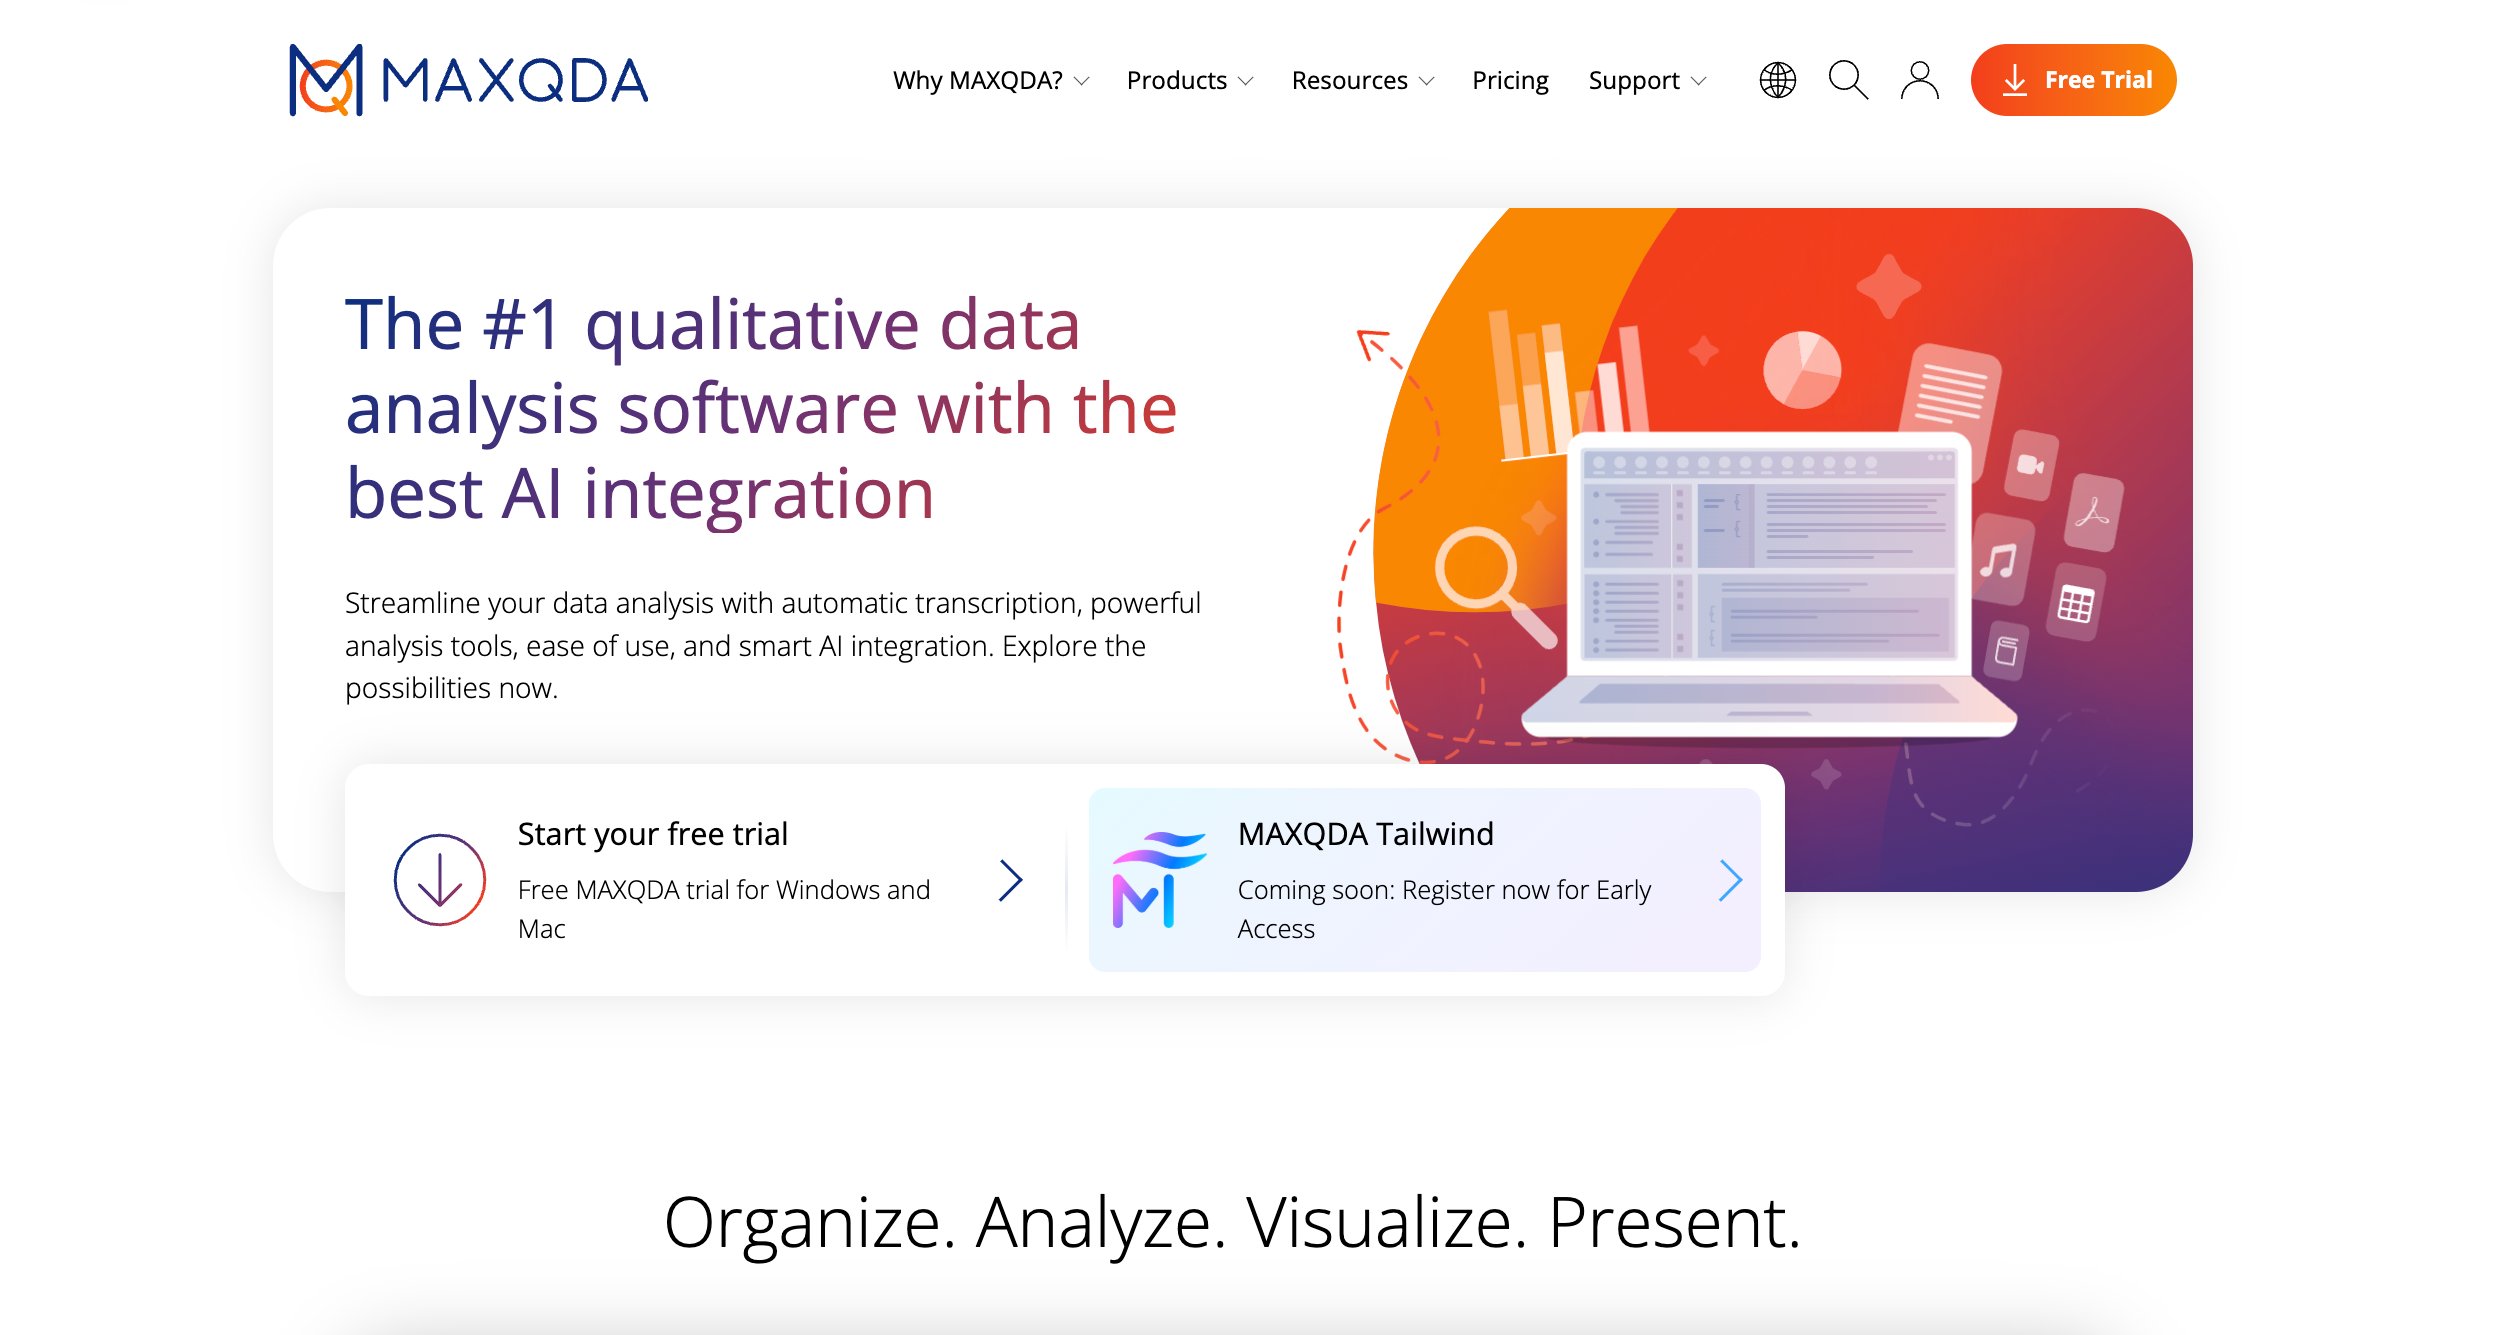
3. MAXQDA
MAXQDA is a software tool designed for qualitative and mixed methods data analysis. Widely used by researchers, analysts, and academics, it offers an extensive suite of features to help users manage, analyze, and interpret complex data from a variety of sources.
Features
AI integration: MAXQDA leverages AI for qualitative data analysis, including automatic transcription of audio and video recordings in multiple languages.
Versatile data import: It supports importing various data types such as text, audio, video, surveys, social media content, PDFs, Word documents, Excel files, and note-taking apps.
Coding and categorization tools: It provides tools to code and organize data using colors, symbols, emoticons, and easy drag-and-drop functionalities. It also allows for automatic coding of keywords.
Memo tools: Researchers can create, link, and organize memos for insights, research questions, and paraphrased passages. Memos can be attached to texts, images, audio/video clips, and codes, and easily accessed via the memo manager.
Text search and auto-coding: The text search tools enable users to explore documents, search for keywords, and automatically code them
Visual text exploration: The Interactive Wordtree feature visualizes word combinations and frequencies in the text, offering unique insights and patterns.
Pros
Cons
Useful visualization tools and coding features, including creative coding, summary grids, and MaxMaps for data organization
It is costly, which can be a barrier to wider adoption
Supports a wide range of document formats and offers excellent PDF reader/editor tools for coding and retrieval
Cannot be used collaboratively in real time, and file corruption issues may arise when shared
Free YouTube tutorials and helpful instructions for beginners
Pricing
Free trial: Offers a 14-day free trial
Paid plan: Business pricing starts at $535 per year
A customer experience as per G2 reviews:
MAXQDA is easy to navigate. I like the overall platform and presentation. Especially, I like that the main screen is easily customizable and can be easily modified depending on what I want to see and what I need. Furthermore, I like the ease with which I can retrieve specific quotes and segments from our dataset. This feature is particularly helpful when completing reports. In addition, MAXQDA rarely gets overwhelming. I also like the different levels of codes which facilitates the organization, especially with larger files and datasets.
Germain D. Senior Project Specialist
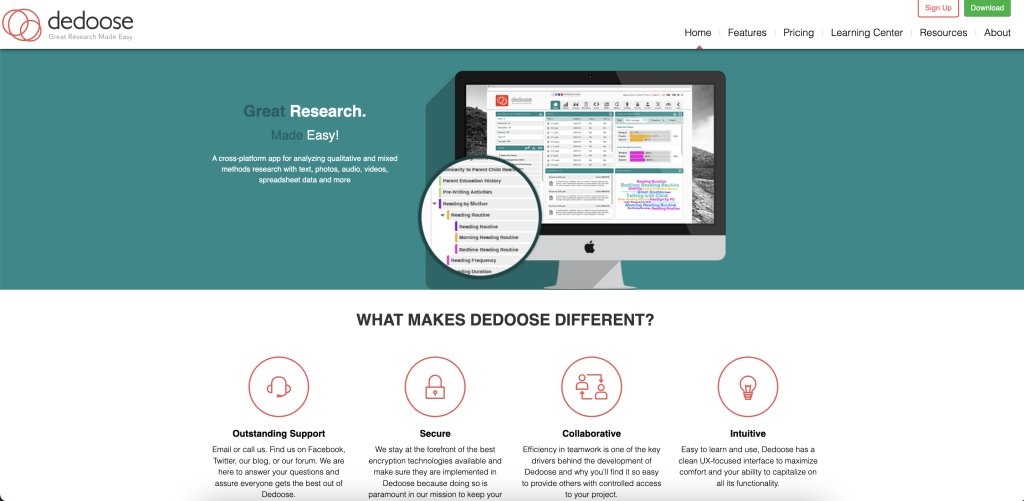
4. Dedoose
Dedoose is a cloud-based software designed for analyzing qualitative and mixed-methods data. With a focus on providing robust tools for both qualitative and quantitative research, it is widely used by academics, researchers, and professionals in various fields.
Features
Qualitative and mixed methods support: Dedoose supports qualitative data management, excerpting/coding, and analysis, as well as integration with demographics, surveys, and test scores for mixed methods analysis.
Comprehensive media support: It allows importing and analyzing various media types, including documents, images, audio, video, and spreadsheets, to integrate qualitative and quantitative data.
Cloud-based: It is accessible from any computer, with no IT requirements and compliance with high data security standards.
Interactive visualizations and analytics: Dedoose includes interactive charts, tables, and plots to explore qualitative and quantitative data.
Open import/export migration: It supports importing and exporting data with no lock-in, allowing for migration from other softwares
Built off of real science: The software supports inter-rater reliability, code weight/rating systems for mixed methods analysis, and a memo system for transparency in data analysis.
Pros
Cons
Allows multiple users to work on the same project simultaneously, making it ideal for collaborative research
Several users have experienced poor customer service, with slow response times
Offers an excellent feature for setting up tests for interrater reliability
Occasional problems with system crashes, especially when handling large datasets
Useful for focus group transcription analysis
Pricing
Free trial: Offers a 30-day free trial
Paid plan: Pricing starts at $17.95 per month
A customer experience as per G2 reviews:
I like how multiple users can be working on the same project. This software makes it so easy to code and analyze qualitative data.
Kaitlyn B. Patient Relations Representative
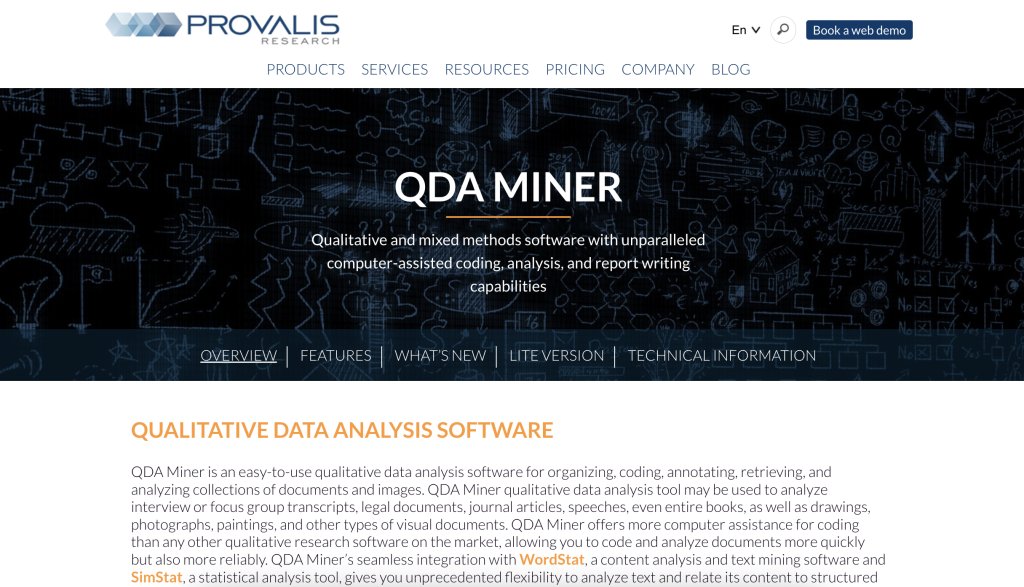
5. QDA Miner
QDA Miner is an intuitive qualitative data analysis software designed for organizing, coding, annotating, retrieving, and analyzing collections of documents and images. It stands out for its advanced computer assistance in coding, allowing faster and more reliable document processing. The tool integrates statistical and visualization features, making it one of the most powerful mixed-methods qualitative software solutions available.
Features
Multiple import options: Enables easy import of documents from various formats and data from sources like Excel, CSV, SPSS, Stata, social media, emails, and web surveys.
Organize and manage data: Simplifies organizing data with options to group, label, and sort documents, assign variables manually or automatically, and filter cases based on variable values.
Codebook creation and management: Streamlines the creation and management of codebooks, allowing you to assign colors, memos, and keywords to codes, and import dictionaries from WordStat for easy transformation into codes.
On-screen text coding: Facilitates intuitive coding of text and images with a drag-and-drop interface and grid view for efficient coding of open-ended questions.
Advanced coding assistance: Provides tools for faster coding, including keyword retrieval, section retrieval, query-by-example, cluster extraction, code similarity search, and date/location extraction.
Statistical and visualization tools: Enhances analysis with interactive word clouds, frequency tables, heatmaps, and advanced statistical tools for cluster analysis, correspondence analysis, and Chi-square tests.
Geotagging and time tagging: Supports geospatial and time-tagging by associating geographic and time coordinates with coded text segments, and displaying events on interactive maps or timelines.
Pros
Cons
It is user-friendly and accessible for both novice and experienced researchers
Absence of a video/audio analysis interface
Provides an option for a permanent, non-expiring license
Does not offer cloud-based collaboration
Provides step-by-step instructional videos and detailed support resources
Pricing
Free trial: It offers a 14-day free trial
Paid plan: Starts at $595 per year
A customer experience as per G2 reviews:
The intuitive design makes it easy for both novice and experienced researchers to navigate and use the software effectively.
Abhishek H. Senior Software Engineer
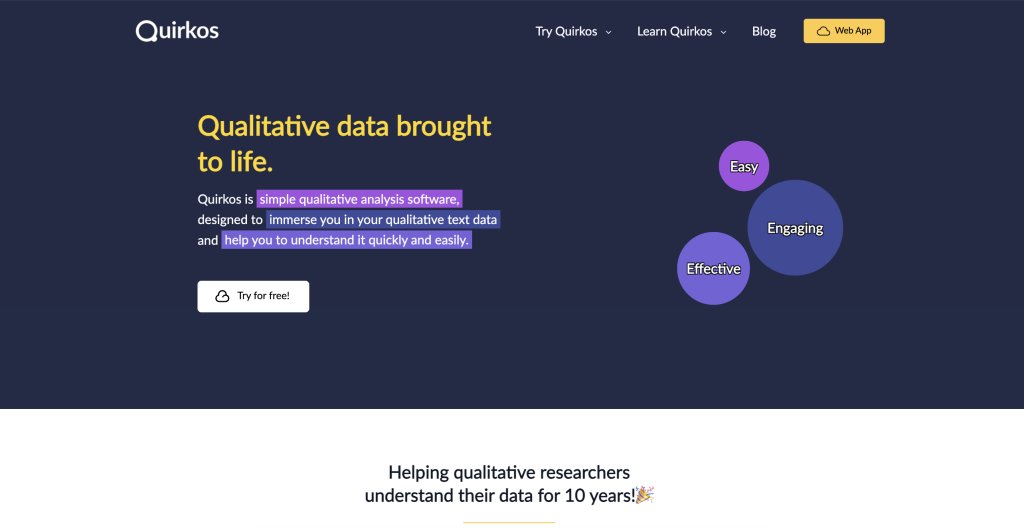
6. Quirkos
Quirkos is a qualitative data analysis tool that simplifies the coding and visualization process. Ideal for beginners, it offers a user-friendly interface and colorful visualizations that make working with qualitative data engaging and accessible.
Features
Text analyzer: Quirkos’ text analyzer identifies common keywords within text documents, helping in the quick identification of key themes and insights.
Visualization tools: It helps visualize customer insights and trends using an interactive bubble interface and word cloud clustering for frequently used terms.
Simplified interface: Designed for ease of use, it features a straightforward interface that allows even those with minimal data analysis experience to work confidently with qualitative data.
Project collaboration: Facilitates efficient team collaboration with real-time project sharing, live chat, and secure cloud syncing to keep everyone on the same page.
Cloud and device accessibility: Quirkos cloud provides unlimited storage and access across devices, including desktops, tablets, and smartphones.
Side-by-side comparison views: You can compare feedback from different audience groups, such as demographics or geographic locations.
Pros
Cons
Offers competitive pricing plans, including a free trial and affordable monthly subscriptions
Lacks some advanced functionalities, like in-depth statistical analysis or AI-powered insights
Provides colorful and interactive visualizations, such as Word Clouds and Word Trees, to help users easily identify patterns, themes, and keywords in qualitative data
It may not perform as efficiently with extensive or highly complex datasets
Quirkos Cloud ensures data is automatically synced and securely stored, reducing the risk of data loss
Pricing
Free trial: It offers a 14-day free trial
Paid plan: Starts at $5/month
A customer experience as per G2 reviews:
Simple software for visualizing our thematic search process and identifying categories within our textual data. It does not require complex training for its use and maintains a minimalist interface, ideal for quick qualitative analysis.
Lorenzo S. Maestro
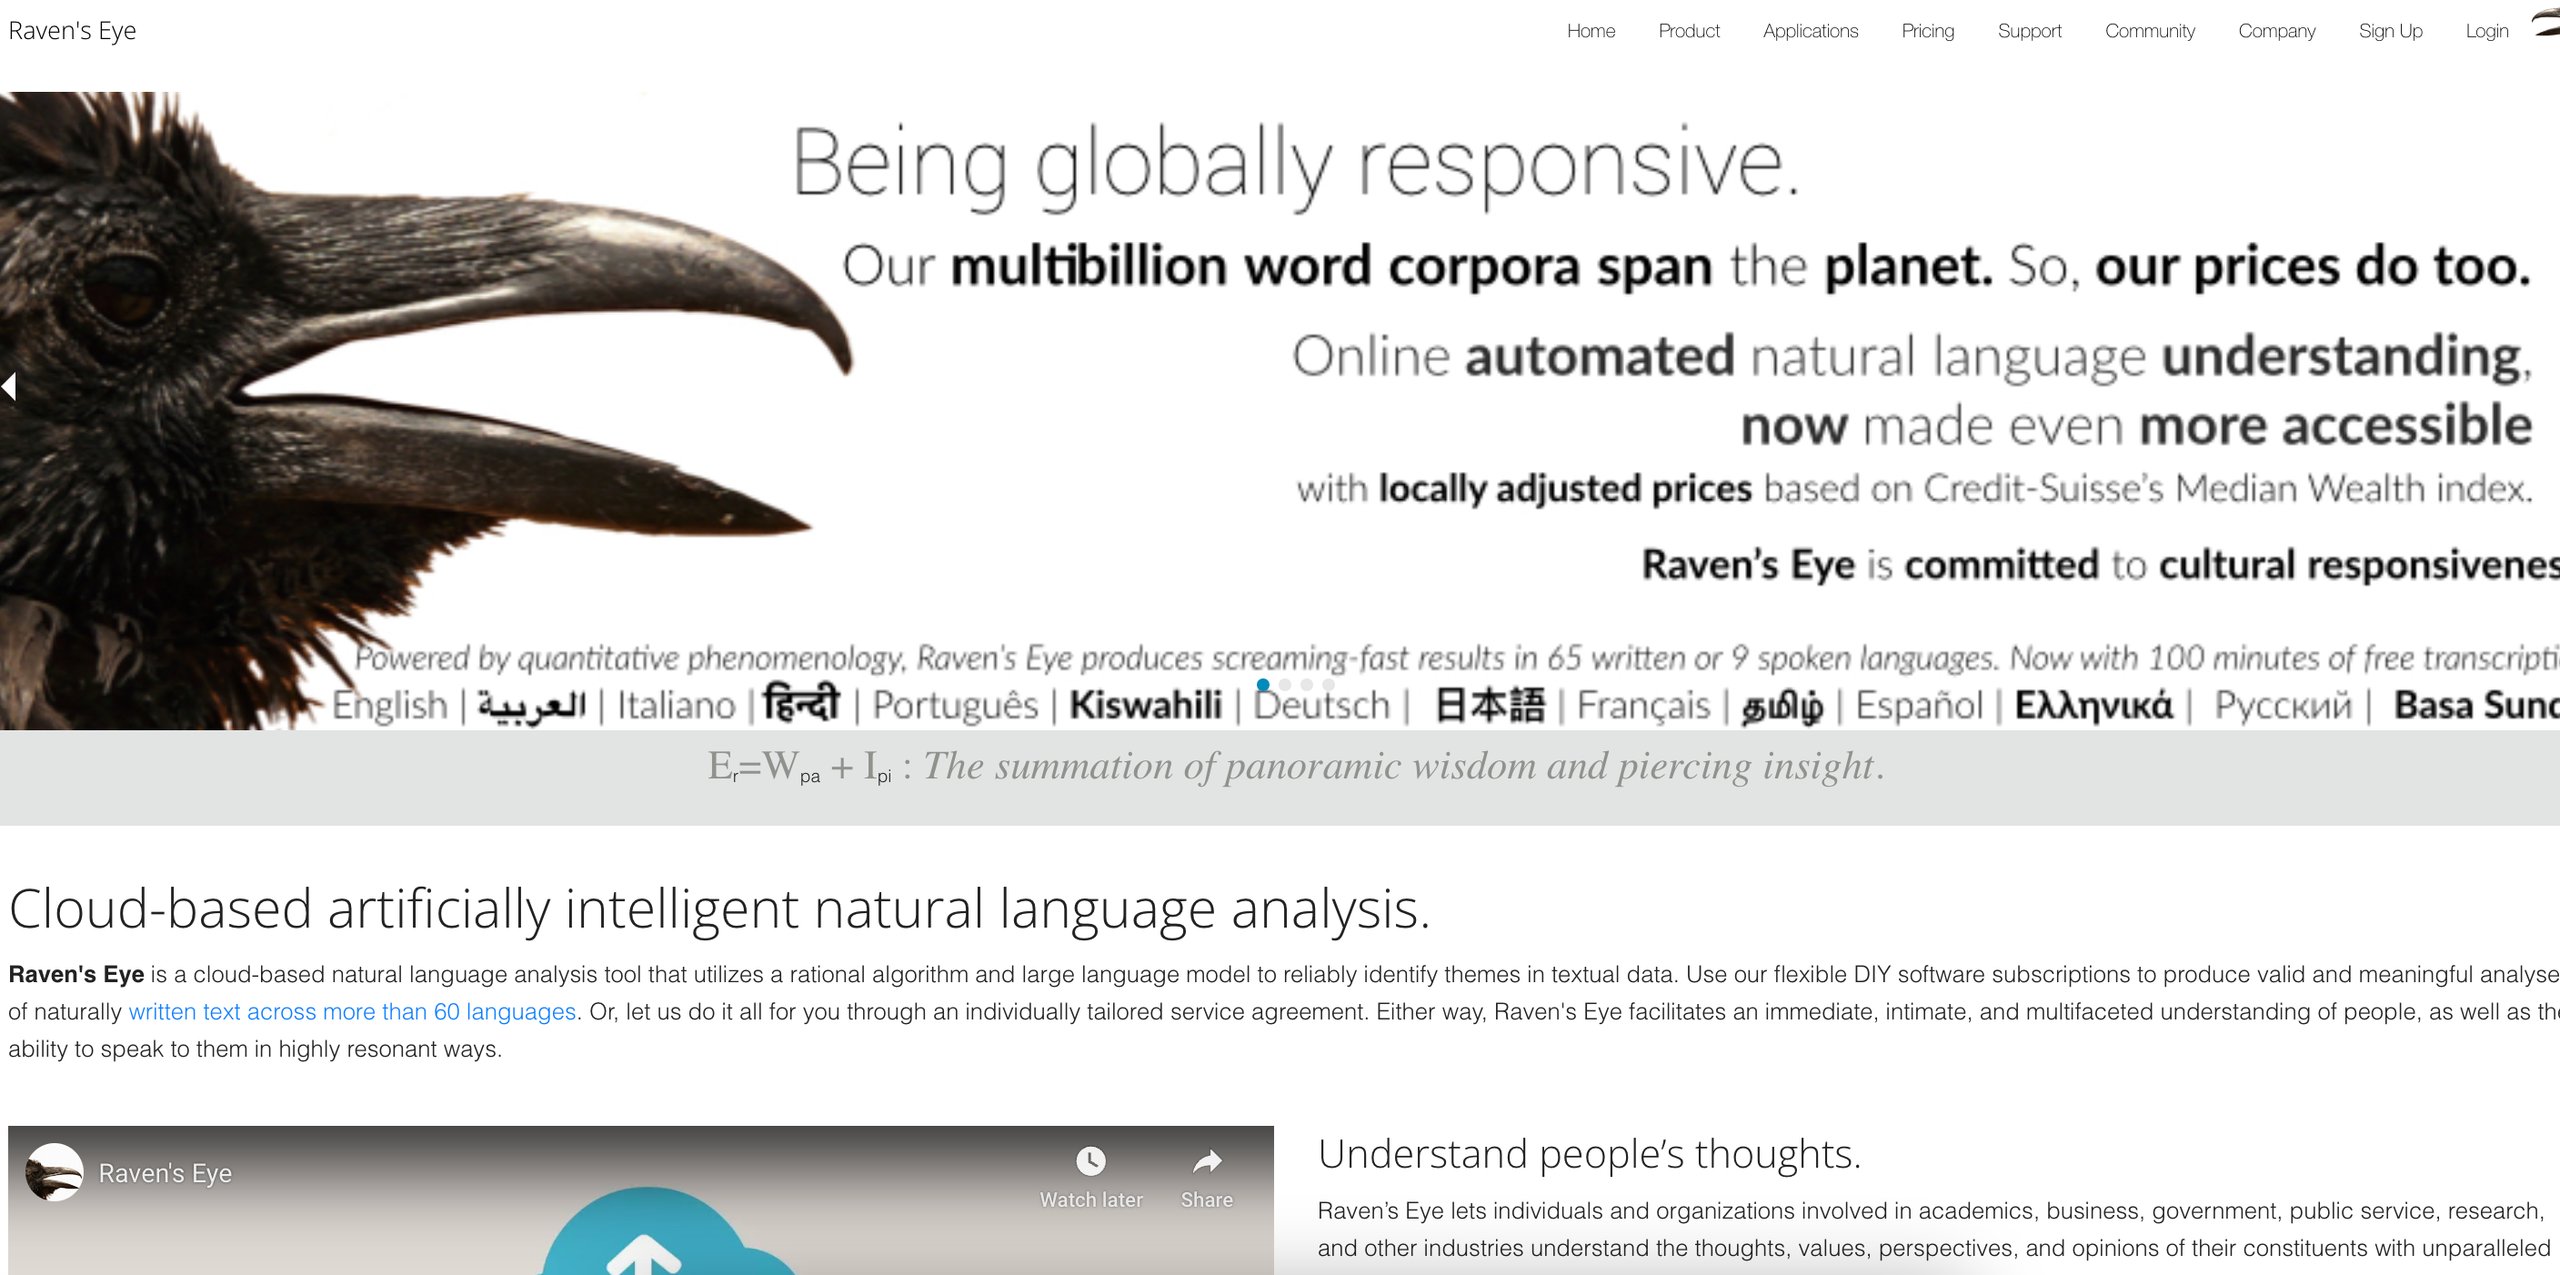
7. Raven’s Eye
Raven’s Eye is an advanced, cloud-based qualitative data analysis software designed to transform the way researchers analyze natural language data. With its powerful combination of cutting-edge science and technology, it enables users to gain deep insights into large datasets quickly and reliably.
Features
Advanced text analysis: It leverages Quantitative Phenomenology, a systematic method for identifying themes in natural language. It compares collected data to linguistic corpora to identify significant word-based themes, revealing the underlying thoughts, values, and opinions of participants.
Panoramic wisdom: This feature allows users to segment and analyze data according to various characteristics such as age, gender, political affiliation, geographic location, and more.
Individual psychological insights: It goes beyond group-level analysis to provide piercing insights into individual cognitive tendencies, emotional states, personality traits, and motivations.
Customizable data input: The tool supports a wide range of data input formats, as well as direct scanning and copy-pasting of data.
Big data technology: It uses advanced big data technology to process and analyze large, complex datasets rapidly and efficiently.
Automatic data processing: By utilizing preset algorithms, it automates the analysis process, eliminating subjective coding and improving reliability and validity.
Pros
Cons
Provides both group-level and individual-level insights, offering a panoramic view of participant thoughts and psychological traits
Its advanced features and technology may have a steeper learning curve for novice users
Offers cloud-based accessibility
Lacks features for analyzing multimedia content, such as video and audio
Offers ample customization options
Pricing
Free trial: Does not offer a free trial
Paid plan: Starts at $39.95 per month
8. VWO
VWO is an end-to-end conversion rate optimization (CRO) platform that focuses on user behavior analysis to improve website performance. It can also help with qualitative insights in the following ways:
Features
Open-ended surveys
They provide deeper insights beyond simple ratings by allowing visitors to express their opinions in their own words. These surveys uncover what visitors liked or disliked about their website experience, helping you identify clear pain points. It leverages AI to generate summaries of your responses, delivering key insights without the need for manual effort.
Heatmaps
Heatmaps visually track visitor behavior by using color gradients to indicate engagement levels. Warm colors, such as red, emphasize areas with high interaction, while cooler colors, like blue, indicate regions of low engagement. Heatmaps are ideal for beginners, offering an easy-to-interpret visual representation of user behavior. They help you understand where visitors focus their attention and which elements drive the most engagement.
VWO’s free AI-powered heatmap generator gives you a predictive visual of how visitors are likely to interact with your webpage. You can instantly spot click patterns, uncover UX bottlenecks, and gather insights to design a more optimized website. Try it free today.
A type of heatmap, clickmaps show where visitors click the most on your website. By analyzing clickmaps, you can identify which elements attract the most interaction, revealing areas that engage visitors and others that may need improvement.
Session recordings
They provide a comprehensive view of visitor interactions on your website. By watching recordings, you can see where visitors pause, hesitate, or experience frustration while interacting with navigation, forms, or other elements. By tracking rage clicks, you can uncover friction points.
Form analytics
You can analyze how users interact with your website forms, including drop-off points and time spent on each field. This can reveal qualitative insights about user friction and their challenges.
IMB Bank achieved a significant conversion boost with VWO
IMB Bank, a trusted Australian institution with over 140 years of legacy, transformed its website optimization strategy by leveraging qualitative visitor research through VWO Insights. The bank discovered hidden pain points in the user journey, which led to remarkable improvements in conversion rates.
Key areas analyzed
Underperforming web pages
Mouse flow patterns
Frustration signals on forms
By reviewing visitor session recordings, IMB’s team pinpointed friction points in the loan lead generation process, such as unclear instructions, lack of social proof, and confusing form designs. Addressing these issues allowed the bank to optimize its conversion funnel and significantly increase conversions.
Implemented optimizations
Streamlined the personal loan application form: The design was simplified, unique selling points (USPs) were highlighted, and instructions were made clearer. This led to a 36% reduction in drop-offs.
Exit-intent pop-up: A pop-up was introduced to prompt users to save their progress if they abandoned the form. This tactic resulted in a 52% increase in form saves and a 9% boost in form completions.
IMB Bank’s success story underscores the power of qualitative visitor research and website optimization in enhancing the user experience and driving business growth.
Before VWO, our website experimentation was ad-hoc. VWO helped us implement a structured optimization process and foster a data-driven experimentation culture. The platform is easy to set up, and we were able to get started quickly, gaining valuable insights that have formed the foundation for our hypotheses and experiments.
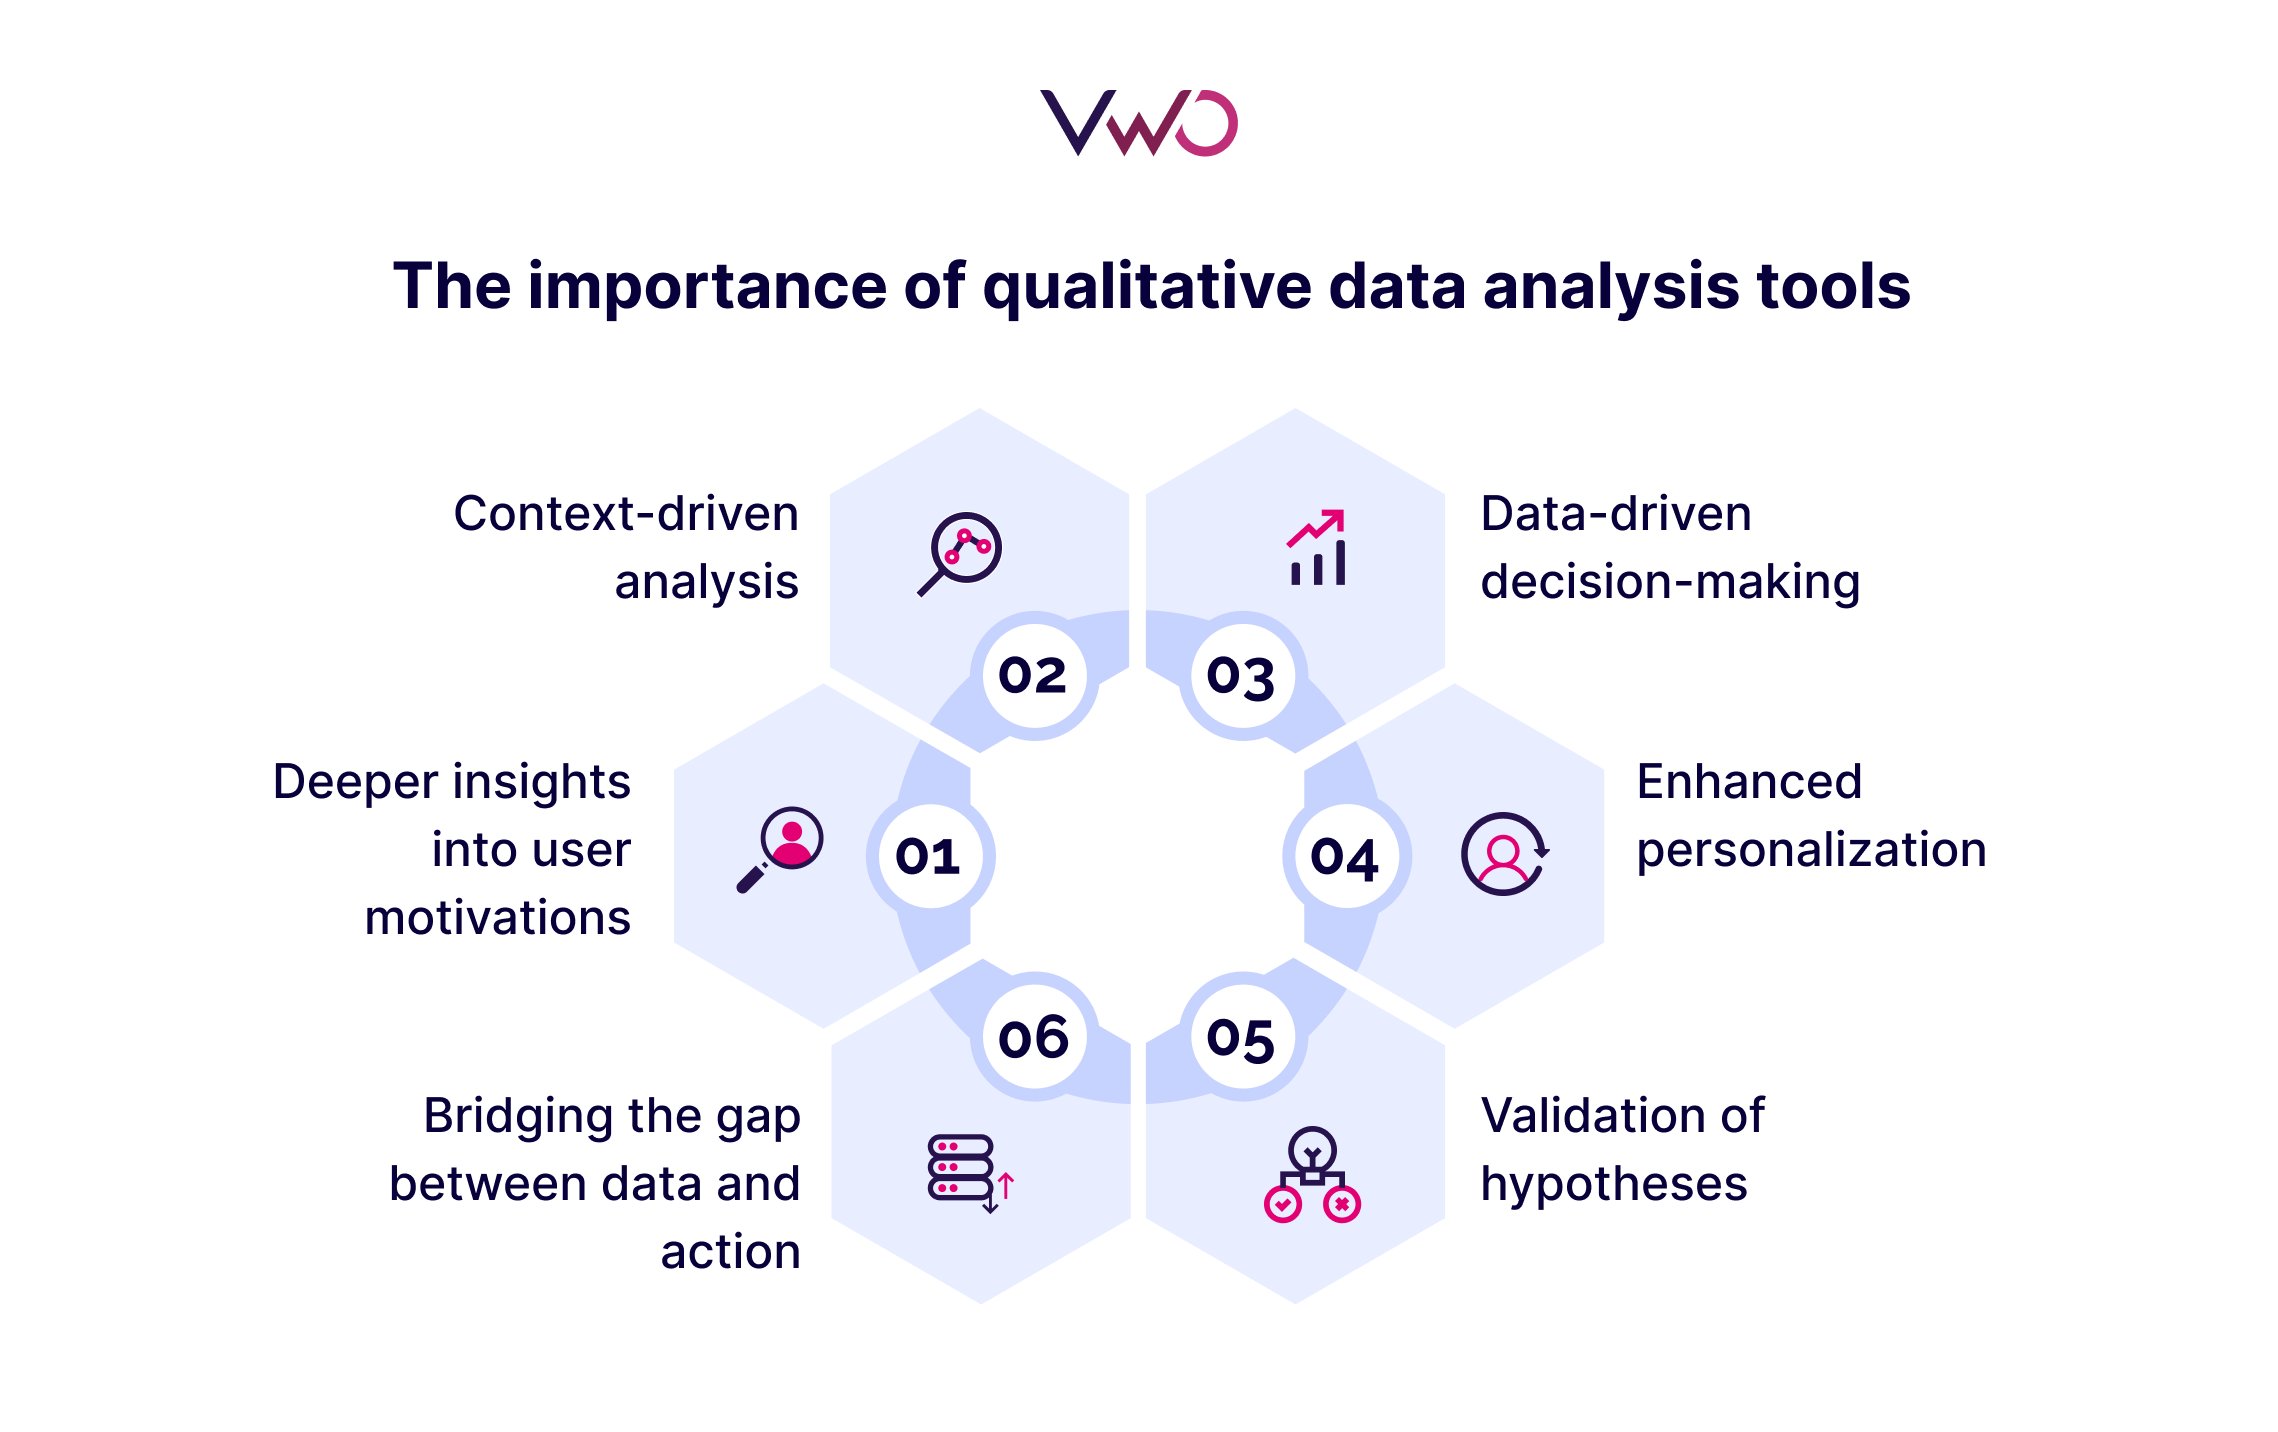
The importance of qualitative data analysis tools
Qualitative data analysis tools are crucial in understanding user behavior and experiences that can’t be captured through quantitative data alone. By integrating these tools, businesses can gain a comprehensive view of their users, which is essential for driving meaningful changes and improvements.
Here’s why they are essential:
1. Deeper insights into user motivations
Quantitative data may show what users are doing, but qualitative tools reveal the reasons behind those actions. They help businesses understand user motivations, emotions, and pain points, providing a richer and more actionable perspective.
2. Context-driven analysis
These tools allow businesses to analyze the context surrounding user interactions. By identifying patterns, trends, and unmet needs, organizations can address challenges more effectively and design solutions that resonate with their audience.
3. Data-driven decision-making
Combining qualitative insights with quantitative data creates a comprehensive view of the user journey. This integration equips businesses to make informed decisions that drive meaningful improvements in user experience and business outcomes.
4. Enhanced personalization
By delving into user sentiments and preferences, qualitative tools empower businesses to create tailored experiences. This level of personalization enhances user satisfaction, loyalty, and engagement, contributing to long-term success.
5. Validation of hypotheses
Qualitative data serves as a critical input for hypothesis generation and validation. It challenges assumptions, ensuring that testing efforts are based on accurate, user-driven insights, ultimately leading to better optimization results.
6. Bridging the gap between data and action
Beyond just insights, qualitative tools help translate raw data into actionable strategies. They enable teams to prioritize initiatives based on real user feedback, ensuring that resources are invested where they matter most.
Key factors for selecting a qualitative data analysis tool
When selecting a qualitative data analysis tool, it’s essential to consider several factors that align with your research needs and project goals. The right tool can enhance data organization, streamline analysis, and provide meaningful insights, ensuring a more efficient and effective research process.
Data compatibility
Choose a tool that supports the types of data you work with, such as text, audio, video, or images. Ensure it can handle all the formats your project requires.
Ease of use
The tool should have an intuitive interface that allows users to quickly learn and navigate its features, especially if your team is new to qualitative data analysis.
Coding and categorization features
Look for tools that offer robust coding capabilities, allowing you to categorize data effectively. Features like auto-coding, hierarchical coding, and multiple coding options can save time.
Collaboration and sharing
If working in teams, select a tool that facilitates collaboration, such as shared projects, comments, and real-time updates.
Data visualization
Tools that offer strong data visualization features (e.g., charts, graphs, word clouds) can help present your findings clearly and make patterns easier to identify.
Advanced analytical features
Some tools provide advanced features like sentiment analysis, data mining, and network analysis, which can provide deeper insights into the data.
Customization and flexibility
The ability to customize the tool to suit your specific research needs (e.g., tailored reports, and flexible coding schemes) can be crucial for more complex projects.
Integration with other tools
Ensure the tool integrates well with other software you use, such as survey tools, statistical software, or project management systems, to streamline your workflow.
Cost and budget
Consider your budget and the pricing model of the tool. Some tools offer free versions or academic discounts, while others may have subscription-based pricing.
Support and documentation
Check if the tool offers reliable customer support, tutorials, and training resources to help you troubleshoot and maximize its capabilities.
Conclusion
Qualitative data is key to understanding the ‘why’ behind customer behaviors, preferences, and decisions. These insights can shape strategies, improve experiences, and drive business success.
With the right tools, raw unstructured data can be transformed into meaningful insights through advanced text analysis and intuitive visualizations. These solutions support researchers, marketers, and business leaders in making smarter, data-driven decisions.
VWO’s suite decodes the complete customer experience through heatmaps, session recordings, surveys, funnels, and form analytics. These tools not only collect data, they reveal the frustrations, motivations, and moments that matter most.
A qualitative data analysis tool helps researchers organize, analyze, and interpret non-numeric data, such as interviews, focus groups, and open-ended survey responses.
Q2. Which tools are commonly used for qualitative data analysis?
Popular tools include Nvivo, Atlas.ti, Maxqda, Dedoose, and QDA Miner.
Q3. What is the most common tool used for qualitative studies?
NVivo is one of the most commonly used tools for qualitative analysis, favored for its robust features.
Q4.What are the methods to analyze qualitative data?
Methods include thematic analysis, content analysis, grounded theory, and narrative analysis.
Q5. What are the main components of qualitative data analysis?
Key components include coding, categorizing, theme identification, data interpretation, and pattern recognition.
Q6. What is an example of a qualitative analysis?
An example would be analyzing interview transcripts to identify common themes or patterns in responses.
Hi there, I’m Aastha Trehan, Associate Manager of Content at VWO. I write about CRO, experimentation, user behavior research, personalization, and AI-driven optimization. With over 3 years of experience in marketing, I focus on creating engaging content that resonates with readers and drives meaningful impact. When I’m not working, you’ll find me playing badminton or pickleball, or binge-watching movies.
Uncover hidden visitor insights to improve their website journey
One of our representatives will get in touch with you shortly.
Awesome! Your meeting is confirmed for at
Thank you, for sharing your details.
, you're all set to experience the VWO demo.
I can't wait to meet you on at
Account Executive
, thank you for sharing the details. Your dedicated VWO representative, will be in touch shortly to set up a time for this demo.
We're satisfied and glad we picked VWO. We're getting the ROI from our experiments.
Christoffer Kjellberg
CRO Manager
VWO has been so helpful in our optimization efforts. Testing opportunities are endless and it has allowed us to easily identify, set up, and run multiple tests at a time.
Elizabeth Levitan
Digital Optimization Specialist
As the project manager for our experimentation process, I love how the functionality of VWO allows us to get up and going quickly but also gives us the flexibility to be more complex with our testing.
Tara Rowe
Marketing Technology Manager
You don't need a website development background to make VWO work for you. The VWO support team is amazing
Elizabeth Romanski
Consumer Marketing & Analytics Manager


![10 Best Enterprise Analytics Platforms [2026]: Expert Picks with Reviews and Comparisons](https://static.wingify.com/gcp/uploads/sites/3/2025/08/Feature-image-10-Best-Enterprise-Analytics-Platforms_-In-Depth-Reviews-and-Comparisons.jpg?tr=h-600)