Data is the backbone of making smart business decisions, but with so much information available, it can be challenging to determine what’s most important. That’s where performance reporting software steps in. These tools help you track, analyze, and visualize key metrics to make data-driven decisions that drive success.
In this post, we’ll explore 7 of the top performance reporting software options and share guidance on how to select the best option for your business. Let’s dive in!
What is performance reporting software?
Performance reporting software gives businesses a structured way to measure progress, interpret key metrics, and present insights in a meaningful way. It simplifies how teams monitor performance and stay aligned with business goals.
It enables teams to:
Collect data from multiple sources
Generate custom or automated reports
Visualize insights in clear, interactive dashboards
With these capabilities, organizations gain a deeper understanding of performance trends and can make confident, data-driven decisions.
7 Best performance reporting software: Quick glimpse
Free trial: 30 days for all features. Paid: Custom pricing
Semrush
– On-page SEO – Link Building – Backlink Analytics – Site Audit – Competitor SEO Analysis – Organic Traffic – Insights – Keyword Research – Market Analysis – Rank Tracking
Create and manage one project, with a limit of 10 analytics reports per day. Paid: Starts from $117/month, billed annually.
Hootsuite
– Social Listening – Custom Reports – Sentiment Reporting – Report Scheduling and Exporting – Social Ads – Analytics – Industry Benchmarks
Free trial: 30 days for all paid plans. Paid: Starts at $149/month, billed annually.
Free trial: 14 days for all features included. Paid: Starts from $165/month, billed annually.
Whatagraph
– Live Dashboards – Data grouping – Aggregation Data Management – Custom Widgets
Pricing details are not listed on the website.
7 Top performance reporting tools and software
Disclaimer: The pros and cons listed are based on reviews and feedback from third-party sites such as G2, TrustRadius, and other sources.
1. VWO
VWO is a comprehensive experience optimization platform that empowers teams to uncover user insights, eliminate friction, and boost conversions across websites and mobile apps.
Performance reports with VWO:
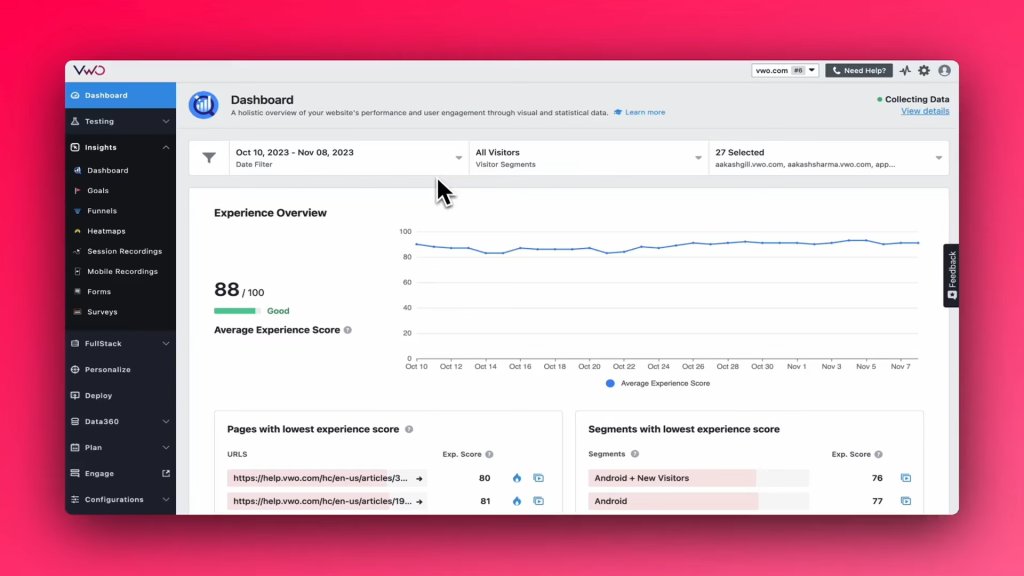
Insights Dashboard
Insights Dashboard
The Insights Dashboard consolidates all behavioral analytics into one place, providing a comprehensive view of how users browse, interact, hesitate, and drop off. It automatically tracks key behaviors such as rage clicks and dead clicks to surface usability bottlenecks and provides an experience score to reflect overall user satisfaction.
Additionally, it also highlights pages that may be causing experience issues. From here, teams can quickly access supporting evidence, such as relevant session recordings, heatmaps, and click patterns, to pinpoint interaction hotspots and user struggle points. The dashboard also offers a summary of form performance and ongoing surveys, helping you monitor conversion blockers and user feedback without switching tools.
While everything is consolidated for a holistic overview, each capability, including heatmaps, session recordings, forms, and surveys, can also be viewed through its dedicated dashboard for deeper, focused analysis.
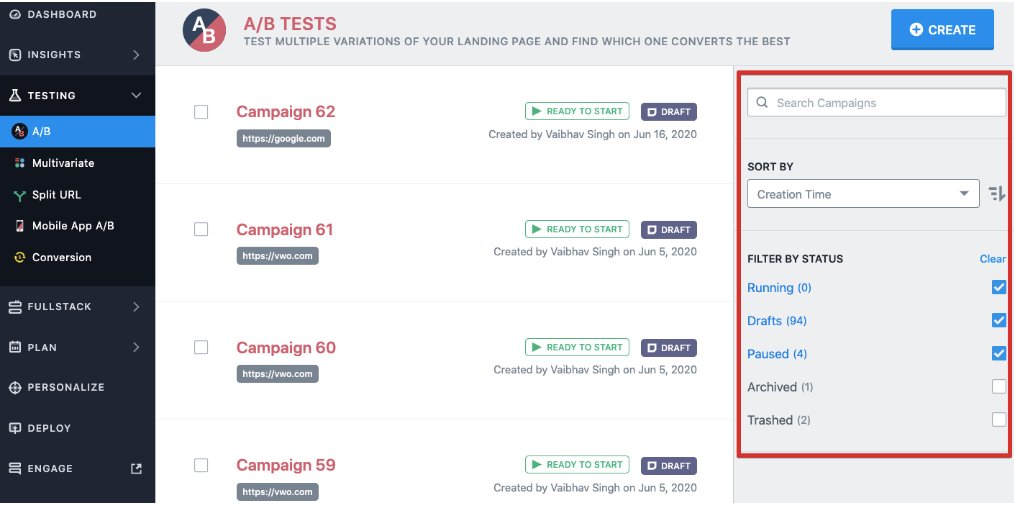
Testing Dashboard
The Testing Dashboard provides complete clarity on how experiments are performing. They provide real-time impact insights based on Bayesian statistics, ensuring more accurate reporting of test results by correcting for peeking and multiple testing errors. You can filter reports by predefined or custom segments, customize the view, and display them as tables or graphs for easier interpretation.
Pro Tip!
Use VWO Copilot to turn performance reports into actionable next steps. Instead of manually digging through heatmaps and session recordings, Copilot automatically spots friction, pinpoints what’s hurting conversions, and tells you exactly what to do next. It recommends test ideas, builds audience segments, and even helps you set up variations fast.
Testimonials
VWOs integrated heat/clickmaps and reporting make it extremely easy for us to convey a clear message of success to our clients.
VWO’s reporting capabilities have helped our team overcome pain points by providing detailed insights into user behavior and test performance. The platform’s intuitive dashboards and customizable reports make it easy to track key metrics, spot trends, and pinpoint areas of improvement.
Megan A Senior Conversion Rate Optimization Specialist at Fleetio
Pros & cons
Pros
Cons
VWO provides comprehensive performance reporting with dashboard-based insights
Advanced performance reporting features (like computed metrics or custom segments) may require technical support or experience with tracking logic.
Combines qualitative and quantitative data, enabling deeper insights through heatmaps, session recordings, and surveys.
Pricing can be considered expensive for smaller teams or businesses with limited budgets.
Reports can be easily shared across teams for collaborative analysis and decision-making.
Watch this webinar to understand how some of the leading Fortune 2000 organizations have built a robust and scalable process to turn data into insights:
Pricing
Free trial: 30 days for all features.
Paid: Customized based on your business goals.
Take advantage of VWO’s robust features and reporting dashboards with a free demo, and begin optimizing your website with data-driven insights today.
2. Semrush
Semrush is an all-in-one marketing platform that boosts online visibility and provides deep marketing insights. It offers a wide range of tools and reports for SEO, PPC, social media marketing, keyword research, competitive analysis, PR, content marketing, campaign management, and data-driven decision-making.
Performance reports with Semrush:
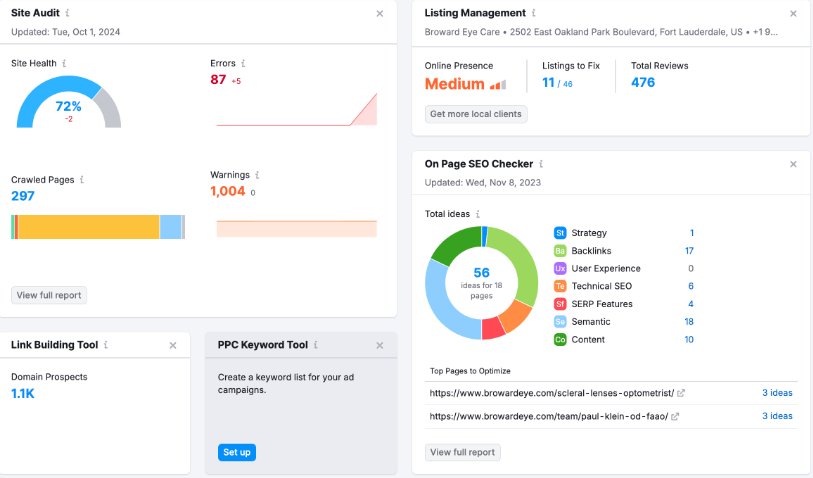
The SEO Dashboard provides a quick snapshot of a project’s SEO performance. It includes widgets that pull key data from Semrush tools, covering SEO & Traffic Insights, Backlink Analysis, Site Performance, Advertising & Listings, Social Media Monitoring, and third-party integrations. Marketers can track rankings, analyze backlinks, monitor site health, manage ads, and oversee social media from one place.
Features
On-page SEO
Link Building
Backlink Analytics
Site Audit
Competitor SEO Analysis
Organic Traffic Insights
Keyword Research
Market Analysis
Rank Tracking
Pricing
Free: Create and manage one project, with a limit of 10 analytics reports per day.
Paid: Starts from $117/month, billed annually.
Pros & cons
Pros
Cons
The Listing Management tool offers an affordable and efficient way for businesses to keep their online listings accurate and up-to-date.
Its high pricing makes it less accessible for small businesses, as some tools feel overpriced compared to more affordable alternatives.
It offers a fast and simple setup, making it easy to manage multiple locations without losing track.
Semrush offers a complete SEO toolkit that helps me work more efficiently. I really appreciate that all essential features are integrated into one platform. I use it for keyword research, technical audits, backlink analysis, and rank tracking. The user interface is clean and easy to use, while the reports are detailed but still client-friendly. Competitive analysis tools are especially strong, and I find them very useful when building strategies. The platform is regularly updated, which shows that the team listens to users and works on continuous improvement.
Biljana J. Founder & SEO Specialist at Digitalni Puls
3. Hootsuite
Hootsuite is a comprehensive tool that provides in-depth insights into your social media performance across multiple platforms, including Facebook, Instagram, TikTok, X (formerly Twitter), LinkedIn, Pinterest, and YouTube.
Performance reports with Hootsuite:
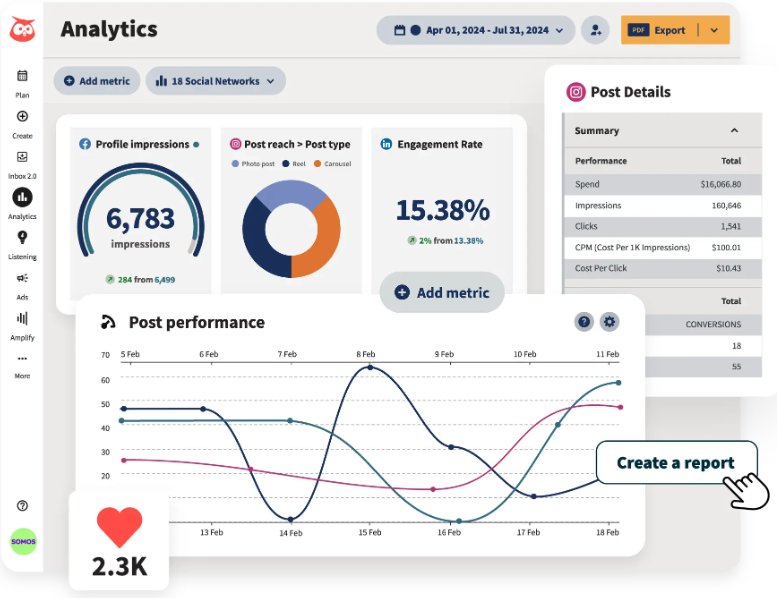
The analytics dashboard presents a clear overview of key metrics, helping users monitor social media performance from a single interface.
It offers pre-built reports for quick insights into audience growth, engagement, and multi-network performance, while custom reports let users tailor data views. It also provides paid vs. organic performance reports to assess ad effectiveness and competitive benchmarking reports to compare performance against competitors. Reports can be customized, scheduled, and shared for ongoing tracking and decision-making.
Features
Social Listening
Custom Reports
Sentiment Reporting
Report Scheduling and Exporting
Social Ads Analytics
Industry Benchmarks
Pricing
Free trial: 30 days for all paid plans.
Paid: Starts at $149/month, billed annually.
Pros & cons
Pros
Cons
Hootsuite consolidates all inboxes in one place, saving time and making it easier to manage client messages without switching platforms.
Hootsuite’s interface could be more modern and visually updated.
It is user-friendly and provides valuable insights on the best times to post and on social media analytics.
The scheduling limit can be restrictive, making it difficult to plan and schedule a full week’s content in advance.
I’m managing social accounts for a fintech SaaS company. There’s something about having everything in one place that just clicks. I don’t need to log into LinkedIn, then Twitter, then Facebook separately throughout the day. It’s all there, waiting for me in these streams I can customize. What I actually use most is the ability to queue posts for different time zones without doing mental math. Since we’re targeting CFOs and finance teams across India and sometimes globally, I can schedule a LinkedIn post for 9 AM when decision makers are scrolling through their feeds, and I don’t have to physically be at my desk to hit publish.
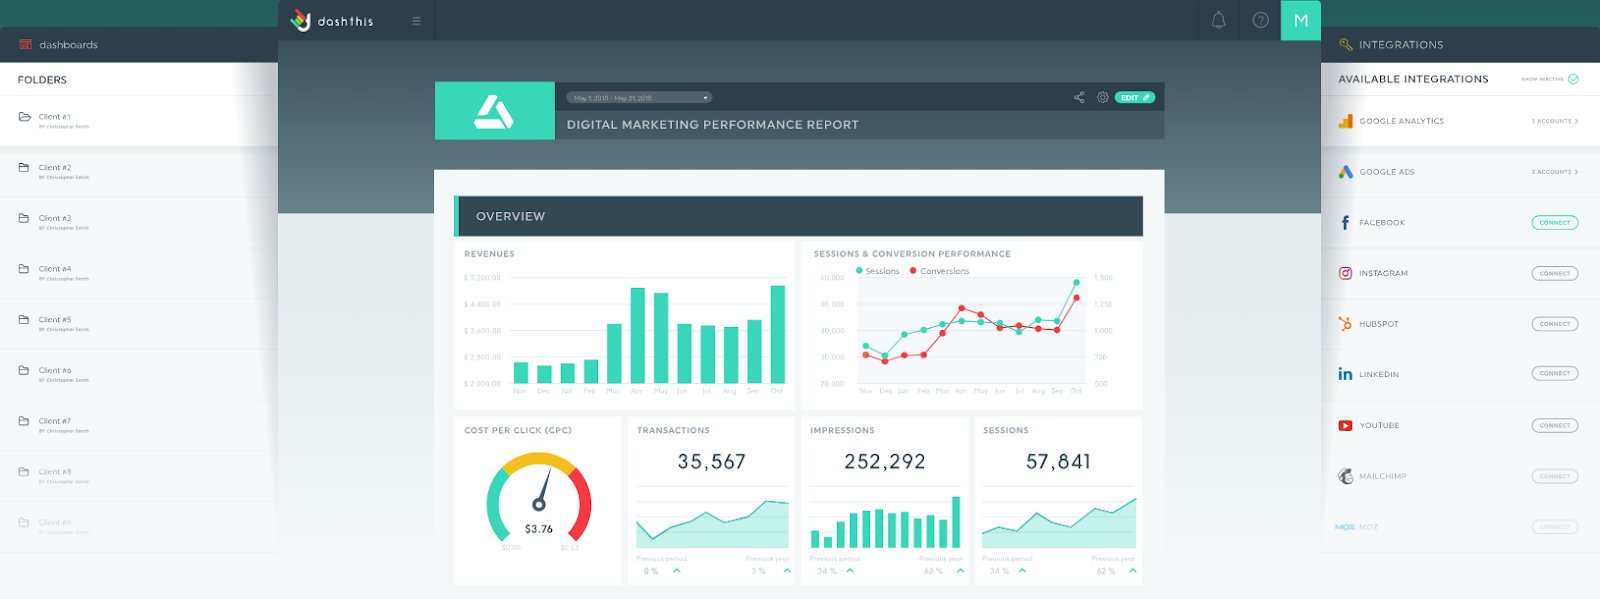
DashThis is a marketing reporting tool that consolidates data from multiple sources like Google Analytics, social media platforms, and advertising campaigns into customizable, visually engaging dashboards.
With preset templates, widgets, and widget bundles for e-commerce, SEO, marketing, and GA reports, DashThis allows you to quickly create and share comprehensive, visually appealing reports, simplifying the reporting process for both marketers and digital agencies.
Performance reports with DashThis:
DashThis offers an all-in-one dashboard that simplifies visualizing digital marketing results with automatic updates, eliminating the need to manually fetch data from multiple platforms. It provides three types of dashboards: Periodic Dashboards for snapshots over set intervals, Rolling Dashboards for continuous real-time updates, and Campaign Dashboards for tracking specific marketing initiatives with detailed performance analysis.
Features
Custom Dashboard Templates
30+ Integrations
Drag-and-Drop Widgets
CSV File Upload
Multi-Integration Dashboards
Pricing
Free trial: 15 days on all plans; 10 dashboards.
Paid: Starts from $42/month, billed annually.
Pros & cons
Pros
Cons
It meets the needs of various target audiences, including small business owners and freelancers.
The pricing can be on the higher side for smaller teams.
The user-friendly interface allows quick data visualization and integrates multiple sources in one place.
Some advanced features are tricky to set up without prior knowledge.
DashThis has made reviewing our analytics and other metrics an absolute breeze. Rather than having to open multiple programs and sift through all of their windows, DashThis has it all available for us to review. We are also able to customize what metrics and analytics we can see with a robust set of widgets.
Mixpanel is a product analytics platform that helps you gain deeper insights into customer behavior and your product’s performance. By tracking user engagement, it enables you to analyze data through interactive reports, allowing easy querying and visualization of results. The platform is built around three core elements- Events, Users, and Properties- offering a comprehensive view of your product’s user interactions.
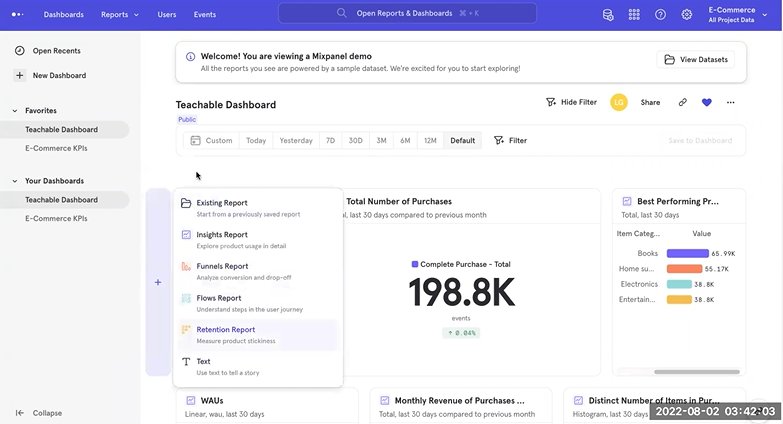
Performance reports with Mixpanel:
Mixpanel provides various report types to help analyze user behavior and product performance. Insights allow you to visualize data trends, while Funnels track conversion rates and highlight where users drop off. Retention measures long-term engagement, and Flows show the most common paths users take through your product.
Dashboards bring these reports together, offering a unified view of key metrics so you can easily track and monitor performance in real-time.
Features
Alerts
Custom Events
Sessions Replays
Cohort Analysis
Anomaly Detection
Customizable Templates
Ranges & Filters
Pricing
Free: Forever for up to 1M events/month.
Paid: The Growth plan is free up to 1M events/month; $0.00028/event afterward.
Pros & cons
Pros
Cons
Mixpanel offers a simple, user-friendly UI, making event tracking and analytics easy without a steep learning curve.
The free plan now has a reduced event limit, which may be a concern for growing businesses, while the paid plans are set at a higher price point.
Data can be exported in multiple formats, and the API allows seamless extraction for in-depth user behavior analysis.
The data export API could be improved by offering more customization options.
MixPanel is super simple, flexible, and robust. We previously used a very centralized approach with Tablaue, where only the data team was able to produce complex reports. The shift to Mixpanel proved to be a huge game-changer that helped ys x2.5 on Black Friday. The real time, the decentralised approach, so everyone has the ability to create reports, the ease of use – all made our team much more data savvy than before.
Matan K. Director of Marketing
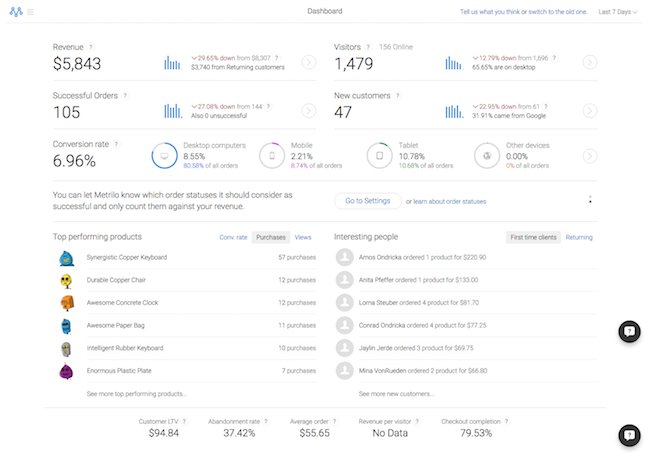
6. Metrilo
Metrilo is a growth platform for eCommerce brands that provides eCommerce analytics to track marketing performance. It automatically reports on campaigns, engagement, and sales attribution, helping store owners monitor channels, referrals, influencers, and coupon codes to optimize spending and identify sales drivers.
Performance reports with Metrilo:
Metrilo’s real-time dashboard highlights key eCommerce performance indicators for the selected period (default: last 7 days). It tracks visitors, revenue, and orders, including the top 5 sources for each. The dashboard also shows overall eCommerce conversion rates and conversion rates by device, along with the best-performing products, which can be sorted by views, purchases, or conversion rate.
Additionally, product management reports track views, purchases, and abandonment rates, while correlation reports reveal which products are commonly bought together. Metrilo’s pre-set funnel reports automatically map out the customer journey, helping identify and fix conversion issues easily.
Features
Filtering & Segmentation
Automated Emails
Growth Assistant
Conversion Funnels
Revenue Breakdowns
Cohort Comparisons
Marketing Performance Reporting
Pricing
Free trial: 14 days for all features included.
Paid: Starts from $165/month, billed annually.
Pros & cons
Pros
Cons
Metrilo helps small businesses by generating valuable reports and uncovering lost revenue opportunities.
The interface occasionally lags when generating data sets based on queries.
It connects sales data with actionable strategies like email automation, feedback, CRM, and tailored offers, all from one platform.
It would be beneficial to receive recommendations and insights on optimizing product usage.
Bright, potent, intuitive & easy to use, Metrilo offers trigger-based emails depending on users’ behavior. I love being able to configure an email for those users who spent a lot of time on a specific page or product, offering them a relevant discount based on their purchase intention. It narrows down the engagement and promotional campaigns to just a few parameters, demanding a very short time.
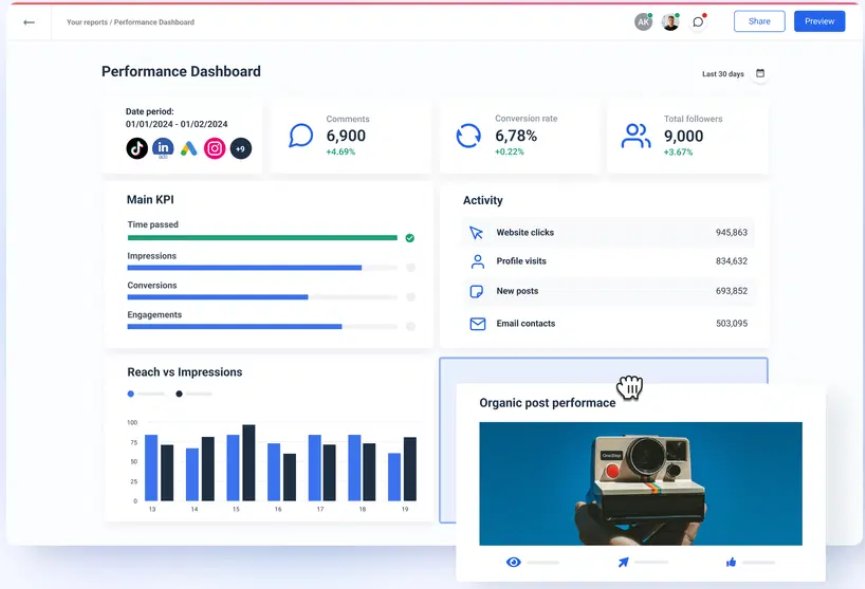
Whatagraph is an all-in-one marketing platform that streamlines data workflows by replacing complex tools. It offers 50+ native integrations with social media, paid ads, email, SEO, CRM, and more, consolidating all marketing data in one place. With easy setup and management, it provides a reliable, user-friendly hub for teams to handle complex data efficiently.
Performance reports with Whatagraph:
Whatagraph simplifies data visualization by directly connecting data from multiple sources to your reports, ensuring accuracy and eliminating broken connections. With AI-driven insights, you can consolidate all your top performance data, KPIs and metrics, and cross-channel insights in one place, generating live, white-labeled reports in minutes and quickly taking action for campaign optimization.
Features
Live Dashboards
Data grouping
Aggregation
Data Management
Custom Widgets
Pricing
Pricing details are not listed on the website.
Pros & cons
Pros
Cons
Whatagraph is quick to use, and creating new reports is effortless with a wide range of channel integrations.
Reports may reload during presentations, which can be frustrating, especially with a poor network connection.
It is flexible and user-friendly, making it easy to add users, create sources, and design custom widgets.
The pricing is on the higher side, which may not be ideal for everyone.
The dashboards are clean, easy to build, and perfect for client reporting. It pulls in data from Google Ads, Meta, LinkedIn, and even TikTok without any hassle. I love how I can set up automated reports that look great and are client-ready. No more fiddling with spreadsheets or wasting time building slides.
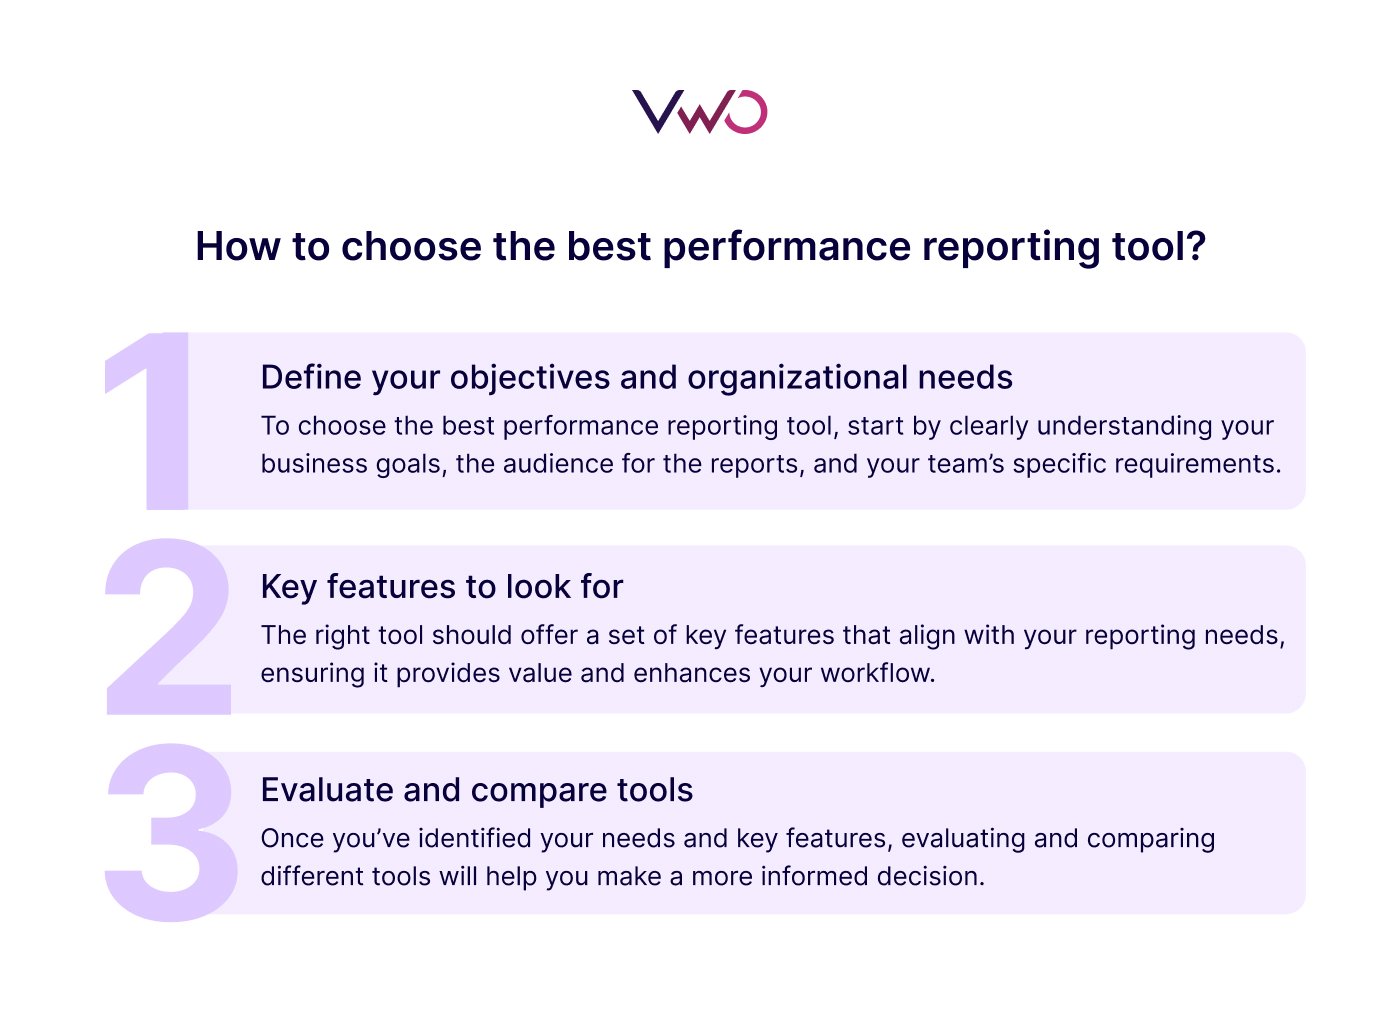
How to choose the best performance reporting tool?
To choose the best performance reporting tool, it’s essential to keep the following factors in consideration:
1. Define your objectives and organizational needs
To choose the best performance reporting tool, start by clearly understanding your business goals, the audience for the reports, and your team’s specific requirements.
Identify your reporting goals (e.g., track KPIs, analyze trends, improve areas) to ensure the tool provides relevant data for your specific needs. For example, basic metric reporting won’t be sufficient if you require deeper insights into user behavior.
Choose a reporting tool that offers multiple formats to ensure data is easily understood by all—whether through number-filled tables for analysts or visual graphs for quick insights.
Assess the data sources you need to connect (e.g., databases, APIs, spreadsheets) to avoid manual workarounds and ensure real-time, accurate data flows.
Consider your team’s workflow preferences (e.g., collaboration or independent work) to select a tool that enhances productivity and productivity rather than complicating processes.
Determine how often reports are needed (e.g., weekly, monthly, ad-hoc) to choose a tool that collects data in real-time, ensuring up-to-date insights with minimal manual effort.
Ensure the tool fits within your budget and can scale with your data so it remains valuable as your business grows, rather than requiring frequent replacements.
2. Key features to look for
The right tool should offer a set of key features that align with your reporting needs, ensuring it provides value and enhances your workflow.
Data visualization: Clear and understandable charts, graphs, and dashboards.
Data integration: Ability to connect with various data sources (internal and external).
Customization: Flexible reporting tailored to your needs.
Ease of use: A user-friendly interface to ensure smooth adoption.
Collaboration: Features that support sharing and working together on reports.
Automation: AI-supported features to streamline data collection and report generation.
Security: Comprehensive measures to protect confidential data.
Scalability: The tool should handle growing data and user needs.
Integrations: Seamless compatibility with existing tech stack.
Reporting formats: Options for static, interactive, or live reports.
Templates: Pre-built templates to simplify report creation.
3. Evaluate and compare tools
Once you’ve identified your needs and key features, evaluating and comparing different tools will help you make a more informed decision.
Reviews and case studies: Read feedback from other users for insights into the tool’s effectiveness.
Demos and trials: Test out tools through free trials or demos.
Compare features and pricing: Make a comparison chart to evaluate different tools.
Conclusion
Choosing the right performance reporting software is crucial for gaining valuable insights and optimizing business strategies. With the right business intelligence tool, you can streamline data analysis, improve decision-making, and drive growth for your business.
VWO stands out as an all-in-one experience optimization platform that goes beyond basic reporting. It consolidates everything into a unified dashboard. You can analyze user behavior through heatmaps and session recordings, track conversion funnels, gather feedback via surveys, run A/B tests, and generate comprehensive reports, all from a single platform.
This integrated approach means you’re not just viewing data, you’re connecting insights directly to optimization actions.
Request a demo to see how VWO can streamline your data analysis and drive measurable improvements across your digital properties.
FAQs
Q1. What is meant by performance reporting?
Performance reporting refers to the process of collecting, analyzing, and presenting data related to business or marketing activities. It involves generating reports and financial statements that track key metrics and KPIs to evaluate the effectiveness of strategies, identify areas for improvement, and make informed decisions.
Q2. What are performance reporting tools?
Performance reporting tools are software solutions that help businesses track, measure, and analyze key metrics related to their operations, marketing campaigns, and overall performance. These tools consolidate data from various sources to provide insights and reports that support data-driven decision-making.
Q3. What types of performance reports can I generate with the software?
With performance reporting tools, you can generate reports such as campaign performance reports, sales reports, conversion tracking, engagement metrics, customer behavior analysis, financial planning, and financial performance reports. These can be customized to focus on specific KPIs and timeframes.
Q4. What is the best performance reporting software for marketers?
Some of the best performance reporting software for marketers include Google Data Studio, Tableau, Power BI, Whatagraph, and Semrush. These tools offer comprehensive data visualization, integration with marketing platforms, and real-time reporting as key features, making it easy for marketers to track and analyze their campaigns.
I'm a branding enthusiast, marketer, and B2B content professional with over 20 years of experience. I'm also a certified native advertising expert and trained in strategic thinking. Author of 'Managing Modern Brands: Cult Theory and Psychology', and three other books in diverse genres. I generally write on marketing trends, optimization, brand strategy, consumer psychology, CRO, cult theory, data, personalization, and content strategy. With a strong expertise in building and leading teams and cross-functional collaboration, I have driven demand through content creation, data, digital media, content marketing, and technology.
Uncover hidden visitor insights to improve their website journey
One of our representatives will get in touch with you shortly.
Awesome! Your meeting is confirmed for at
Thank you, for sharing your details.
-
, you're all set to experience the VWO demo.
I can't wait to meet you on at
Account Executive
, thank you for sharing the details. Your dedicated VWO representative, will be in touch shortly to set up a time for this demo.
We're satisfied and glad we picked VWO. We're getting the ROI from our experiments.
Christoffer Kjellberg
CRO Manager
VWO has been so helpful in our optimization efforts. Testing opportunities are endless and it has allowed us to easily identify, set up, and run multiple tests at a time.
Elizabeth Levitan
Digital Optimization Specialist
As the project manager for our experimentation process, I love how the functionality of VWO allows us to get up and going quickly but also gives us the flexibility to be more complex with our testing.
Tara Rowe
Marketing Technology Manager
You don't need a website development background to make VWO work for you. The VWO support team is amazing
Elizabeth Romanski
Consumer Marketing & Analytics Manager
Trusted by thousands of leading brands
Awesome! Your meeting is confirmed for at
Thank you, for sharing your details.
Your Roadmap to Better Results
1:1 Demo customized to your industry and optimization goals.
Feature deep-dive into the user behaviour tools you need most.
No-pressure advice on the best path forward for your team.


![10 Best Enterprise Analytics Platforms [2026]: Expert Picks with Reviews and Comparisons](https://static.wingify.com/gcp/uploads/sites/3/2025/08/Feature-image-10-Best-Enterprise-Analytics-Platforms_-In-Depth-Reviews-and-Comparisons.jpg?tr=w-300,h-150)


