The best mobile apps aren’t the ones topping the download charts on the App Store.
Instead, they’re the ones who understand user goals and provide a seamless, hassle-free experience to help them achieve those goals effortlessly.
And if you want your mobile app to be one of the best, it’s time to go beyond traditional metrics to understand what makes your app truly successful.
Or rather, what’s holding it back?
No matter what industry your app belongs to, choosing the right mobile app analytics tool is a key step that can make or break your optimization efforts.
So, here’s a list of the top 25 mobile app analytics tools that can give your mobile app the edge it needs to succeed in a competitive and mostly saturated market.
What are mobile app analytics tools?
Mobile app analytics tools are platforms designed to track, measure, and analyze key metrics related to app performance and user behavior.
These tools provide insights into how users interact with your app, helping businesses make data-driven decisions to optimize user experience, improve retention, and achieve their revenue goals.
Some important functions of a typical mobile app analytics tool include:
Campaign flow visualization, configurable campaign goals and attribution, customer journey reporting, advanced data exploration, and cohort analysis.
–
Custom
20+ top mobile app analytics tools: Detailed overview
1. UXCam
UXCam is a popular mobile app analytics tool that offers a wide range of capabilities for tracking and analyzing user behavior.
It enables you to track your app’s performance, understand why users struggle, streamline the feedback process, and drive user engagement across all segments.
Offers useful recommendations for generating dashboards
Easy to track feature usage and adoption by end users
Session replay offers good visibility into the early stages of the user’s journey
Cons
Limited depth in event tracking and segmentation as compared to other tools
Heatmaps and session replays often have longer load times
Interface and dashboards are not very user-friendly
Pricing
UXCam offers custom pricing plans like Starter, Growth, and Enterprise based on the number of monthly sessions you wish to track.
A customer review as per G2
UXCam makes it really easy to see how users interact with our product. The session recordings and heatmaps give clear insights into where users get stuck and what they click on, and how they move through the app. It helps us improve our design and fix issues faster.
Vijay S
Customer Success Manager
2. Mixpanel
Mixpanel empowers you to gather deeper insights into user interactions and make data-driven decisions to improve user engagement and app retention.
You can monitor crucial metrics with intuitive dashboards, unify quantitative data with qualitative data, and measure the impact of your campaigns and strategies on the app’s performance.
Top features of Mixpanel
Session replay, product analytics, customizable dashboards for in-depth reports, funnel creation, and cohort analysis.
Pros
Event-based tracking helps identify key engagement areas
Easy to customize dashboards according to different use cases
The ability to create funnel reports with conversion rate metrics is very helpful
Cons
Requires technical support to set up event tracking or modify existing events
Support and documentation need to be improved
Integration with the existing tech stack can be challenging
Pricing
Mixpanel offers a free plan for up to one million monthly events, while paid plans start at $24/month for 10k events.
3. Firebase
Firebase provides a comprehensive suite of AI tools and capabilities for app development and optimization, including robust analytics capabilities to understand user behavior and make informed decisions.
Backed by Google, it integrates seamlessly with Google Ads and other ad networks, empowering businesses to make data-driven decisions and improve user acquisition strategies, all within one platform.
The tool is ideal for app developers and marketers looking to enhance their products, optimize campaigns, and gain deeper insights into user interactions.
Top features of Firebase
App distribution, crash analytics, A/B testing, feature management, and AI-powered insights and tips to improve usability.
Pros
Useful analytics and seamless integration with different Google services
Easy to set up and track conversion events
Intuitive dashboards make it easy to analyze various user cohorts
Cons
Pricing can be quite high, especially when you move to a premium plan as your requirements scale
Lack of resources and documentation for managing data within the platform
Analytics features are limited, as compared to other mobile app analytics tools
Pricing
Firebase offers customized pricing options based on your requirements.
4. Amplitude
Amplitude is an AI-powered product analytics platform that unifies all your data and offers real-time, behavioral analytics to improve the mobile app performance.
It offers intuitive dashboards for monitoring key metrics and provides insights into user interactions, helping you understand the impact of your strategies on app performance.
Amplitude offers automated insights, data visualizations, and other capabilities to streamline app journeys, drive business growth, and increase app revenue.
Top features of Amplitude
Automated analytics setup, AI-powered insights, metrics and goal tracking, proactive issue detection, full-funnel customer insights, and A/B Testing.
Pros
Powerful capabilities like retention analysis, segmentation, and funnel analysis
Simple and intuitive user interface with quick load time
Setting up graphs and panels for analysis is quite easy, especially for non-tech users
Cons
Managing multiple products may prove to be challenging
Limited customization options for certain visualizations
Initial setup and implementation can be tough for new users
Pricing
Amplitude offers a free plan for up to 50K MTUs, while paid options start at $61/month.
5. AppDynamics
AppDynamics is a powerful performance monitoring and analytics tool that offers comprehensive insights into user interactions on your mobile app.
It enables you to identify performance issues, optimize user journeys, and improve customer satisfaction. With its robust monitoring capabilities, AppDynamics ensures seamless operations, faster issue resolution, and improved collaboration between teams.
Top features of AppDynamics
Experience journey mapping (ExJM), mobile real user monitoring, and synthetic monitoring.
Pros
Easy to integrate with third-party platforms and data monitoring tools
Useful for monitoring app logs and metrics in a granular way
Intuitive dashboard offers insights and valuable suggestions to tackle issues
Cons
High costs, especially for large businesses or enterprises
Limited monitoring of applications based on different technologies
Lack of in-depth analytics as compared to competitors
Pricing
AppDynamics offers a 14-day free trial, while the paid option is priced at $6/month.
6. Sensor Tower
Sensor Tower is a mobile app analytics platform that offers deep insights into market trends, competitor performance, and user sentiment.
It enables you to make data-driven decisions, benchmark against competitors, identify growth opportunities and refine app store optimization (ASO) strategies.
Sensor Tower also helps you identify companies that fit your app’s portfolio which can be useful for lead generation and M&A (mergers and acquisitions) talks.
Top features of Sensor Tower
Market research and competitor analysis, app performance benchmarking, user sentiment and engagement Insights, and lead list creation for sales and outreach.
Pros
Useful for analyzing competitors and implementing new features in your app
Offers optimization opportunities to improve user acquisition and revenue
The customizable dashboard helps identify and analyze performance trends
Cons
Exporting CSV files can be a challenging task, especially for a big dataset
A high margin of error in recent data can cause issues in monitoring and analysis
Data for active users data can be unreliable due to multiple changes and modifications
Pricing
Sensor Tower offers customized pricing options based on your business needs.
7. Smartlook
Smartlook combines quantitative and qualitative insights to help businesses understand user behavior on mobile apps.
Tools like session recordings, event tracking, and heatmaps enable teams to identify friction areas, optimize user journeys, and improve the overall app experience.
Smartlook is easy to set up and integrate with existing tech stacks, and it can help businesses resolve pain points, and create better experiences without requiring heavy developer involvement.
The option to view user movements and actions at a higher speed saves time and effort
Custom heatmaps and funnels are quite useful for in-depth analysis
Integration with leading website builders and eCommerce stores
Cons
Glitches with session recordings can impact reporting and analysis
The error explanation feature may not accurately convey the actual problem that occurred
Heatmaps are active for a limited period, after which they get deactivated
Pricing
Smartlook offers a free plan with a limit of 3k monthly sessions, and the paid options are priced at $55/month. Every plan comes with a 30-day free trial.
A customer review as per G2
Clean, attractive interface that’s relatively easy to navigate. Custom dashboards let us focus on the metrics that matter. The free plan is great for trials and small projects. Good toolset for collecting analytics and monitoring user actions.
Victoria M
QA Engineer
8. AppsFlyer
AppsFlyer is one of the most popular mobile app analytics tools, simplifying complex data to give businesses a clear view of their app’s performance.
It tracks key metrics and offers real-time reporting along with cross-channel insights, enabling teams to make informed decisions to optimize user journeys.
AppsFlyer can also help businesses optimize their marketing efforts, improve KPIs, and drive user growth.
Integration with other tools and the ease of creating customized dashboards
Tracking and attributing app installs to specific sources improves acquisition efforts
Provides detailed documentation and other helpful resources for new users
Cons
Reports provide limited information and segmentation options
Discrepancies in downloaded data impact analysis and decision-making
Complex language can be difficult to understand for non-tech users
Pricing
AppsFlyer offers a free-for-life Zero plan along with a paid Growth plan that is priced at 7¢/conversion. Both plans include 12k free conversions and 30-day free access to the tool’s add-ons.
9. Countly
Countly is a growing analytics platform that supports all major platforms like iOS, Android, macOS, and Windows, offering deep insights into user behavior.
The tool adapts easily to your business needs and product lifecycle, making it an ideal solution for businesses looking for flexible, and powerful analytics tools.
With 70+ features that provide in-depth insights, Countly helps you optimize and deliver experiences that your users love.
Useful for viewing events and behaviors of users interacting with your app
Intuitive user interface with accurate and reliable reporting capabilities
Tracking options include session frequency, geography, device, model, and so on
Cons
Lack of detailed documentation and resources, especially for Android
Support for a limited number of systems due to heavy server requirements
Limited filter capabilities and lack of adequate community edition features
Pricing
Countly offers a forever free Lite plan and a Flex plan that is free for up to 1000 MAUs. While paid options for Flex start from $80/month, it also offers custom pricing plans for Enterprise brands.
10. Leanplum a CleverTap company
Leanplum, powered by CleverTap, is a powerful mobile analytics and engagement tool designed for app-first companies.
With a focus on industries like gaming, subscription, retail, and finance, Leanplum offers seamless insights into campaign performance and empowers businesses to deliver impactful multi-channel campaigns.
The platform also enables you to visualize user behavior and track conversions, ultimately improving user experience and boosting engagement.
Top features of Leanplum
Campaign flow visualization, configurable campaign goals and attribution, customer journey reporting, advanced data exploration, and cohort analysis.
Pros
Good for creating and managing multi-channel campaigns in one place
Helpful for onboarding, activation, and also re-engagement of dormant users
Simple and easy-to-use interface, especially for non-tech users
Cons
Lacks some key functionalities like static audience lists and conversion attribution
Needs more detailed tutorials and self-onboarding resources
Users may find it challenging to set up rules and target the right user groups
Pricing
Leanplum offers customized pricing options based on your needs and goals.
11. Glassbox
Glassbox is a leading mobile app analytics solution that offers capabilities like session replays, journey analysis, and real-time performance monitoring.
It enables teams to identify UX issues and improve app functionality, while the reporting capabilities deliver AI-driven insights and suggestions tailored to your specific needs.
Glassbox makes it easier for businesses to uncover points of friction, reduce acquisition costs, and align their app’s performance with user expectations.
Top features of Glassbox
Session replays, real-time insights, journey and funnel analysis, crash and performance analytics, interaction maps, and AI-driven recommendations.
Pros
Useful for identifying UX issues and tracking the performance of new features
Session replay summaries help save a lot of time and effort
DOM snapshots help with debugging and replicating specific issues
Cons
Journey maps and funnels display limited information, which can impact how quickly issues are resolved
Does not offer longer retention periods for session replays
Limited training modules and webinars for new customers
Pricing
Glassbox provides custom pricing options for customers based on their needs.
Pro Tip!
Analyze and compare the behavior of active users vs inactive users. Look for patterns in how they use the app, the features they engage with, where they drop off, and what they skip. This approach will help you to find early warning signs of inactivity and test small changes to re-engage inactive users before they abandon your app completely.
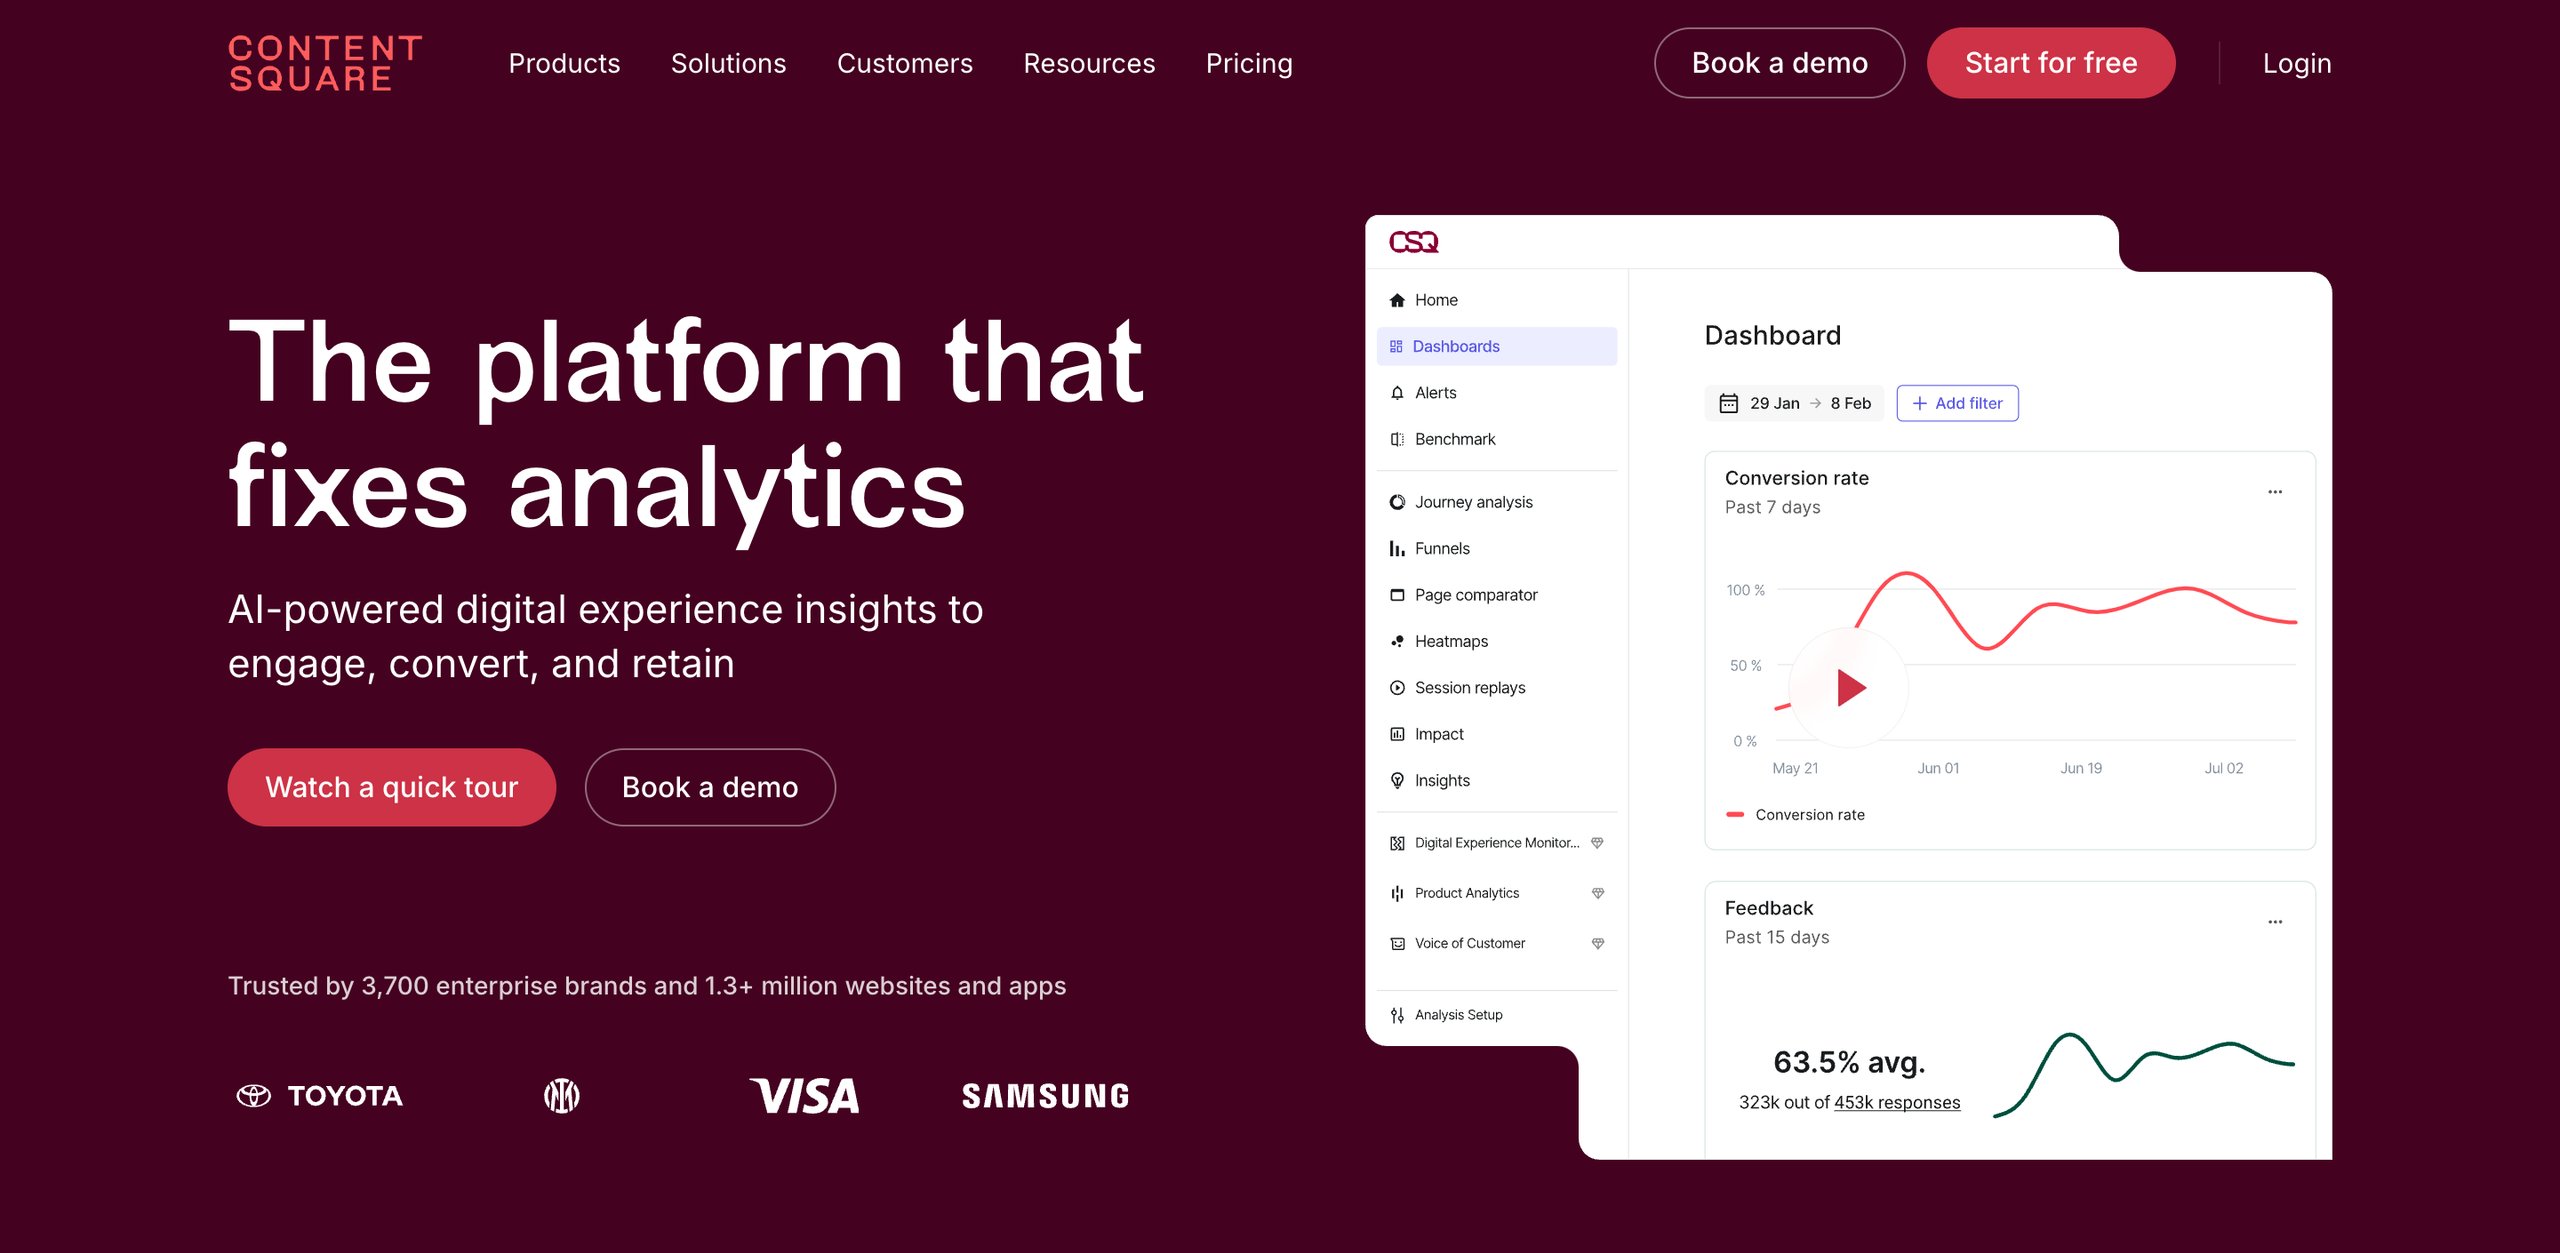
12. Contentsquare
Contentsquare is a powerful mobile app analytics platform that provides actionable insights into user behavior, app performance, and engagement.
It enables businesses to leverage cross-platform data, session replays, and journey analytics to identify and address pain points, optimize usability, and achieve measurable ROI.
Contentsquare simplifies app optimization with real-time monitoring, and intuitive dashboards while it also helps organizations track notification effectiveness, and prioritize impactful fixes.
Top features of Contentsquare
Auto-capture technology, readymade dashboard templates, session replay, engagement and journey analytics, crash analysis, error quantification for churn prevention, and revenue impact analysis.
Pros
Offers valuable insights into user engagement and app retention data
‘Click-recurrence’ is a useful metric to identify user frustration and fix bugs
Easy to share key findings and insights with others in the organization
Cons
Integrations with other platforms is a complex process that may require technical expertise
New users may find the interface overwhelming, especially those who have minimum experience with data & analytics
Visualization of data related to journey analysis can be improved
Pricing
Contentsquare offers a forever-free plan that includes up to 20k monthly sessions. The paid plans start at $49/month, while the Enterprise plan is customized based on the brand’s requirements.
A customer review as per G2
I find Contentsquare to be an essential tool for understanding user behavior and optimizing our website performance. The platform’s ease of use and visual clarity stand out the most for me, as they allow even those unfamiliar with the tool or data analysis to understand the insights effortlessly. I appreciate how Contentsquare helps find friction points quickly and provides behavioral insights, which significantly aid in optimizing conversion rates and overall performance.
Thomas S
Website manager
13. MoEngage
MoEngage is a popular mobile app engagement platform that enables brands to connect with their customers on a deeper, more personal level.
It offers a wide range of insights-led engagement tools that can help businesses craft meaningful experiences, and drive growth.
MoEngage also provides some advanced features like personalized campaigns, customer segmentation, and AI-driven automation to improve engagement and boost customer lifetime value.
AI-powered engine offers real-time insights to improve engagement and retention
Makes it easy to track end-to-end user journeys and specific behaviors
Visual charts help in identifying patterns and activities across features
Cons
Metrics and other funnel events are sometimes inaccurate, making data analysis unreliable as compared to other tools
Complex user interface, especially for those who might be new to analytics and user engagement
High load times and non-responsiveness can impact the delivery of campaigns
Pricing
MoEngage provides customized pricing options based on your business goals.
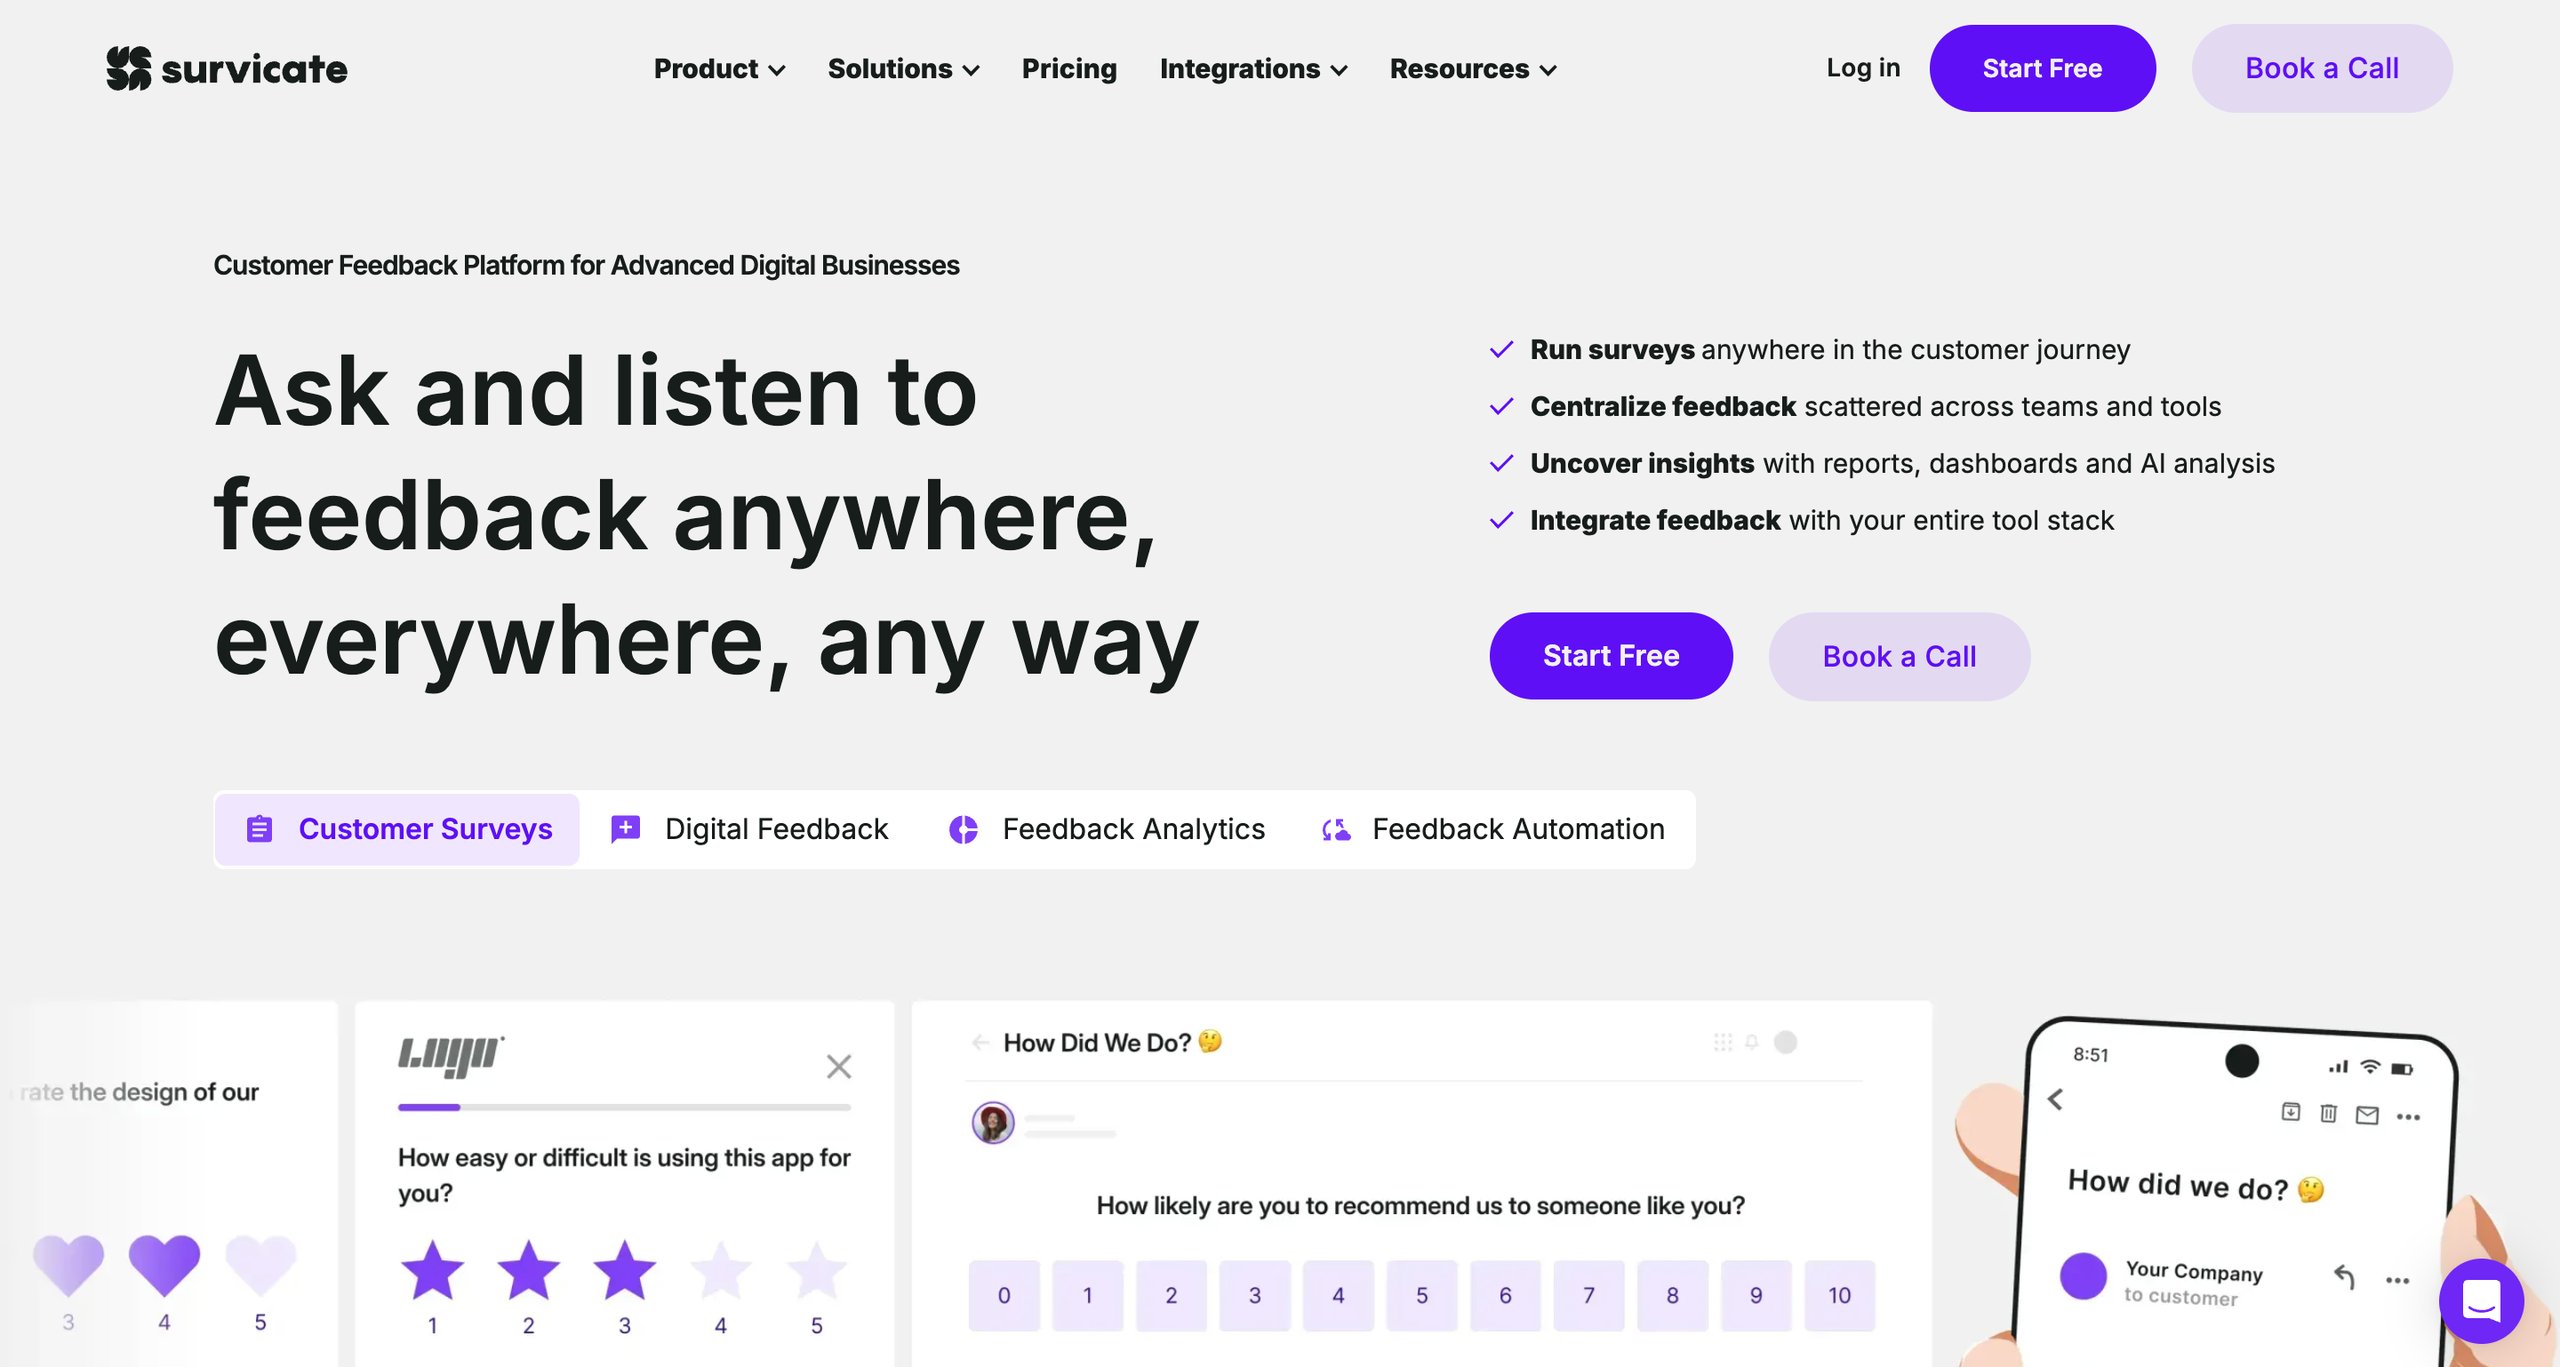
14. Survicate
Survicate simplifies mobile app feedback collection with an effortless setup. Create in-app surveys and gather actionable insights to improve usability, improve user experience, and address issues quickly.
With customizable survey designs and compatibility across all devices, the tool offers a seamless experience for users.
Survicate also allows you to create recurring surveys and leverage real-time analytics for efficient feedback management, helping you enhance customer retention and satisfaction.
Pros
Easy setup, useful templates, and an overall intuitive analytics overview
Useful integrations with Slack and other third-party tools
The ability to analyze trends, and segment data helps identify patterns and make data-driven decisions
Cons
The Basic plan offers limited options for customization
Insufficient data about the number of users who abandoned a survey
Aggregation of results across different surveys is not possible
Pricing
Survicate offers a paid plan of $149/month with a limit of 500 monthly responses.
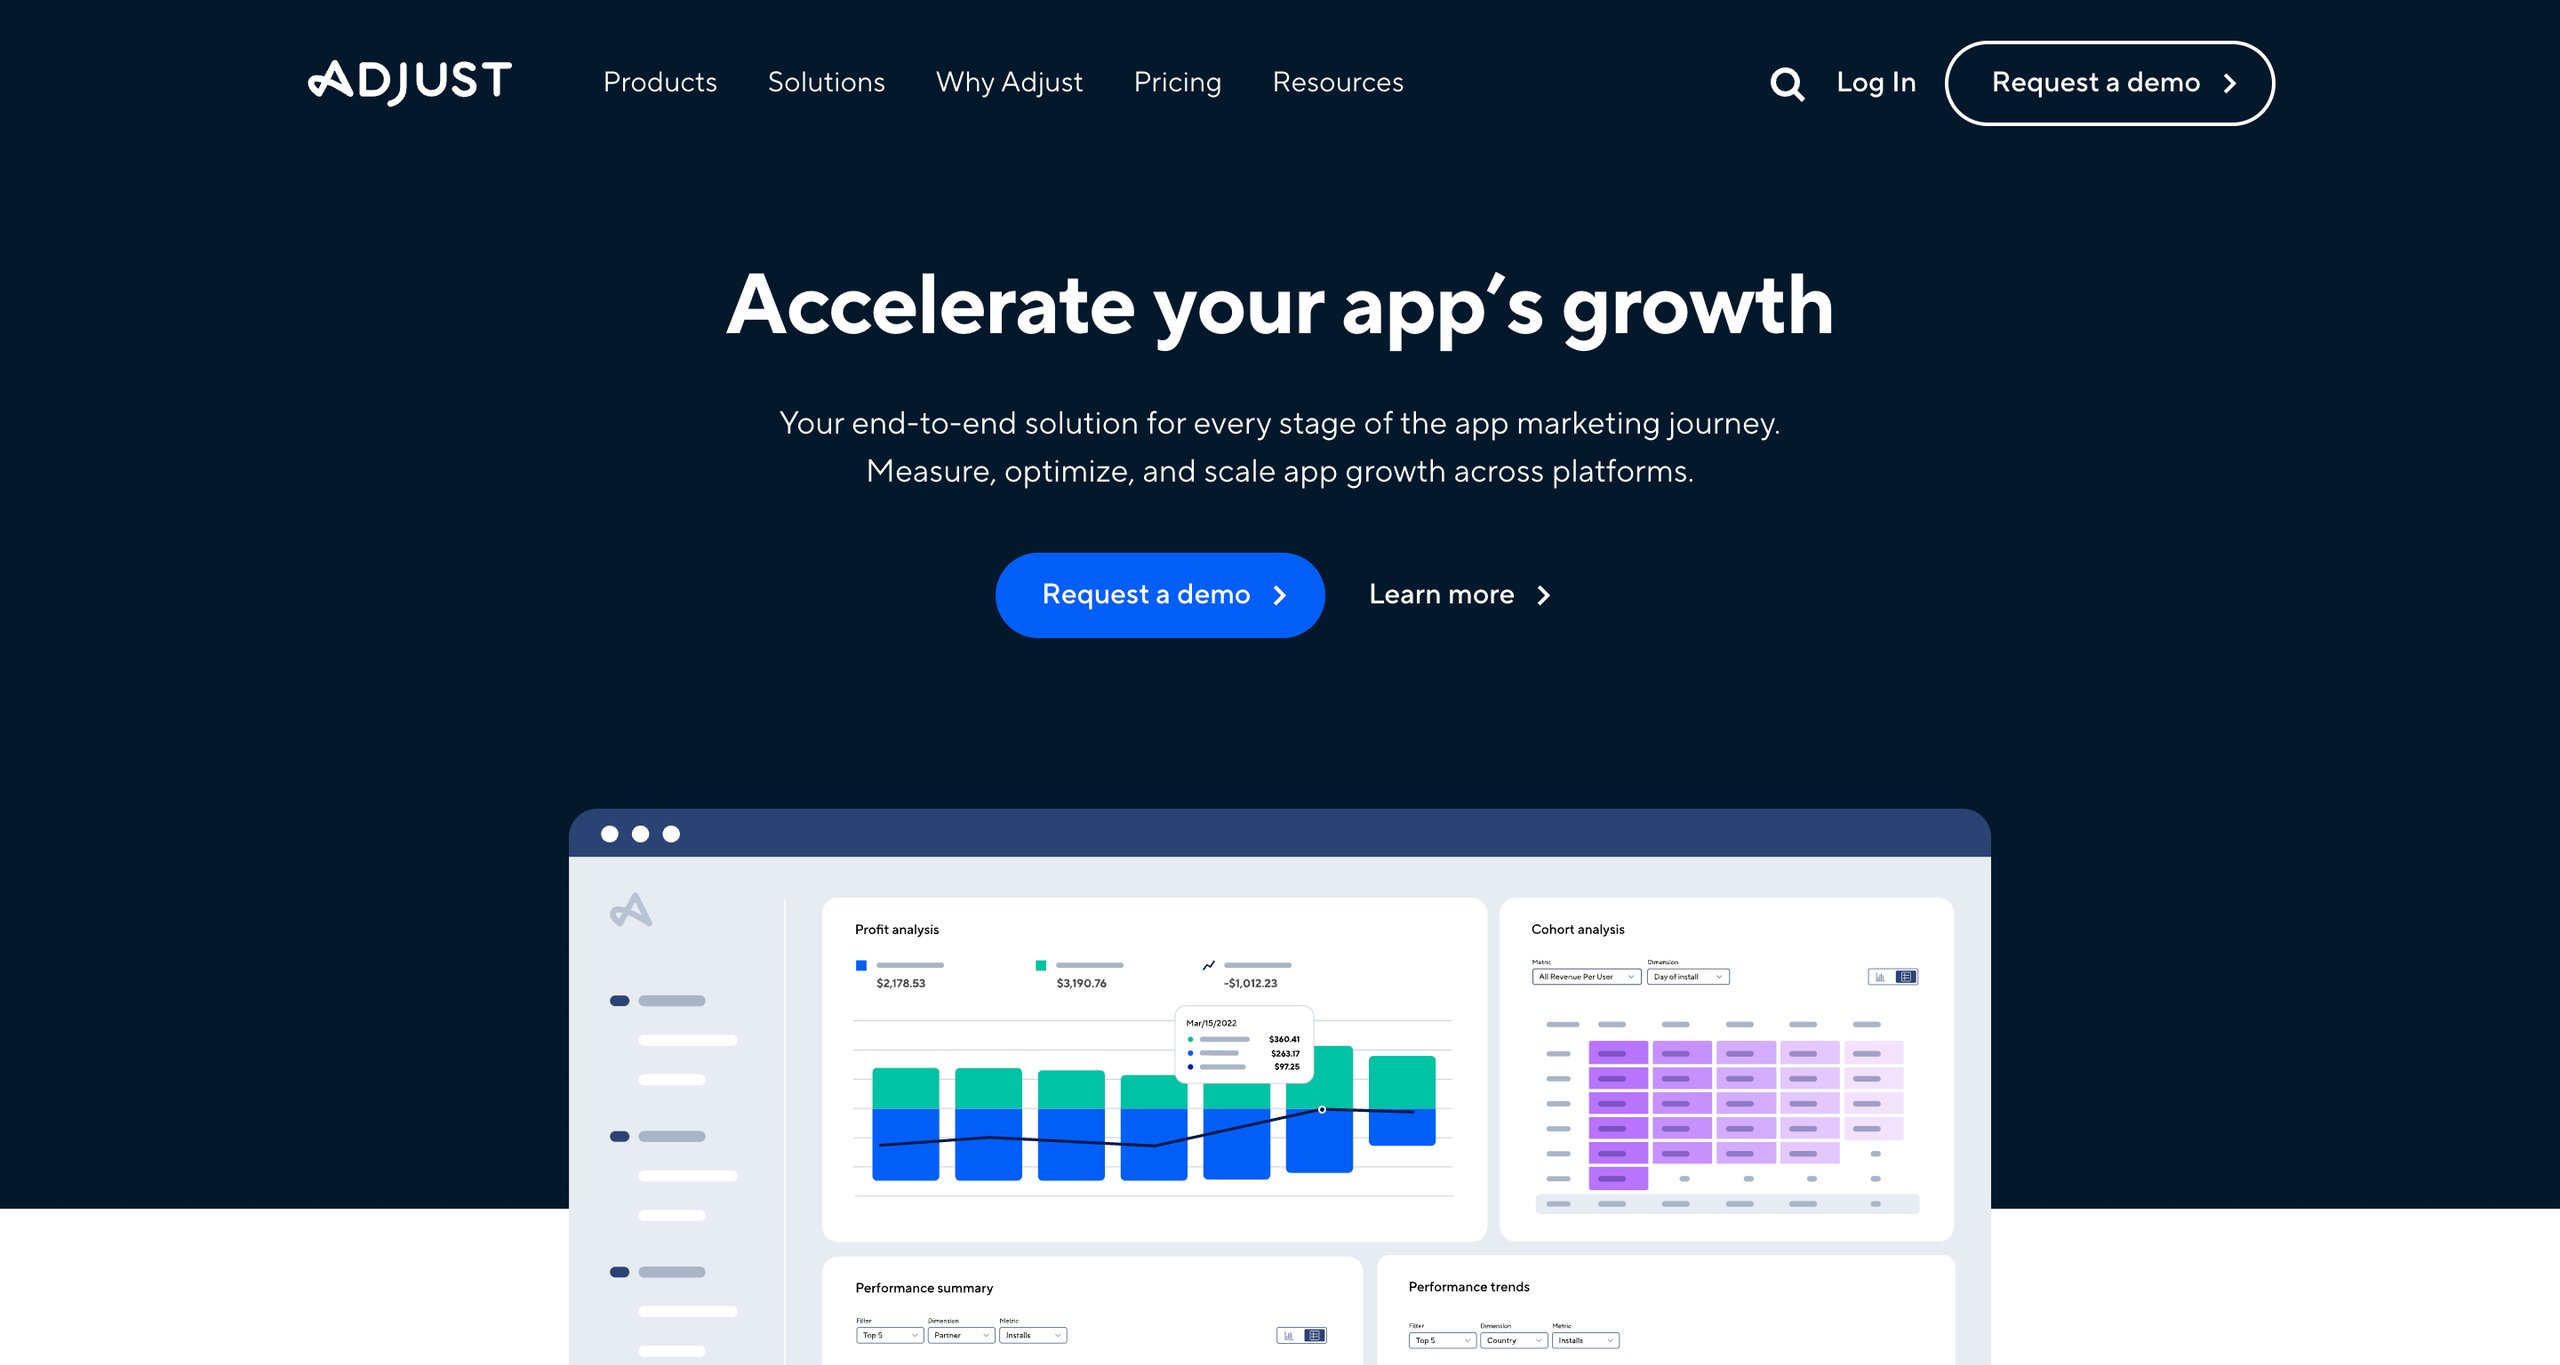
15. Adjust
Adjust is a robust analytics and attribution platform that enables businesses to monitor KPIs, optimize ROI, and gain a holistic view of the app’s performance.
It offers intuitive dashboards along with real-time reporting and makes it easy to track user acquisition, ad performance, and cohort trends.
Adjust offers unlimited access to historical data and ensures businesses can connect the dots between ad spend, revenue, and user behavior to drive impactful campaigns.
Top features of Adjust
Performance insights, cross-channel revenue, real-time CTV campaign analysis, cohort analysis, and unlimited access to historical data.
Pros
Intuitive dashboards, easy-to-understand reports, and simple navigation
Ability to create micro cohorts and export them to other platforms
Useful for optimizing ad spend and growing the overall user base
Cons
Complex setup and configuration may require technical expertise
Visualization of graphical reports can be confusing for new users
Difficult to create custom links and new audience filters
Pricing
Adjust offers a free plan for up to 1,500 monthly attributions, while paid plans are customized according to your goals and requirements.
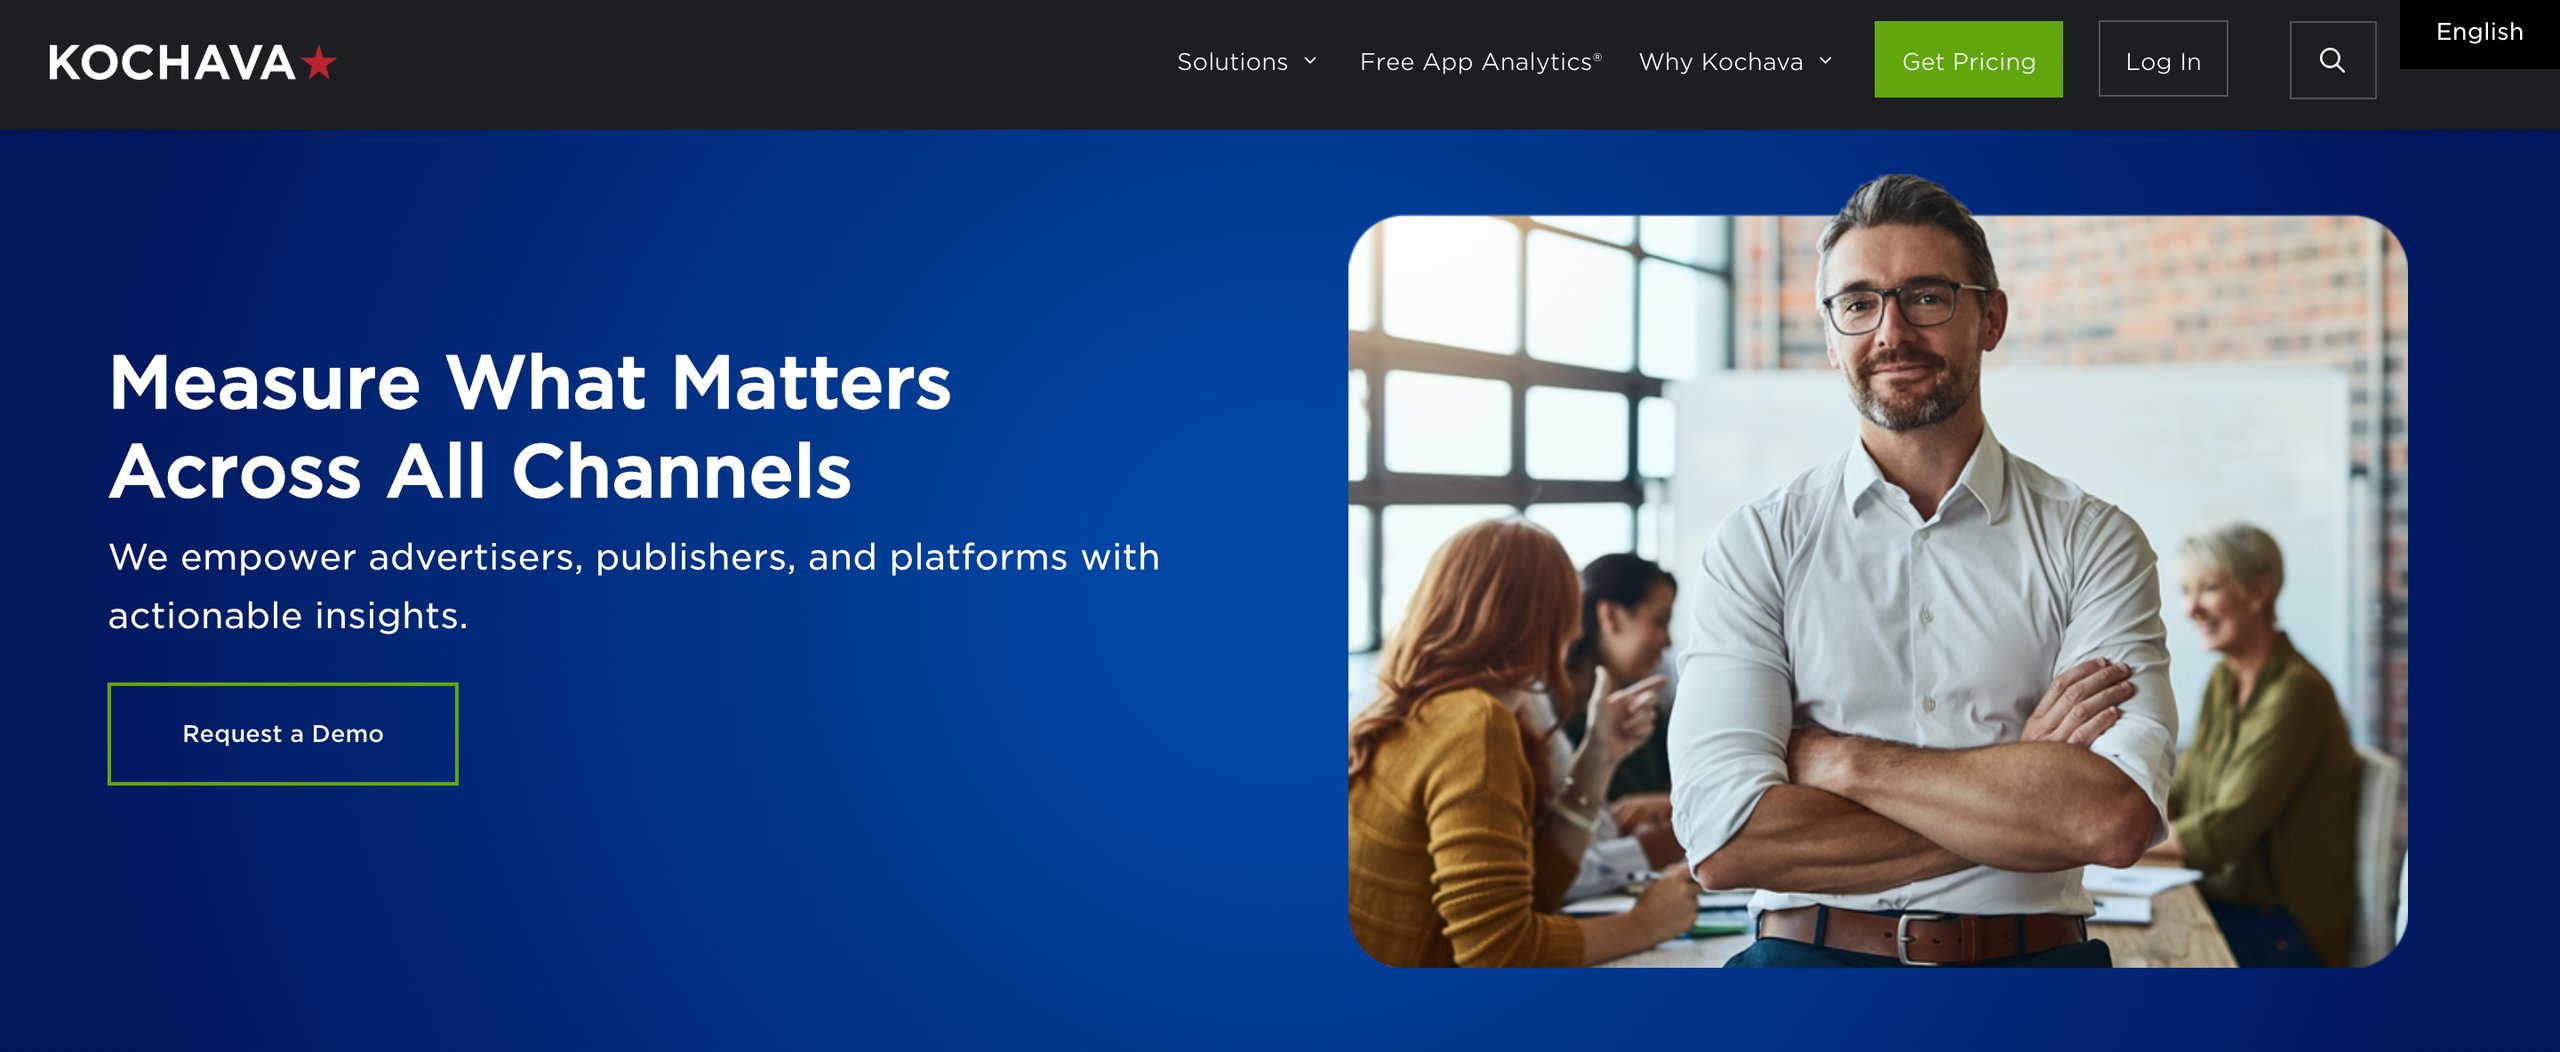
16. Kochava
Kochava provides real-time app analytics that allows marketers to visualize and optimize campaign performance instantly.
With cross-platform capabilities and interactive views, the tool enables marketers to track key metrics such as active users, revenue per user, and more, allowing them to make data-driven decisions quickly.
Kochava also offers flexible filter options and customizable reporting features, which make it easy for users to drill down into performance data and identify key trends.
Top features of Kochava
Visualization of key metrics, funnel analysis, custom filters, and custom reports.
Pros
Build custom segments with multiple filters to run targeted campaigns
Helps in attributing user conversions to the right touchpoints
Fraud detection algorithms to maintain the integrity of different ad campaigns
Cons
Limited data retention for crucial events like app installs and product purchase
Users may find it difficult to navigate the platform’s interface
Graphical representation of the data flow can be made better
Pricing
Kochava has a free plan that includes up to 10k conversions/month, while the paid plans begin at $500/month for up to 33k conversions/month.
17. Singular
Singular (recently acquired Apsalar) is a mobile analytics platform that unifies data collection, standardization, and reporting to enable faster decision-making and reduce operational costs.
It provides tools to analyze ROI, automate data workflows, and customize dashboards, empowering teams to make data-driven decisions and improve overall performance.
Singular helps businesses improve ROI, align monetization with user acquisition, and protect budgets with advanced fraud prevention tools.
Top features of Singular
Pre-configured and custom reports, automated data collection, custom dashboards, real-time campaign monitoring, and fraud prevention with 50+ customizable methods.
Pros
The attribution model can be tailored to the unique needs of each company
Easy to build new campaigns and target specific funnels based on the insights provided
The user interface is easy to navigate and explore, even for non-tech users
Cons
Limited integrations might result in customers spending more time on onboarding new partners
Long response times and other timezone issues with customer support
Slow load times and limited flexibility with the data reports
Pricing
Singular offers a free plan with a limit of 15k paid conversions. The Growth plan charges $0.05 per conversion, while the Enterprise plan offers customized pricing options.
18. App Radar
App Radar is an app store performance tracking tool that consolidates essential metrics across platforms like Google Play Console, App Store Connect, ad platforms, and app store optimization (ASO) tools into a single dashboard.
It empowers users to monitor app installs, conversion rates, and keyword rankings and provides tools for analyzing app health, audience engagement, and market trends.
App Radar enables businesses to spend less time consolidating data and more time identifying growth opportunities, optimizing ASO strategies, and tracking global app performance.
Top features of App Radar
Unified metrics tracking, keyword rankings and analysis, app health monitoring, performance alerts, global audience analysis, and competitor insights.
Pros
Great for gathering market insights and conducting keyword research
In-depth insights about performance metrics that aid decision-making
Easy to identify missed keyword opportunities and find ways to rank for them organically
Cons
Lacks some important features that are available in other similar tools
Frequent logouts and recurring bugs can impact usability
Pricing model needs improvement and certain features could be made optional
Pricing
App Radar offers an Essentials Pack at €69/month or approximately $71/month. Other plans include the Growth Pack at €169/month and the Scale Pack at €299/month.
A customer review as per G2
AppRadar is a great tool for any company that wants to improve its ASO score, monitor the status of its app, and keep an eye on competitors’ activities. Integration and implementation with the tool is simple, although keep in mind that if major changes are made on AppRadar’s side, you may need to redo it (fortunately, it’s only a few clicks).
Karolina C
Marketing Specialist
19. App Analytics – App Store Connect
App Analytics, available through App Store Connect, empowers app owners with comprehensive insights into app performance, user engagement, and financial trends.
App Store Connect is Apple’s platform for developers to manage their apps on the App Store. With no additional technical implementation required, it provides an in-depth view of how users discover, engage with, and purchase apps.
App Analytics offers a unified platform for analytics and enables data-driven decision-making for better engagement and retention.
Top features of Apple Analytics
App Store performance tracking, insights for in-app events, usage monitoring, paying user trends, pre-order data, subscription activity tracking, sales, and financial reporting.
Pros
Offers a range of functionalities like management of in-app purchases
Trusted source for gathering key metrics like user engagement and retention
Benchmark download rates and retention to compare performance with similar apps
Cons
Limited to App Store data and does not integrate with other marketing or analytics tools
Lacks in-depth analytics for engagement and user behavior
The annual fee of $99 can be too high for individual developers or small startups
Pricing
App Store Connect charges an annual subscription fee of $99.
20. Adobe Analytics
Adobe Analytics offers a comprehensive solution for analyzing visitor behavior across web and mobile platforms.
It leverages real-time data to provide AI-driven insights and flexible reporting options so businesses can uncover actionable insights and boost marketing performance.
Adobe Analytics offers intuitive dashboards and robust data integration capabilities that enable teams across the organization to make informed, data-driven decisions and optimize the mobile app experience.
Top features of Adobe Analytics
Real-time data collection, flexible data views, audience segmentation, cohort analysis, seamless data integration, and AI-powered dashboards.
Pros
Easy to manage mobile app tracking and ensure that events are firing as needed
Seamlessly integrates analytics, marketing, and content management tools
Enables users to easily communicate and collaborate on projects
Cons
Complex data reports and steep learning curve, especially for non-tech users
An expensive option for startups or small businesses
Onboarding and implementation can be time-consuming
Pricing
Adobe Analytics offers customized pricing based on your goals and requirements.
We’re designing for humans who are imperfect. So, you don’t have to worry a lot about building perfect products. There might be times when you will have to make decisions that would be best for users, but in order to make money, you might have to do it some other way. Make those decisions consciously and try to be as well-informed as you can.
Localytics is a mobile app marketing and analytics platform that offers a suite of features aimed at preventing churn, improving user experience, and boosting retention.
It provides real-time insights into user behavior, enables personalized engagement through a variety of channels, and supports advanced segmentation and predictive analytics.
Localytics is a great mobile app analytics tool for businesses looking to build stronger customer relationships and improve their app’s performance.
Easy to build complex segmentation queries that pull in different factors
Simplifies the process of creating, sending, and looking up various events and attributes
Serves multiple purposes like acquisition, engagement, retention, and reactivation
Cons
Limited options to share and export data
Viewing data across Android and iOS platforms can be challenging
Lacks advanced capabilities as compared to other mobile app analytics tools
Pricing
Localytics offers custom pricing plans for businesses.
22. Houseware
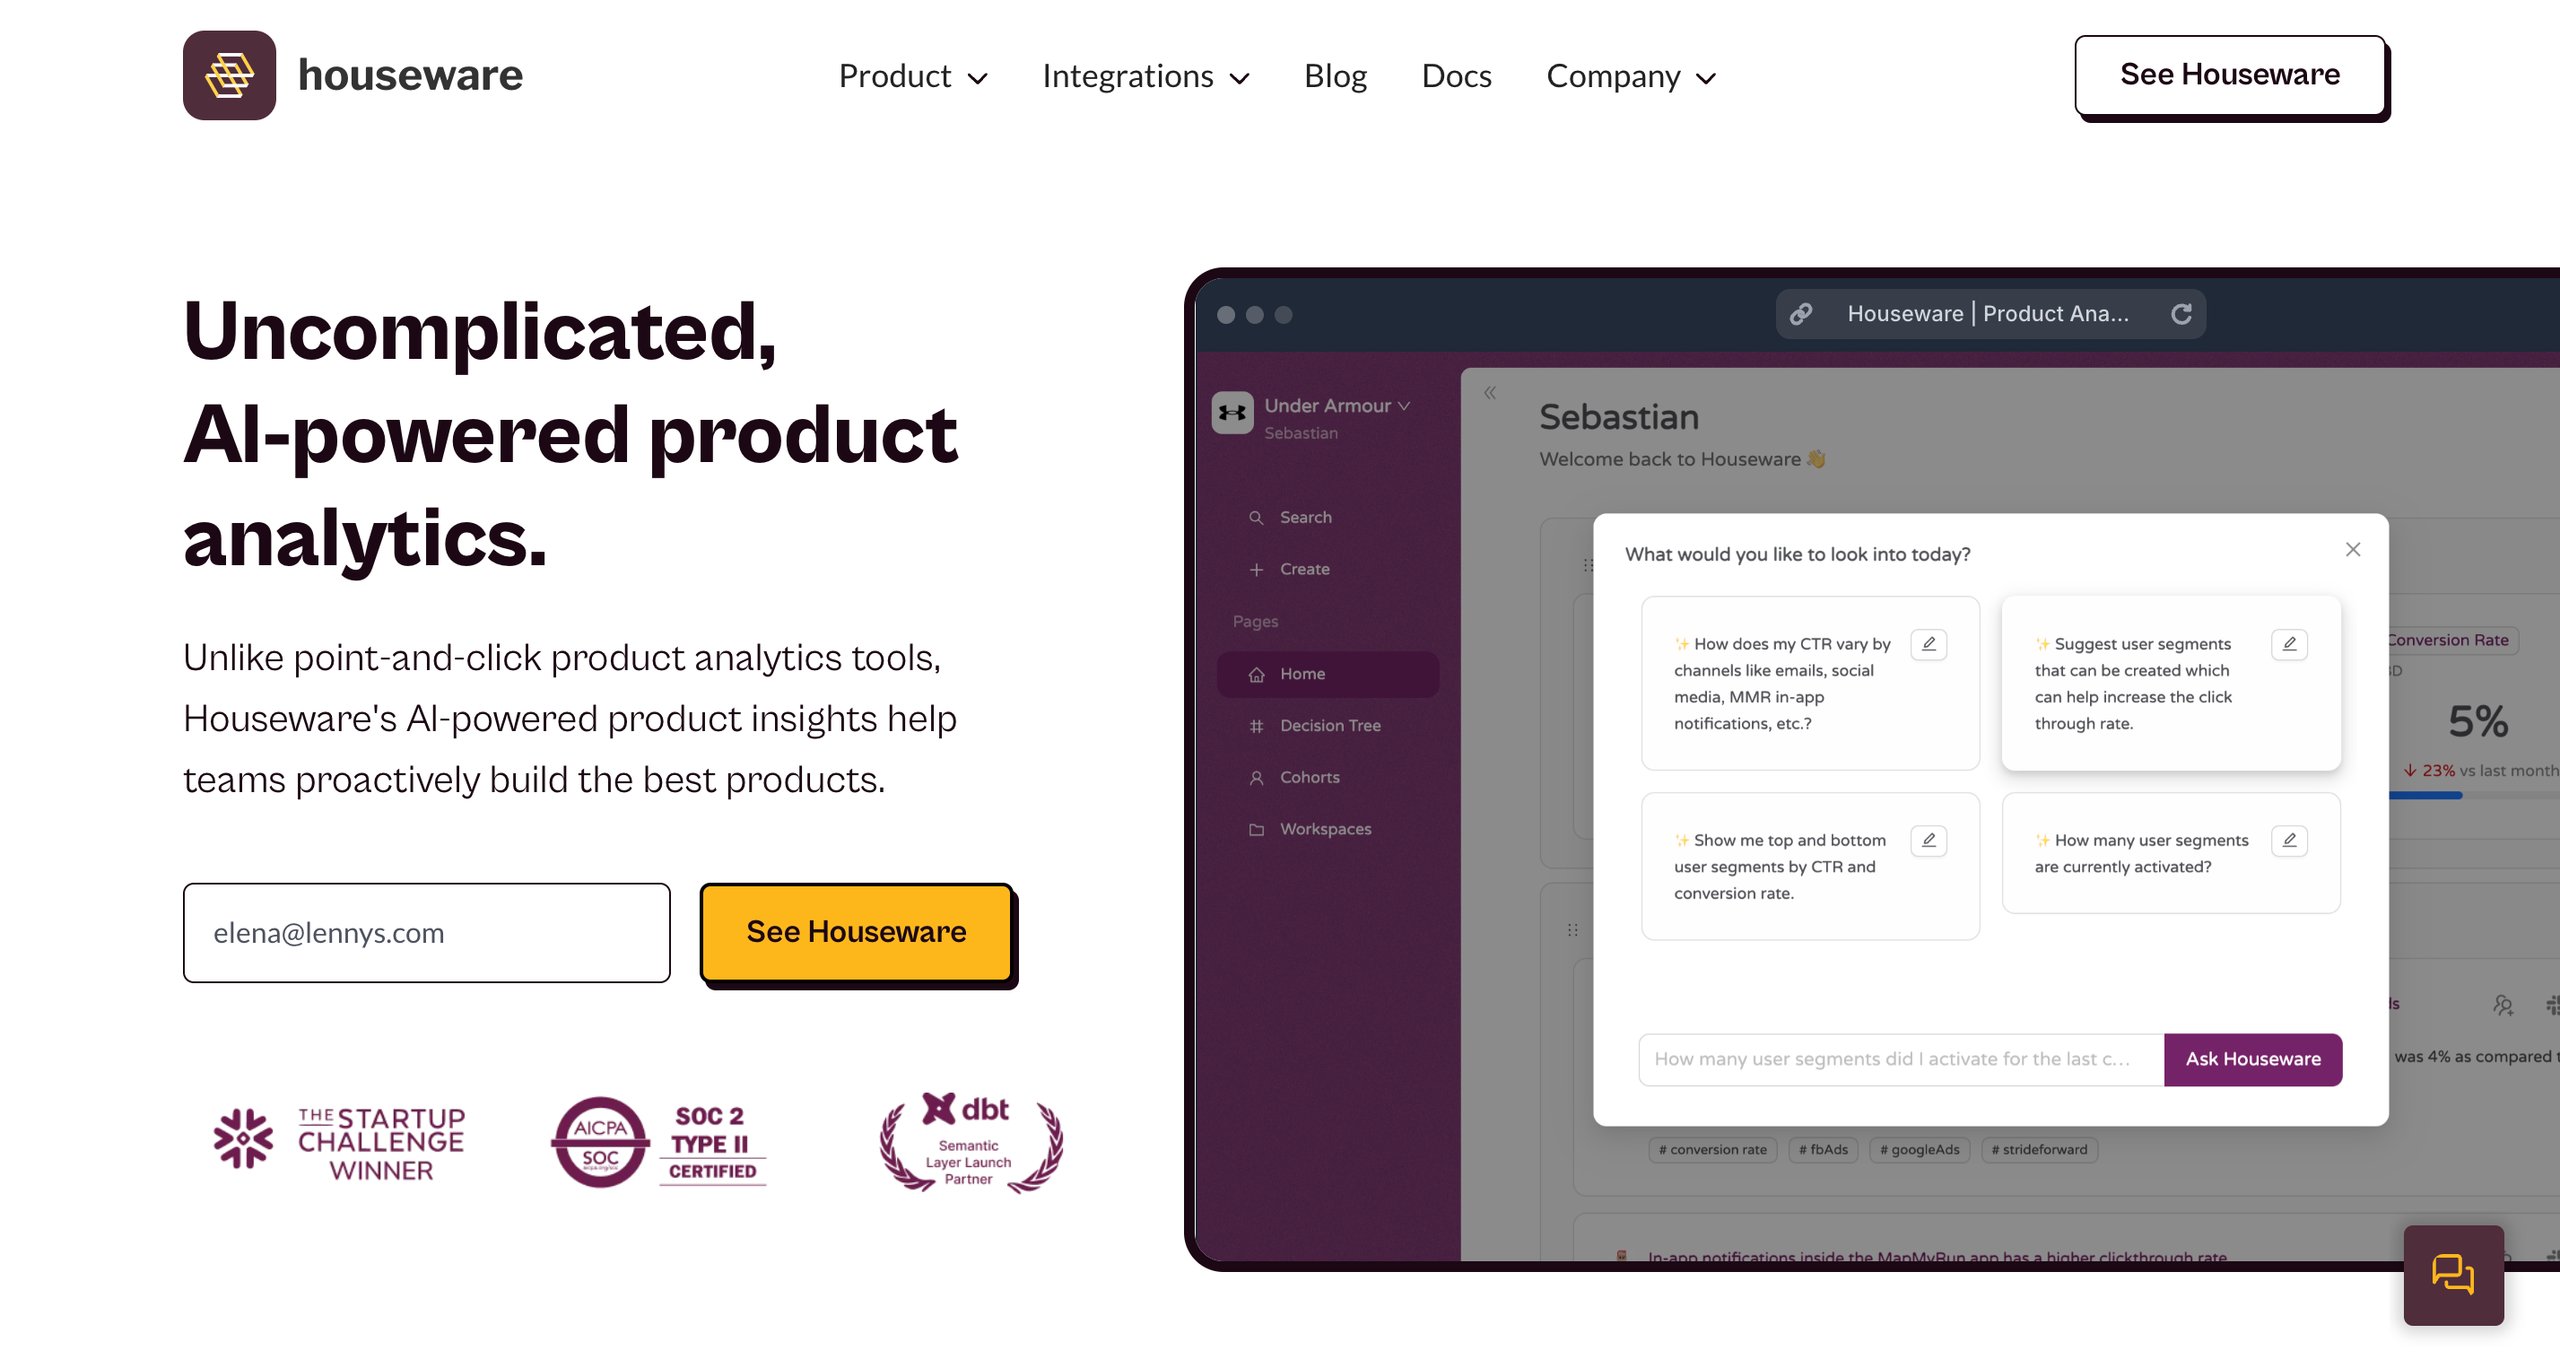
Houseware offers AI-powered product analytics that helps teams build the best products by simplifying data insights and eliminating the complexity of traditional analytics tools.
It offers seamless integration with a variety of data sources, enabling product managers and growth teams to make smarter decisions and optimize workflows.
Houseware empowers teams to proactively discover behavior patterns, drive long-term growth, and make data-driven decisions to improve the customer journey.
Top features of Houseware
AI-powered insights, seamless integrations, quick setup, and CDP integrations.
Pros
Intuitive charts and data visualization make analysis easy
Gives a holistic view of different user journeys across various pages
Low low-code environment makes it easy to build and manage funnels
Cons
New users or non-tech users may experience a steep learning curve
Requires integration with more platforms to cover alternate data sources
The look and feel of the platform, especially the UI/UX can be improved
Pricing
Houseware offers tailored pricing options based on your goals and objectives.
23. AppMetrica
AppMetrica is a powerful analytics and marketing platform that helps product managers, analysts, and growth teams track key app metrics to optimize user acquisition, retention, and monetization strategies.
With its user-friendly interface and no-code features, the platform enables teams to make data-driven decisions, boost revenue, and improve product experiences.
Whether you’re tracking user behavior, segmenting audiences, or launching personalized campaigns, AppMetrica provides all the tools you need in one place to enhance your app’s performance.
Longer data retention periods make analysis more impactful
Quick setup, user-friendly interface, and in-depth segmentation capabilities
Offers integrations with a large number of marketing platforms and ad networks
Cons
Does not have in-built fraud detection capabilities
Building dashboards for different goals can be challenging
Lacks reports on ad spend or return on ad spend (ROAS)
Pricing
AppMetrica offers custom pricing options according to a brand’s requirements.
24. Google AdMob
Google AdMob helps app developers generate more revenue through in-app ads, offering powerful tools and insights to maximize earnings.
By integrating AdMob, developers can take advantage of a global ad network and sophisticated monetization technology, ensuring better ad performance across various app categories.
AdMob’s actionable analytics provide deep insights into user behavior, while the automated tools streamline the ad mediation process and the advanced features further enhance revenue potential.
Top features of Google AdMob
Global reach, advanced monetization, in-depth insights, integration with Firebase, and real-time bidding.
Pros
Setup and installation are made easier with detailed documentation for each step
Seamless integrations with other Google services
User-friendly interface, and effective real-time reporting
Cons
Optimizing the format and placement of ads can be a challenging task
Long response times and no option for direct chat with customer support
Reporting and analytics features need to be improved
Pricing
Google AdMob is free.
A customer review as per G2
Google AdMob stands out for its smooth integration with other Google services and its strong ad management capacities. This platform has comprehensive analytics and reporting tools that allow for thorough performance tracking. It is very user-friendly and offers a variety of ad options, which make it possible to maximize ad revenues effectively.
Rekha S
Software Developer
Why analytics are essential for mobile apps
Tracking and measuring app analytics is crucial for the success and growth of any business.
They enable app developers, marketers, and product managers to make informed decisions that drive user engagement, improve retention, and optimize app UX.
Benefits of Mobile App Analytics Tools
Understand user intent
Optimize onboarding experience
Target key user segments
Detect friction points and reduce churn
Boost feature adoption
Download this free eBook to explore an effective 5-step framework to identify hidden UX issues, analyze user behavior, and build an experience that resonates with your users.
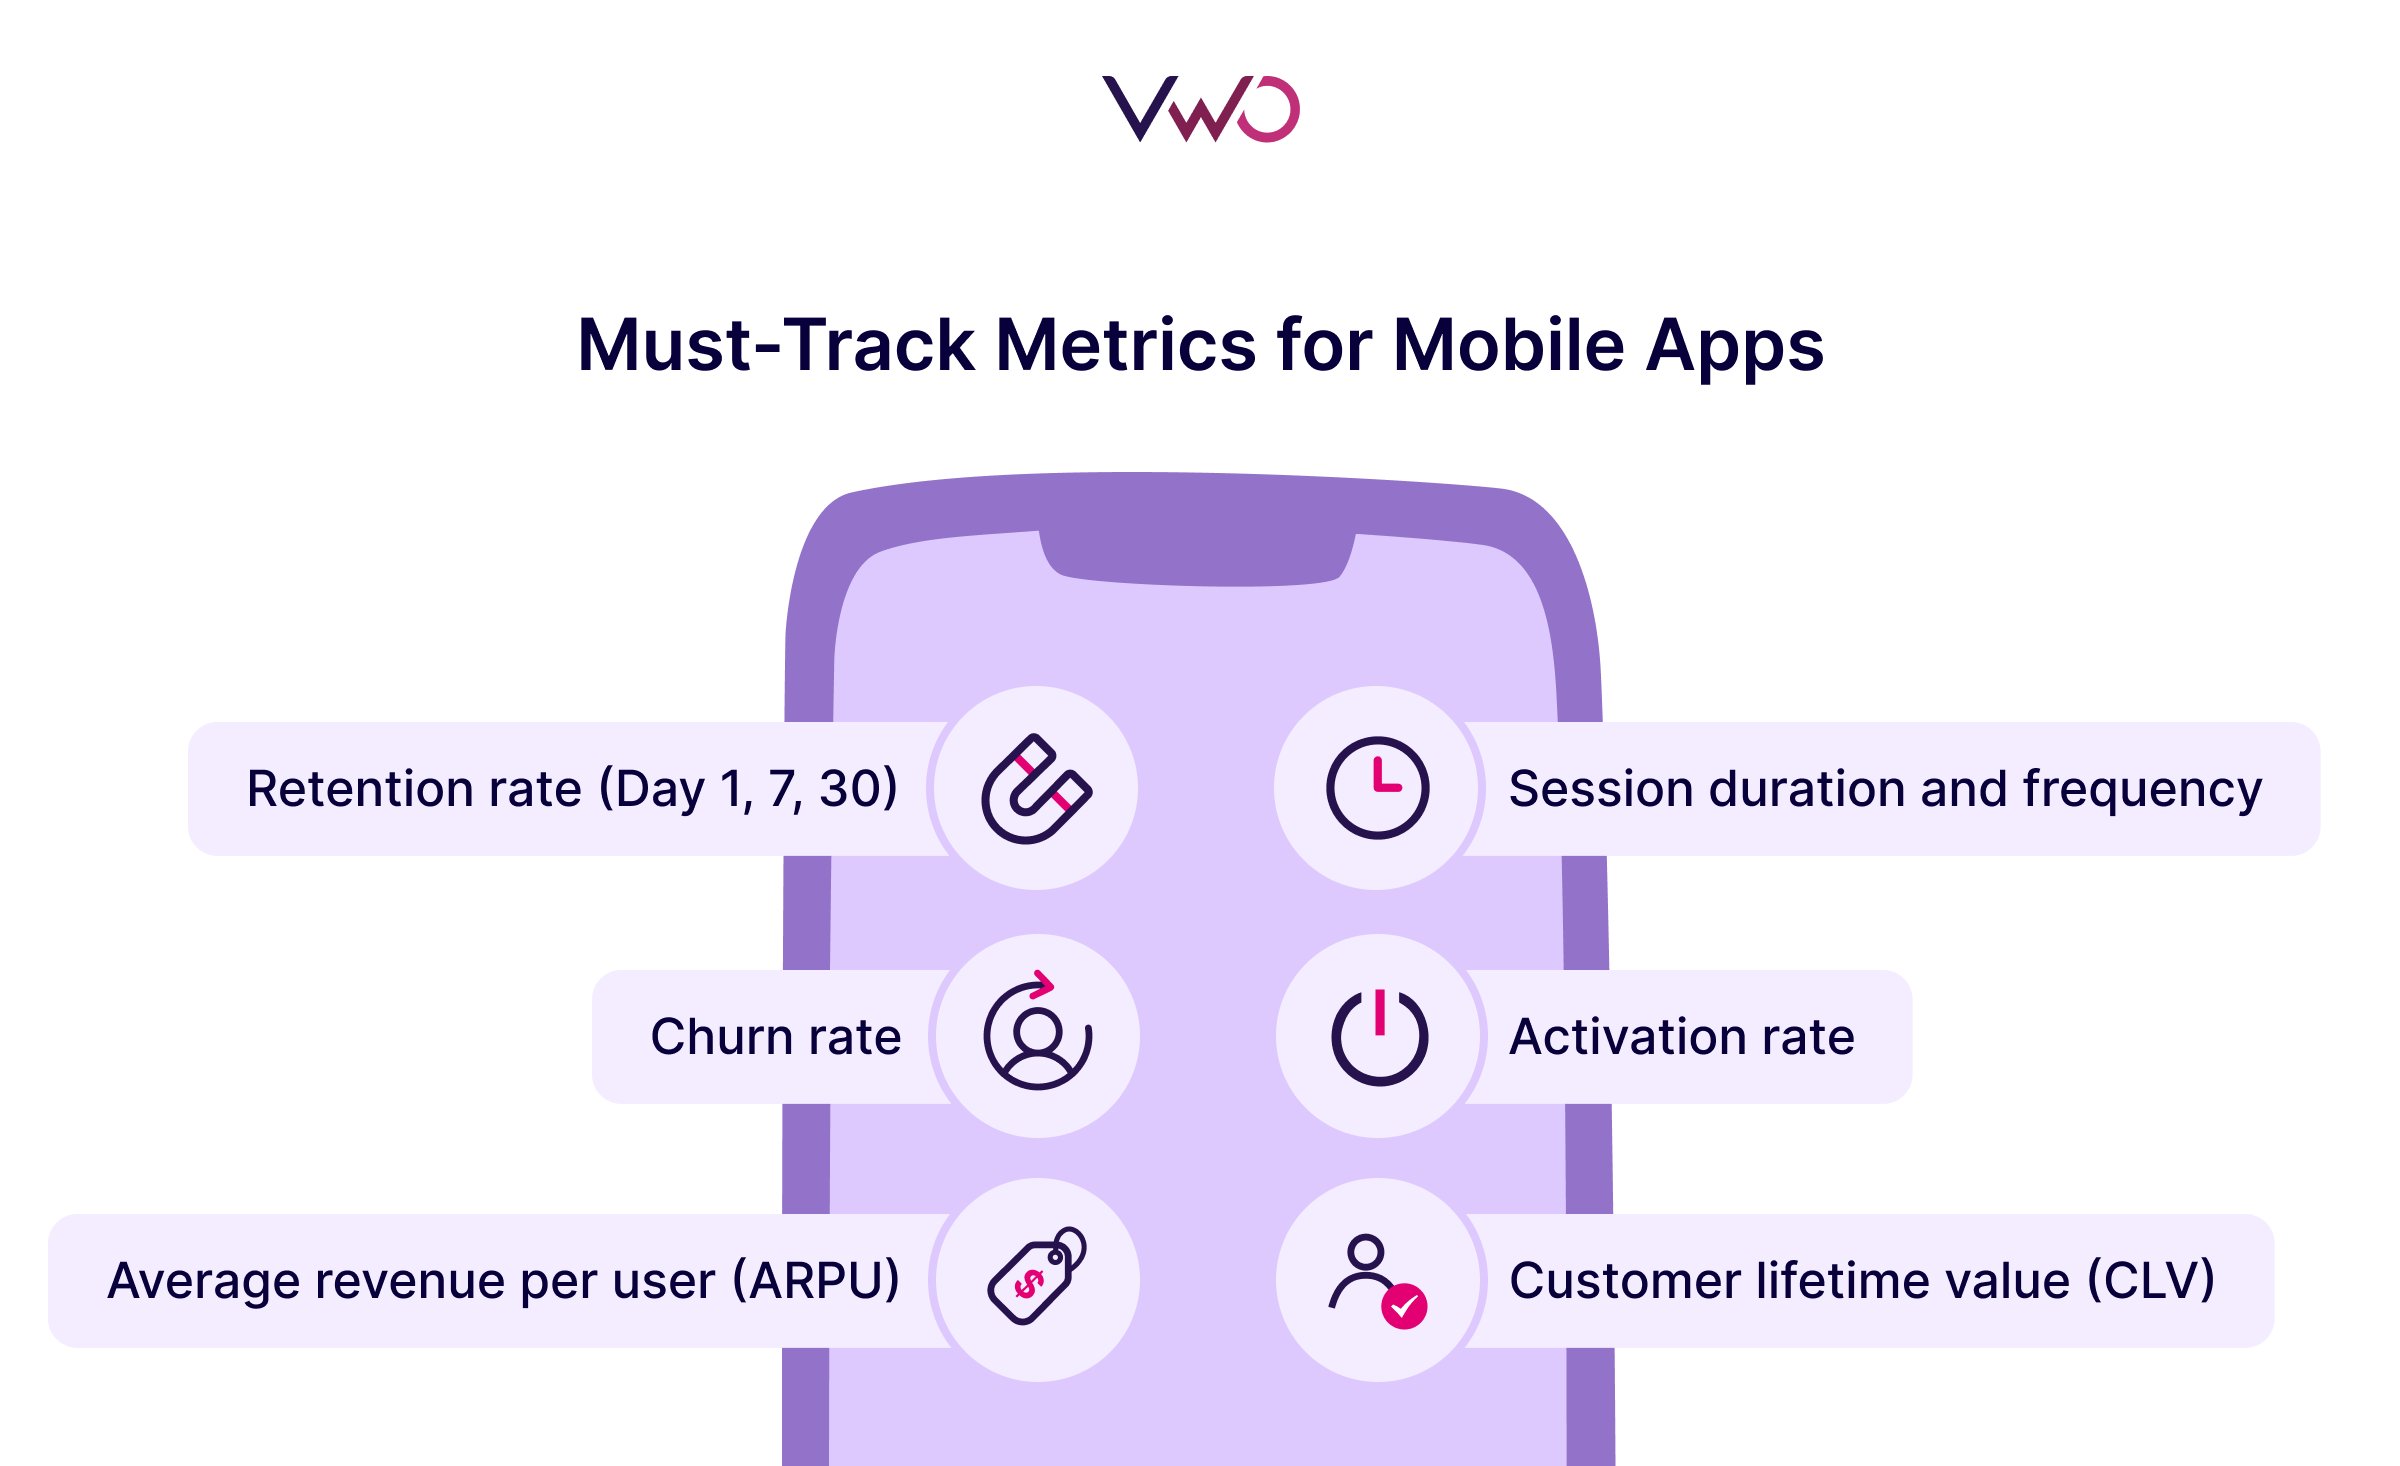
Key KPIs to monitor in mobile app analytics
When tracking the success of a mobile app, it’s easy to focus on common KPIs like downloads or active users.
While these are essential, many valuable KPIs are often overlooked, and these can provide deeper insights into the health and growth of your app.
Here are some key KPIs to monitor, along with those that tend to fly under the radar.
1. Retention rate (Day 1, 7, 30)
Most businesses track active users on their apps. However, understanding how many users return after a day, a week, or a month is also crucial as it directly reflects the app’s ability to engage users over time.
Also, retention rates are often more important than initial downloads because they show whether your app can deliver value consistently.
2. Customer lifetime value (CLV)
CLV is a predictive metric that shows how much revenue you can expect from a single user over their entire lifecycle with your app.
This goes beyond just looking at how much money a user spends; it also factors in user engagement and retention.
High CLV means your app not only attracts users but keeps them engaged in ways that add long-term value.
3. Average revenue per user (ARPU)
ARPU measures how much revenue you generate per user, whether through in-app purchases, subscriptions, or ads.
It’s a simple but powerful metric to track the monetization efficiency of your app.
Tracking ARPU by user segments (e.g., geographical location, device type) can offer insights into where to focus your marketing efforts.
4. Session duration and frequency
Tracking how long users spend on your app and how often they return is vital for understanding user engagement.
If you notice users not frequently opening the app, but when they do, they spend a lot of time, it might be an indication that the user journey needs some fine-tuning.
Frequent, short sessions can also suggest that the app is well-integrated into users’ daily routines.
5. Churn rate
The churn rate measures the percentage of users who stop using your app over a given period.
A high churn rate is a red flag, indicating problems with user experience, app value, or unmet expectations.
It’s an important metric to understand because it can guide you on areas needing improvement, such as onboarding or feature adoption.
6. Activation rate
Activation rate tracks specific actions that users take during the onboarding process, boosting the chances of long-term engagement and retention.
This is particularly important as it often marks the moment when users experience the core value of the app for the first time, setting the tone for the rest of their experience.
If users don’t quickly realize the app’s benefits, they are far less likely to stay engaged, which increases the risk of churn.
How to pick the best mobile analytics tool for your needs?
Choosing the right mobile analytics tool can make a big difference in how effectively you understand and grow your app.
While the basics like cost, features, and scalability matter, other factors can play a critical role in finding the perfect fit for your specific needs.
The time users spend on your app is limited. You cannot expect the user to go through every journey or explore every section of your app. So, you need to design or optimize your app in a way that users do not have to hunt for whatever they’re looking for, instead, you should be able to deliver the experience they want in a personalized way.
1. Ensure the tool’s capabilities align with your goals
Are you focusing on user acquisition, retention, or revenue growth? Look for tools that specialize in tracking metrics tied to your goals.
For example, a gaming app might prioritize engagement and retention features, while an eCommerce app would benefit from robust funnel analysis and purchase behavior tracking.
2. Verify cross-platform and omnichannel support
If your app is available on multiple platforms (iOS, Android, web), the mobile analytics tool should also offer seamless cross-platform tracking.
This ensures you get a unified view of user behavior, regardless of where they interact with your app.
3. Assess integration with existing tools
Choose a tool that integrates well with your existing tech stack.
Whether it’s your customer data platform (CDP), customer relationship management (CRM) system, or marketing automation software, seamless integration ensures smooth workflows and data consistency.
4. Test user-friendliness
A powerful tool is only effective if your team can use it efficiently.
Request a demo or trial to assess how intuitive the interface is and whether non-technical team members can easily navigate it without requiring extensive training.
Transform user insights into actionable tests with VWO
Apart from the above tools, you’ll also find these capabilities within VWO.
With features like mobile app heatmaps and session recordings, you can track every action that users take on your app and pinpoint the factors that influence their decisions.
Also, you can analyze entire user journeys with funnel analysis to identify key drop-off points or friction areas that need to be optimized.
The best part about VWO is how it seamlessly integrates behavioral analysis with mobile app testing.
Once you’ve gathered critical insights about user behavior on your app, you can leverage these observations to build solid hypotheses and run A/B tests to build experiences that resonate with your users.
VWO Insights for Mobile Apps helps to improve the customer journeys. It also improves sales with A/B testing and deep analysis of user behavior.
And since all of these capabilities are integrated into one platform, you can manage and scale your mobile app optimization efforts in a smart, efficient way.
Final thoughts
This list will give you a clear picture of the strengths, capabilities, and pricing of the top mobile app analytics tools.
Request a demo today and explore the powerful capabilities of VWO Insights for Mobile Apps to drive revenue and growth for your business.
FAQs
Q1. What is mobile app analytics?
Mobile app analytics involves tracking, collecting, and analyzing data from your mobile app to understand user behavior, engagement, and app performance. It helps you measure metrics like downloads, retention rates, session durations, and conversions, providing actionable insights to optimize your app for better results.
Q2. Why is mobile app analytics important for app growth?
Mobile app analytics is crucial for app growth because it enables businesses to understand user behavior, optimize app experience, boost retention and engagement, drive revenue, and make data-driven decisions.
Q3. What are the best mobile app analytics tools?
Some of the best mobile app analytics tools include VWO Insights for Mobile Apps, UXCam, Mixpanel, Amplitude, Kochava, AppDynamics, MoEngage and Smartlook. Each tool has unique features tailored for tracking user behavior, retention, monetization, and more.
Q4. What are the key techniques for analyzing the performance of a mobile app?
Some important steps to analyze mobile app performance include cohort analysis, funnel analysis, crash analysis, observing heatmaps and session recordings, tracking churn and retention data, and gathering feedback from end users.
Q5. What are mobile analytics tools?
Mobile analytics tools are platforms that collect, process, and provide insights into user behavior, app performance, and engagement metrics. These tools help app developers and businesses make data-driven decisions to optimize the app experience and improve key metrics such as retention, acquisition, and monetization.
Q6. Can you use Google Analytics for mobile apps?
Yes, you can use Google Analytics for mobile apps by installing Google’s Firebase SDK, which is specifically designed for mobile apps. It offers features such as event tracking, user engagement metrics, crash analytics, and integration with other Google services, making it an ideal choice for mobile app analytics.
Q7. What is app analytics?
App analytics is the practice of tracking and analyzing data from mobile apps and it focuses on understanding user behavior, improving engagement, optimizing performance, and driving growth.
Q8. How to measure mobile app performance?
Here are some key steps to measure and analyze the performance of your mobile app: – Define important KPIs – Monitor user feedback – Track technical performance – Gather insights into user behavior – Conduct A/B testing
Q9. What are app analytics services?
App analytics services are platforms or tools that provide businesses with data-driven insights into app performance, user behavior, and engagement. These services help businesses track important metrics, conduct experiments, and optimize their apps for better user experiences and business outcomes.
Hi, there! I’m an Associate Manager of Content at VWO with 6 years of experience in B2B and B2C marketing. I work across blogs, SEO, thought leadership, newsletters, landing pages, and a video podcast I built and manage from scratch. At VWO, I’ve gained expertise in CRO, experimentation, user behavior research, and personalization, creating content that makes complex ideas clear and actionable. Outside of work, I enjoy experimenting with memes and short-form video on Instagram.
Uncover hidden visitor insights to improve their website journey
One of our representatives will get in touch with you shortly.
Awesome! Your meeting is confirmed for at
Thank you, for sharing your details.
, you're all set to experience the VWO demo.
I can't wait to meet you on at
Account Executive
, thank you for sharing the details. Your dedicated VWO representative, will be in touch shortly to set up a time for this demo.
We're satisfied and glad we picked VWO. We're getting the ROI from our experiments.
Christoffer Kjellberg
CRO Manager
VWO has been so helpful in our optimization efforts. Testing opportunities are endless and it has allowed us to easily identify, set up, and run multiple tests at a time.
Elizabeth Levitan
Digital Optimization Specialist
As the project manager for our experimentation process, I love how the functionality of VWO allows us to get up and going quickly but also gives us the flexibility to be more complex with our testing.
Tara Rowe
Marketing Technology Manager
You don't need a website development background to make VWO work for you. The VWO support team is amazing
Elizabeth Romanski
Consumer Marketing & Analytics Manager


![10 Best Enterprise Analytics Platforms [2026]: Expert Picks with Reviews and Comparisons](https://static.wingify.com/gcp/uploads/sites/3/2025/08/Feature-image-10-Best-Enterprise-Analytics-Platforms_-In-Depth-Reviews-and-Comparisons.jpg?tr=h-600)