You’ve mastered the fundamentals. You’re already running thoughtful A/B tests and digging into behavioral analytics to decode user behavior. You’re capturing both numbers and narratives—the “what” from your tests and the “why” from heatmaps and session recordings.
But here’s the issue: your A/B tests live on one screen, heatmaps on another, and session recordings in a third. With the average enterprise juggling 120 martech tools, it’s like running a relay race where your data keeps dropping the baton.
You toggle between dashboards, compare inconsistent data sets, and try to piece together what actually happened. By the time you’ve gathered the pieces, your momentum is gone, and critical insights have slipped away.
This fragmentation slows analysis, clouds interpretation, and delays the decisions that drive real impact. The real power lies in integrated insights that reveal not just what changed, but why, with clarity, speed, and depth.

The hidden costs of a disconnected optimization stack
Using best-of-class tools for experimentation and behavioral analytics seems a smart approach. But when these tools don’t talk to each other, the fragmentation starts to quietly erode your optimization efforts. Here are the top 3 reasons why siloed tools undermine optimization:
1. Fragmented data & the correlation gap
One of the biggest challenges with fragmented tool setups is the confusion they create. You might see two outcomes that look related, but the real story is harder to uncover. This is what we call the correlation conundrum.
It refers to the misinterpretation of data when two outcomes appear related (correlated) but lack a clear cause-and-effect relationship. These incomplete data pictures lead teams to make assumptions based on surface-level metrics.
For instance, you run an A/B test. One variation outperforms the other, but the reason behind the uplift isn’t clear. To find out why, you turn to another dashboard for user behavior analytics.
In a disconnected setup, you can’t easily segment your behavioral data by test variation. Instead, you’re stuck manually cross-referencing users across tools, identifying which variation each user saw in your A/B test platform, then hunting for those same users in your session recording tool to understand their behavior patterns. For most teams, it’s just not scalable. Especially when you’re juggling multiple experiments or operating in an agile sprint cycle.
2. Workflow inefficiencies & delay in decisions
Juggling between tools creates tab fatigue and mental overload. Additionally, it also takes a psychological toll. According to insights from Maru Group, teams often fall into what’s known as “tunnel vision”, a tendency to focus on the most easily accessible data while overlooking the broader context.
This slows down decision-making, which is especially risky in CRO, where speed is critical. Friction kills momentum and slows the feedback loop. With growing pressure to deliver faster, more precise optimization in an increasingly competitive landscape, integrated insights aren’t just an added benefit, but a strategic imperative. For teams that recognize the cost of inefficiency, it’s a clear signal to adopt a more connected, streamlined system and stay ahead of the curve.
For instance, a team runs an A/B test and sees promising results in their testing platform, then has to switch to their heatmap tool to understand where users are clicking, jump to session recordings to see actual user behavior, and manually connect insights across multiple dashboards.
3. Diluted insights & the high cost
Disjointed tools can lead to costly misinterpretations. Without a unified view of user behavior and experiment data, teams often miss the full story behind performance metrics.
Take a FinTech A/B test, for example:
- Variation A: Long-form layout with FAQs.
- Variation B: Compact layout with collapsible sections.
Behavior analytics show users on Variation B spend more time and engage more, but conversions drop. Without knowing which recordings map to which variation, they assume more engagement means more interest, and roll out Variation B. What the team didn’t realize was that the increased time-on-page wasn’t a sign of interest; it was actually a result of user confusion.
Many visitors were rage-clicking on the collapsed sections, frustrated by the extra effort needed to access basic information. This costly misinterpretation could have been avoided with integrated tools.
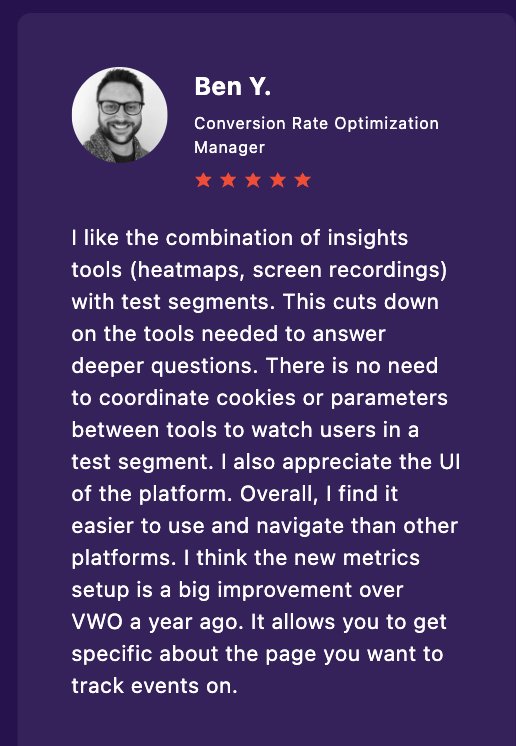
Here’s what one of our customers had to say:
The strategic power of unified experimentation and behavioral insights
As CRO programs mature, the biggest bottleneck often isn’t test velocity, it’s clarity. Here are 4 advantages teams gain when their data and behavioral signals live under one roof:
1. Seamless data correlation & segmentation
In an integrated system, you can instantly view session replays or heatmaps within your test results, filtered by variation, goal completion, or campaign source.
Say you’re testing two hero banners on your homepage:
Version A – Bold headline, upfront CTA
Version B – Video background, lower CTA
A/B test results show Version A wins. But to understand why B underperformed, you’d have to manually export segments and match data across disconnected tools.
But with the integrated solution, with one click in your A/B test dashboard, you can immediately filter session recordings to focus on that test. The problem becomes clear that users get distracted by the video and never scroll to the CTA. Those who do scroll show hesitation patterns around the video area. Now you know exactly what to fix.
VWO eliminates the need to export user segments or juggle multiple disconnected tools. With everything integrated in one platform, you can:
- Analyze variation-specific behavior – Easily compare user interactions by viewing heatmaps side by side for Control vs. Variations or Converters vs. Non-Converters. This visual comparison helps you pinpoint what’s driving engagement, hesitation, or drop-offs across segments.
- Filter recordings by test context – Watch session replays filtered by test variation, conversion events, traffic sources, or custom user segments..
This allows you to connect the dots effortlessly.
2. Faster insights through streamlined workflows
When behavioral analytics is embedded within your experimentation platform, the swivel chair disappears. The manual, back-and-forth shuffle between disconnected tools to make sense of your data becomes unnecessary. You ship smarter and quicker because everything you need is in one place.
Your workflow becomes faster and tighter—here’s how:
Let’s say your pricing page test shows a drop in sign-ups. Instead of switching between tools, you use VWO’s unified platform to dig deeper. Heatmaps reveal that users are hovering over pricing tooltips and rage-clicking on the FAQ section, indicating curiosity, but also confusion.
VWO lets you instantly pull up session recordings directly from high-activity areas on heatmaps to understand user behavior. These insights help you quickly identify friction and refine your hypothesis. You update the copy and launch a follow-up test, within the same day.
Once your follow-up test is up and running, you can start comparing heatmaps side by side and viewing session recordings to spot how user behavior is shifting. This gives you early insights into what’s working and what still needs improvement.
3. Comprehensive insights with full context
Generic behavioral analysis can highlight surface-level issues, but when filtered through the lens of test variations, user segments, and outcomes, it becomes deeply actionable. Integrated platforms like VWO provide not just isolated data points but comprehensive, contextual insights that guide faster and smarter decisions.
In fact, a study published on ResearchGate found that companies using integrated analytics platforms saw a 25% improvement in decision-making accuracy, especially in complex scenarios.
Take IMB Bank, for example. Facing significant drop-offs in its personal and home loan journeys, the team turned to VWO to uncover the full story behind user behavior.
- Session recordings revealed hesitation and confusion.
- Form analytics showed where users abandoned or skipped key fields.
- Heatmaps highlighted ignored CTAs and missed guidance cues.
- Funnel analysis provided a macro view of drop-offs.
Because all of these insights lived in a single platform—tied directly to test variations and user segments, the team could quickly diagnose problems in full context. This clarity helped them form sharp, data-backed hypotheses, showing how integrated platforms accelerate early-stage ideation. They hypothesized that users lacked clarity and confidence in the application flow.
The team launched targeted A/B tests introducing clearer instructions, step indicators, social proof, and exit-intent nudges. The impact was massive:
- 36% increase in personal loan completions
- 87% uplift in home loan conversions
- 37% more form saves and a 250% jump in completions
Comprehensive insights across tools. Full context tied to user behavior. One unified platform. That’s what drives meaningful impact, without the delays and disconnects of fragmented systems.
4. Improved team alignment and resource management
When your experimentation and behavior analytics live in one place, everyone, from product managers to designers to analysts, is looking at the same data, in the same context. There’s no chasing spreadsheets, no misaligned dashboards, and no back-and-forth between tools to reconcile insights. Instead, teams align faster, collaborate better, and move forward with confidence.
And it’s not just about smoother workflows, it’s about smarter investments too. By consolidating your stack, you reduce overhead, streamline workflows, and reallocate both time and budget toward what actually drives growth, like running more meaningful experiments, analyzing impact faster, and iterating quicker. An integrated setup becomes your team’s single source of truth, helping teams stay in sync and resources focused.
Simplify your CRO stack, amplify your results
True CRO maturity isn’t necessarily about adding more tools to your stack, but about making your existing capabilities work smarter, together. Fragmented platforms lead to missed insights, delayed decisions, and optimization efforts that fall short of their potential.
While the thought of consolidating tools might seem daunting at first, the long-term gains in efficiency, clarity, and data confidence far outweigh the initial effort.
Many tools only address individual aspects of optimization, but VWO stands out by combining all capabilities in one cohesive platform. If you’re already using VWO for testing or insights, you’re halfway there. With VWO’s integrated stack, you get the convenience of real-time insights from session replays and heatmaps, all alongside your tests.
In our upcoming posts, we’ll explore how VWO is making this integrated vision a reality, helping you connect the dots like never before.
Start your free trial today and see what’s possible when your CRO stack works as one!
Categories: