Every click on your website tells a story of interest, hesitation, frustration, or intent. But without the right tools, these stories remain untold, leaving you guessing about what works and what doesn’t.
The best click tracking tools don’t just show you where users click; they reveal hidden engagement patterns, friction points, and opportunities to optimize your website like never before. Whether you’re a marketer fine-tuning CTAs, a UX designer enhancing navigation, or a business owner boosting sales, these tools help transform observations into actionable insights to drive meaningful improvements.
In this guide, we’ll explore the top click tracking software for 2026, highlighting their features, benefits, and how they play an important part in supercharging your website’s performance.
What is click tracking software?
Click tracking software is a tool or system designed to monitor, record, and analyze user interactions with digital content, specifically focusing on “clicks” made on websites, emails, advertisements, or other online platforms.
It tracks where, when, and how often users click on specific elements, such as links, buttons, images, or ads—providing detailed insights into user behavior and engagement. This data helps businesses, marketers, and website owners optimize their strategies, improve user experience, and increase conversions.
Free trial: 14 days of the Business plan with up to 5000 sessions. Free: Includes base-level sessions and storage. Paid: Pricing is not mentioned on the website.
Free trial: 14 days on all paid plans. Free: Forever with limits on all features. Paid: Starts from $21/month, billed annually.
1. VWO
VWO Insights – Web is a user behavior analytics tool that helps businesses understand how visitors interact with their websites. It combines session recordings, heatmaps, on-page surveys, and more to provide deep insights into user behavior, allowing businesses to remove bottlenecks, improve engagement, and drive conversions.
Clickmaps: Visualizing user interactions
Clickmaps, a variant of VWO Heatmaps, show the number of clicks each area of a webpage receives, revealing areas of high and low engagement. By mapping exact click locations, they help identify high and low-engagement areas, misaligned interactions, and clicks on non-interactive elements. Analyzing click distribution across devices and user journeys enables you to refine layouts, optimize CTAs, and improve usability.
Also, the Click Area feature allows you to compare user interactions across different sections of your page. By selecting multiple areas, you can analyze and contrast click volume, helping you identify which elements drive the most engagement.
VWO also offers clickmaps to track user clicks on dynamic elements such as pop-ups, navigation menus, login pages, checkout pages, forms, and other interactive elements that change based on user actions.
Further, Session Recordings complement clickmaps by capturing real-time user struggles. Rage Clicks (repeated clicks on unresponsive elements) and Dead Clicks (clicks on non-interactive areas) show exactly where users face friction. Identifying these patterns helps pinpoint bugs, usability issues, and latency problems, making it easier to fix them and improve the user experience.
When insights from clickmaps are combined with insights from other heatmaps, session recordings, surveys, or forms offered by VWO Insights, they provide a deeper understanding of user behavior. This comprehensive view helps build stronger hypotheses for testing and optimizing website experiences, ultimately driving higher conversions.
Pro Tip!
Analyze extensive amounts of visitor data across all your heatmaps with VWO Copilot. It also provides automated analysis across heatmaps and session recordings, identifying optimization opportunities based on real-time user behavior.
VWOs integrated heat/clickmaps and reporting make it extremely easy for us to convey a clear message of success to our clients.
– Benjamin Dandurand Operations Manager at Media Contour
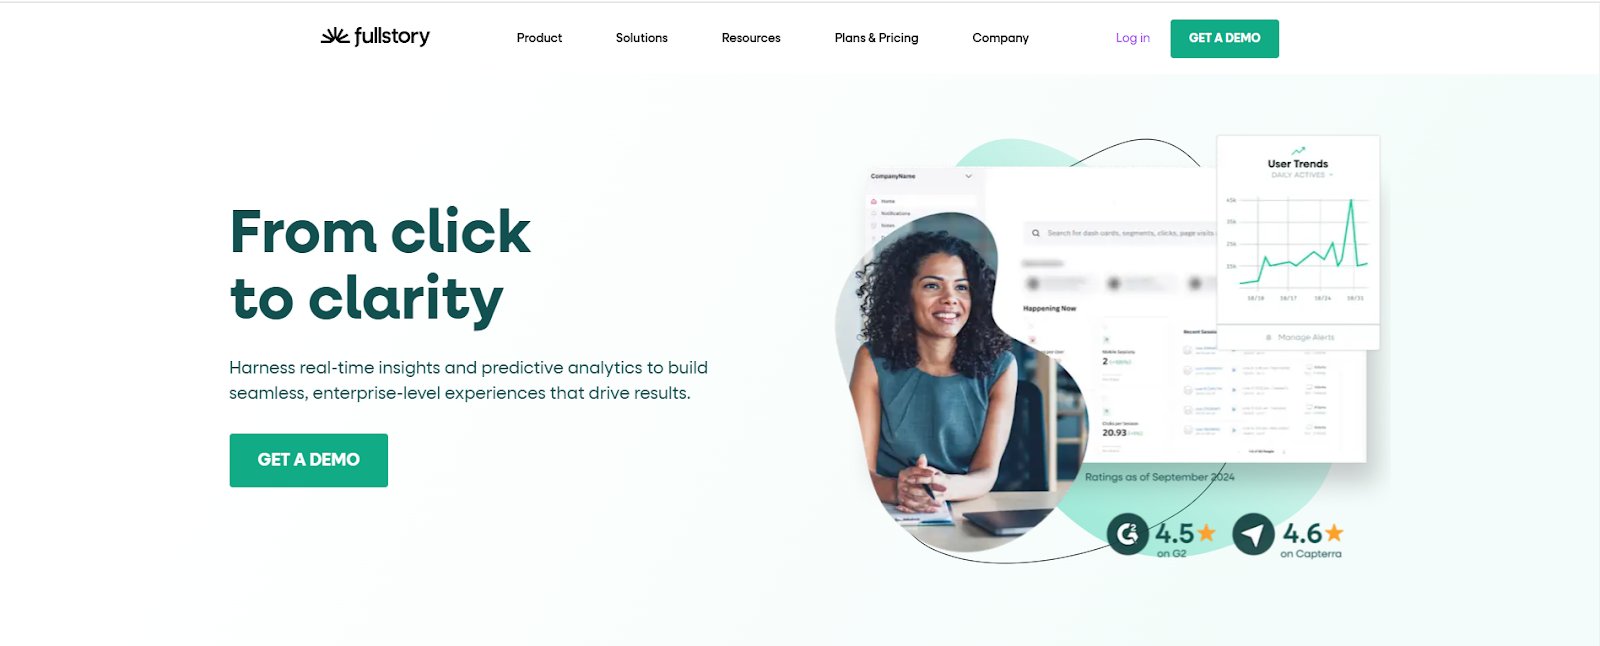
2. Fullstory
FullStory is a behavioral data platform that helps businesses decode user behavior with powerful heatmaps and engagement analytics. The intuitive platform reveals how visitors interact with a site or app, making it easier for marketers and software engineers to optimize for better experiences.
The click tracking feature visualizes how users interact with web pages, highlighting what grabs their attention and where they face friction. Click maps and scroll maps provide reliable engagement data, helping teams validate design choices, refine messaging, and prioritize optimization efforts.
Free trial: 14 days of the Business plan with up to 5000 sessions.
Free: Includes base-level sessions and storage.
Paid: Pricing is not mentioned on the website.
Pros & Cons
Pros:
It is easy to use and helps find friction points to improve A/B tests.
It allows tracking sessions and identifying specific user interactions.
Cons:
It can be buggy, often getting stuck while loading, and its data inconsistencies can be frustrating.
The pricing is expensive, with high minimums and a complex billing structure that can be difficult for small startups.
Customer experience based on G2:
“I believe FullStory provides an exceptional product that offers valuable insights into my websites, including user metrics, customer journeys, and points of friction.” – Evan Waetzman, Principal Digital Product Manager at Newrez LLC
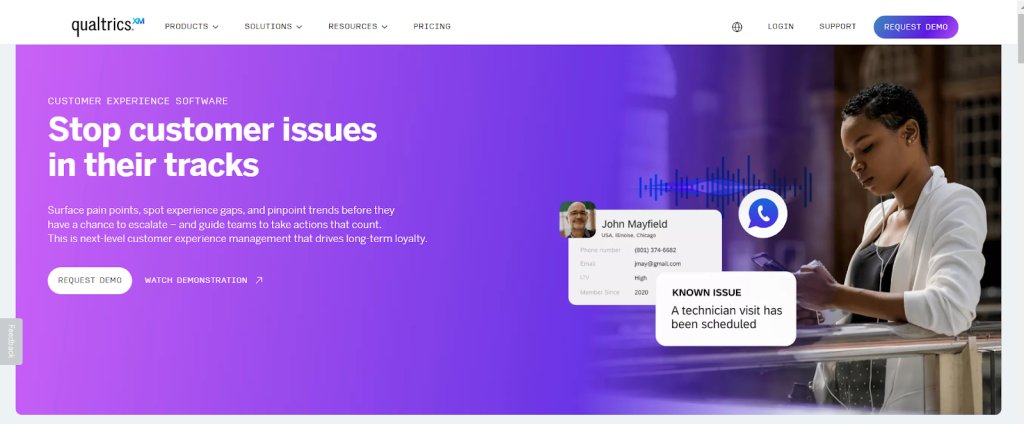
3. Qualtrics XM
Qualtrics XM is a Digital Experience Analytics (DXA) platform that helps businesses monitor and optimize customer interactions across websites and mobile apps. By capturing behavioral data like clicks, scroll depth and session replays, it provides a clear picture of how users navigate digital experiences—highlighting what engages them and where they face friction.
Clicks reveal key engagement patterns, showing which elements attract attention and where users struggle. By analyzing frustration signals like rage clicks, error clicks, and mouse thrashes, businesses can pinpoint usability issues and optimize their websites for smoother interactions.
It allows combining multiple data sources in a single platform for better analysis.
Basic text and analytic functions make it accessible for users without advanced skills or tools.
Cons:
Slower response times delay query resolution, impacting customer experience.
The new bundling model makes it hard to get only the needed features without paying for extras.
Customer experience based on G2:
“Qualtrics is a powerful platform for collecting and analyzing customer feedback on a large scale. It provides advanced survey design, comprehensive analytics, and strong reporting capabilities that help transform feedback into actionable insights. The platform is highly flexible and can support complex use cases for our company.” – Tanishka Goyal, Marketing Manager at American Express Global Business Travel
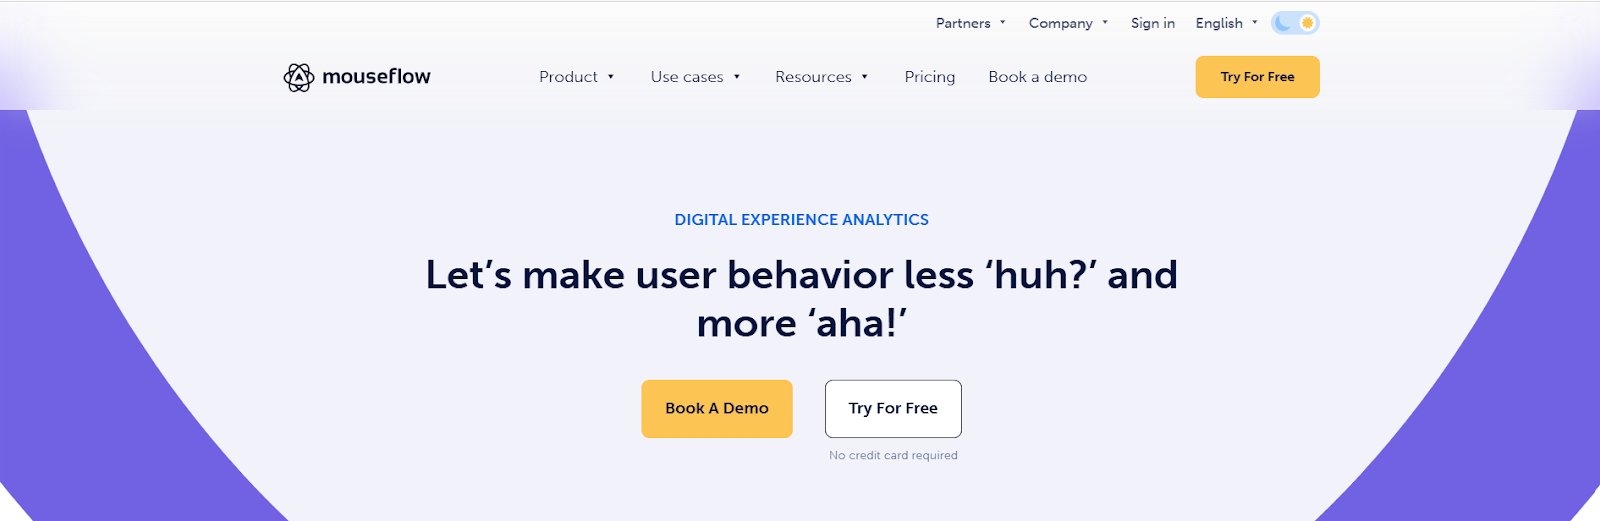
4. Mouseflow
Mouseflow is a digital experience analytics platform that provides businesses with comprehensive heatmaps, session recordings, and behavioral insights to optimize user experience and boost conversions. With six types of heatmaps—click, scroll, attention, movement, geo, and live—it visually represents user interactions, helping identify what captures attention, what distracts, and where users drop off.
The click heatmaps show where users click, hover, or tap, revealing misalignments between user intent and website design. By recording 100% of traffic and every page by default, Mouseflow eliminates the guesswork, allowing teams to analyze user behavior retroactively for up to 12 months and make data-driven improvements.
The heatmap tool offers multiple views, including a live mode that shows heatmaps for different page states, making it useful for dynamic elements like modals.
It is easy to implement, even on custom forms, and helps track which features users click on the most.
Cons:
Mouseflow’s recordings are not always stable, and the accuracy of the exact numbers can vary.
The credit usage system lacks transparency, making it unclear for users.
Customer experience based on G2:
“Mouseflow providesdetailed and informative session recordings that help us understand how users interact with our website. The deployment of heatmaps allows us to identify user trends and patterns. The platform is lightweight and features a simple setup process.” – Sunnysher Hilda, Digital Marketing Expert at A PATTERN MEDICAL CLINIC
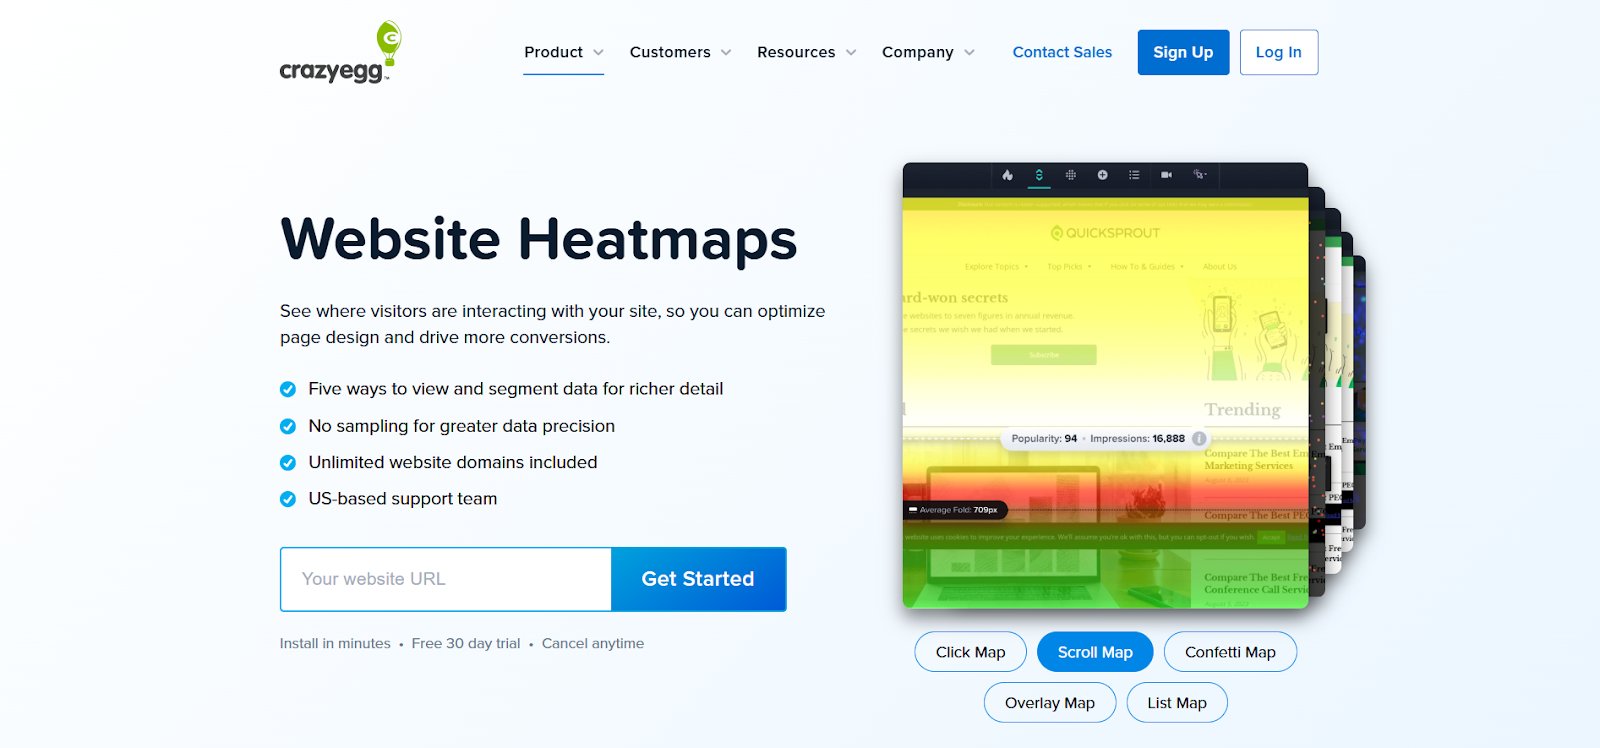
5. Crazy Egg
Crazy Egg is a web analytics and conversion rate optimization (CRO) tool designed for website owners, UX/UI designers, and marketers. It provides in-depth insights into user behavior through heatmaps, scrollmaps, and user recordings, helping businesses analyze traffic and improve conversions.
It’s click maps highlight the most-clicked areas of a webpage, revealing which elements attract attention and which are ignored. Businesses can use this data to refine CTAs, remove distractions, and adjust page layouts for better engagement.
It also helps identify usability issues like rage clicks or overlooked elements, enabling teams to optimize user experience, make data-driven improvements to their websites, reduce friction, and streamline conversions.
Crazy Egg makes it easy to see user interactions on a web page with helpful filters in confetti reports.
The intuitive heatmaps provide a clear visual representation of where users click, scroll, and spend their time.
Cons:
It lacks integration with Google Analytics and could improve report accessibility from navigation menus.
It has some interface quirks, and its A/B testing has minor limitations.
Customer experience based on G2:
“Crazy Egg is very user-friendly. Setting up heatmaps and split tests is quick and easy. It allows us to conduct more tests and obtain significantly better data than our landing page platform.” – Tricia Tiedemann, Freelance Writer
6. Smartlook
Smartlook is an analytics platform that combines quantitative and qualitative data to help businesses understand user behavior on websites and mobile apps.
Click heatmaps help visualize where users engage the most, detect unclickable elements that confuse, and identify underperforming CTAs. These insights help to optimize button placement and improve user interactions.
Key features
Movement Heatmaps, Scroll Heatmaps, Data Segmentation, Session Recordings, Event Tracking, Funnels, Behavior Flows, Crash Reports
Pricing
Free trial: 30 days on all plans.
Free: Limited features for up to 3000 sessions/month.
Paid: Starts from $55/month.
Pros & Cons
Pros:
Easy heatmap creation and visual analytics of user behavior.
Allows faster playback of user movements and runs smoothly without slowing down the website.
Cons:
The UI/UX could be more intuitive, and its dashboard analytics could be improved.
The free version only stores tracking data for one month.
Customer experience based on G2:
“I recently started using Smartlook for my website and am thoroughly impressed with the app. The user-friendly interface makes it easy for me to navigate and understand the data. What I like best about Smartlook are the in-depth visitor recordings that provide valuable insights into user behavior.” – Matan Perry, Owner of MPB Advertising
7. Hotjar
Hotjar is a product analytics and user feedback tool that helps website owners, UX/UI designers, and marketers understand user interactions through heatmaps and session recordings. It reveals how visitors navigate a site, identifying engagement patterns and friction points to optimize conversions.
Click tracking shows where users engage most, what they ignore, and what frustrates them. Heatmaps and rage-click maps highlight pain points, helping businesses make data-driven website improvements.
Free: Forever for tracking up to 35 daily sessions.
Paid: Starts from $32/month, billed annually.
Pros & Cons
Pros:
The script is lightweight and does not negatively impact website speed, making it ideal for performance-sensitive sites.
It provides comprehensive visitor activity analysis, helping businesses customize their websites to meet customer needs effectively.
Cons:
The paid plans have strict limitations, allowing only a limited number of recorded visits, even with a subscription.
It lacks a mobile app, making it inconvenient to monitor user behavior on the go.
Customer experience based on G2:
“Hotjar is a fantastic tool for startups and very user-friendly. It provides thorough user experience management, making it an ideal solution for companies seeking to explore advanced UX measurement and testing.” – Eric Myers, Solutions Consultant at Enable
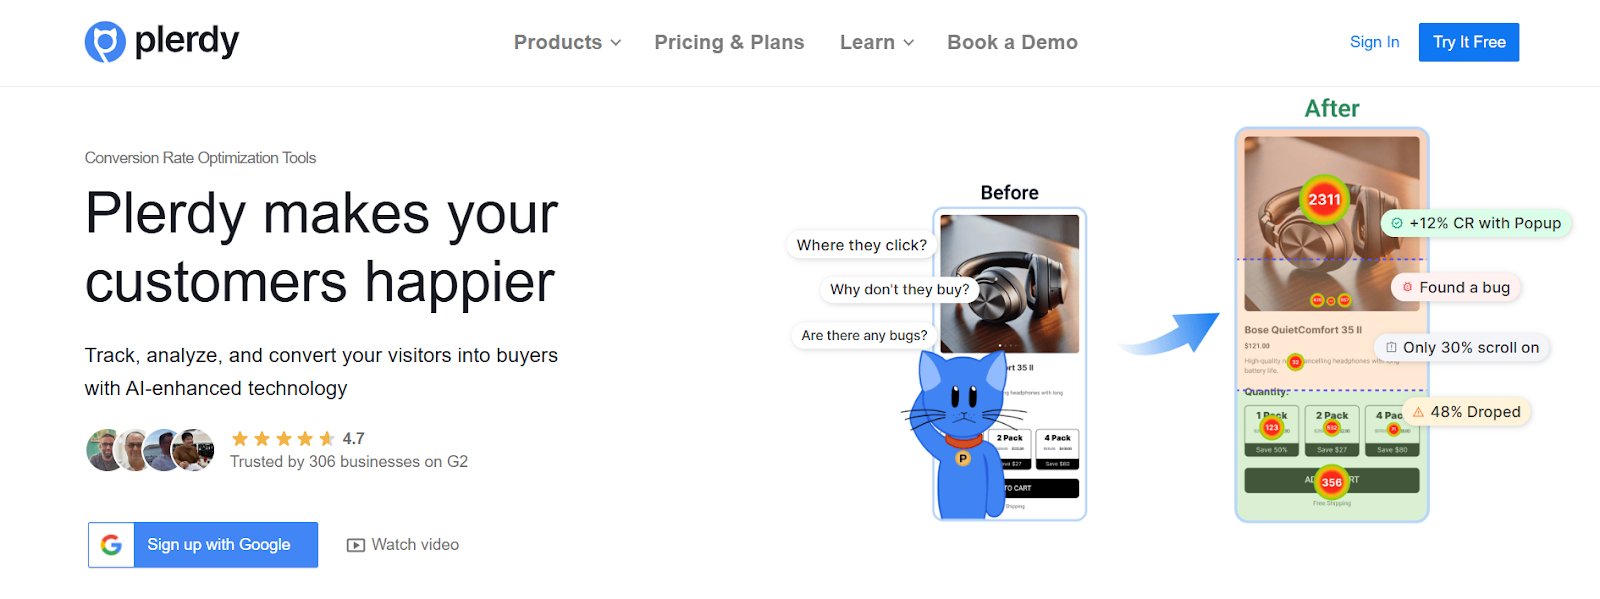
8. Plerdy
Plerdy is an AI-enhanced conversion rate optimization (CRO) tool designed to track, analyze, and convert website visitors into buyers. Its Website Heatmap tool provides data-driven insights to boost SEO and conversion rates by monitoring user behavior, with click tracking as a key feature.
The click tracking feature integrates via a simple tracking code and generates detailed heatmap reports per URL. It allows businesses to visualize user interactions across web pages, helping identify engagement patterns and potential conversion roadblocks. The tool segments clicks based on traffic sources, devices, and user behavior, providing actionable insights to optimize website elements.
It tracks and analyzes user behavior through heatmaps, click maps, and scroll maps to optimize website design.
It allows businesses to run small tests and gather insights to refine their SEO strategy effectively.
Cons:
Plerdy’s heatmaps provide valuable insights but could be enhanced by tracking mouse cursor movements.
A more extensive text-based help database would improve usability for users who prefer reading over watching videos.
Customer experience based on G2:
“I appreciate how user-friendly Plerdy is. It allows me to monitor visitor activity on my website, and the heatmaps provide valuable insights. Additionally, the SEO checker offers great suggestions for improving my site. I use it daily for work, and it saves me a lot of time.” – Pavlo Siniaiev, Business Operations Manager at AGNT.HUB
How to choose the right type of click tracking software
With so many click-tracking tools available, finding the right one can feel overwhelming. The key is to choose software that aligns with your goals—whether it’s improving user experience, optimizing conversions, or refining your marketing strategy. The ideal tool should provide clear, actionable insights without adding unnecessary complexity. Here’s how you can make the best choice. Follow this step-by-step approach to find the best fit:
1. Features & capabilities
If you need more than basic click tracking, opt for tools that offer additional features, such as heatmaps to highlight engagement hotspots and scrollmaps to analyze user drop-offs on long pages. If you want granular form analysis, choose a tool with form analytics to reveal engagement and abandonment issues. For customer feedback, look for survey features that help gather insights.
VWO Insights offers a full range of features to enhance user experience and boost conversions.
2. Tracking & data accuracy
Choose software that offers both dynamic and flexible sampling for more control over how you want data to be collected without depleting your monthly data quota.
3. Ease of setup and usability
The best click-tracking software should be easy to install and navigate. Look for tools with one-click integration, intuitive dashboards, and minimal technical setup to avoid unnecessary complexity.
4. Scalability & integration
As your business grows, your tracking needs will expand. Choose software that scales with your traffic and integrates with your existing platform, whether it’s a CMS, e-commerce system, or analytics suite.
5. Privacy and Compliance
If your site handles user data, ensure the software meets regulations like GDPR or CCPA. Look for features like IP masking and anonymized or cookie-free tracking to stay compliant.
6. Pricing & trial availability
Budget is a key factor when choosing software. Compare free and paid plans based on feature availability and session limits. A free trial allows you to test the platform before committing.
We hope this guide has helped you navigate the process of choosing the right click-tracking software for your needs. By understanding key features, scalability, and data accuracy, you can make an informed decision that enhances user experience and boosts conversions.
Benefits of click tracking software
Clickmaps provide valuable insights for technical, marketing, and digital experience teams looking to optimize the customer journey. They offer a deeper understanding of user interactions, engagement patterns, and friction points, enabling data-driven improvements. Here’s how click tracking software helps businesses enhance user experience, boost conversions, and refine digital strategies.
1. Spot high-engagement zones
Clickmaps highlight areas with the most user interactions, helping identify which content, buttons, or links are drawing attention. Understanding these high-engagement zones allows businesses to focus on elements that drive user actions.
2. Refine the page layout for better navigation
By analyzing click distribution, you can reposition key elements like CTAs, forms, and product details to ensure they are in the most visible and accessible spots. This helps reduce navigation friction and enhances user experience.
3. Boost CTA effectiveness
Track how visitors interact with CTAs and identify whether they are being ignored. If engagement is low, adjust their placement, design, or wording to improve click-through rates and conversion success.
4. Data-backed A/B testing
Insights from clickmaps help to formulate hypotheses for A/B testing by analyzing what works and what doesn’t. This ensures every test is based on real user behavior, allowing businesses to make data-driven decisions that enhance engagement and conversions.
5. Reduce bounce rates & keep visitors engaged
Clickmaps help identify low-engagement sections and navigation bottlenecks that cause users to leave. By fixing confusing layouts, broken links, or misplaced elements, businesses can keep visitors engaged longer and improve session durations.
6. Enhance content strategy with user insights
Clickmaps reveal which content elements attract the most interaction, whether it’s blog posts, images, or product descriptions. Businesses can use this data to refine their content strategy, ensuring they focus on what truly resonates with their audience.
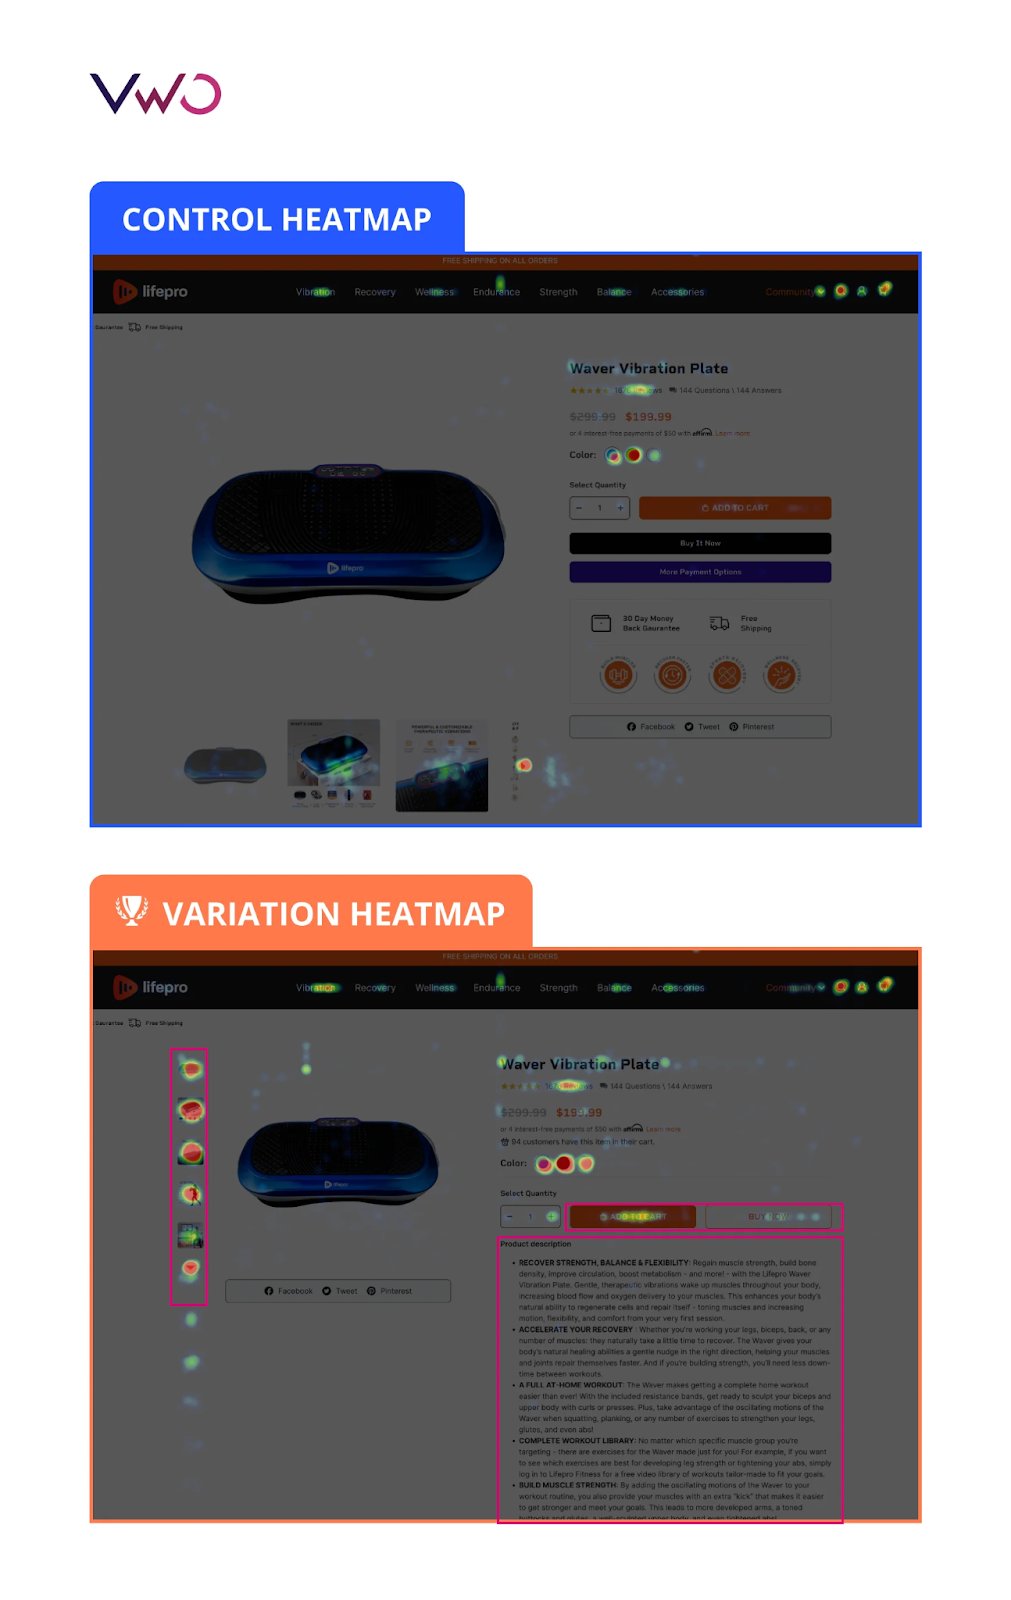
How Media Contour Utilized VWO Insights’ Clickmaps to Improve Revenue by 15.6%
Media Contour is a digital agency based in Dallas that provides digital marketing and conversion rate optimization services.
The agency utilized VWO Insights’ heatmaps and clickmaps to analyze user behavior on the website of their client, Life Pro Fitness.
Heatmaps revealed that visitors struggled to find key product information, while clickmaps highlighted ineffective CTAs. To improve engagement, the team moved essential details, additional images, and purchase CTAs above the fold.
This resulted in a 15.63% increase in conversions within 27 days, a $0.67 uplift in revenue per visitor, and a projected revenue boost from $76,841 to $88,698.
VWO helps you understand how users behave on your site so you can make smarter decisions that boost engagement and conversions. Want to see how it works? Sign up for a free demo.
FAQs
Q1. What is click tracking software, and how does it work?
Click tracking software records and analyzes user clicks on a website or app, helping businesses understand engagement patterns. It works by tracking mouse clicks, taps, and interactions, then visualizing the data through heatmaps, reports, or session recordings.
Q2. What is the meaning of click tracking?
Click tracking refers to the process of recording and analyzing user clicks on a website or app to understand engagement, navigation patterns, and conversion behaviors.
Q3. How does click tracking work?
Click tracking works by embedding tracking scripts on a website or app, which logs user interactions such as clicks, taps, and scrolls. The collected data is then displayed through heatmaps, reports, and session recordings to analyze user behavior.
Q4. Why is click tracking important for my website?
Click tracking helps identify which elements attract attention and what needs improvement. It enables businesses to optimize layouts, CTAs, and navigation to enhance user experience and increase conversions.
Q5. Can click tracking software protect user privacy?
Yes, reputable click tracking tools follow GDPR and CCPA compliance by anonymizing user data, masking sensitive information, and allowing businesses to configure privacy settings.
Q6. What should I look for when choosing click tracking software?
Look for features like heatmaps, session recordings, real-time tracking, privacy compliance, integration options, and ease of use to ensure valuable insights and seamless implementation.
Q7. What are the best link-tracking tools?
Top link-tracking tools include Bitly, Google Campaign URL Builder, UTM.io, ClickMagick, and Rebrandly, which help track link performance, clicks, and conversions.
Q8. What is Qlik software used for?
Qlik is a business intelligence (BI) and data analytics platform used for data visualization, reporting, and decision-making. It helps businesses analyze complex data sets through interactive dashboards and AI-driven insights.
Q9. What is the ClickView tool?
ClickView is an educational video platform that provides schools and educators with access to curated video content and interactive learning resources.
I've worked as a writer and editor in the B2B SaaS space for over 6 years. I read and write on all things CRO and experience optimization.
I'm a chai fanatic and a paranoid parent. When I'm not copyediting or working on marketing projects, I love to spend my time reading. Besides B2B content, my passion lies in modern, behavioral astrology. I'm a dreamer and wish to write stories for children someday :)
Uncover hidden visitor insights to improve their website journey
One of our representatives will get in touch with you shortly.
Awesome! Your meeting is confirmed for at
Thank you, for sharing your details.
, you're all set to experience the VWO demo.
I can't wait to meet you on at
Account Executive
, thank you for sharing the details. Your dedicated VWO representative, will be in touch shortly to set up a time for this demo.
We're satisfied and glad we picked VWO. We're getting the ROI from our experiments.
Christoffer Kjellberg
CRO Manager
VWO has been so helpful in our optimization efforts. Testing opportunities are endless and it has allowed us to easily identify, set up, and run multiple tests at a time.
Elizabeth Levitan
Digital Optimization Specialist
As the project manager for our experimentation process, I love how the functionality of VWO allows us to get up and going quickly but also gives us the flexibility to be more complex with our testing.
Tara Rowe
Marketing Technology Manager
You don't need a website development background to make VWO work for you. The VWO support team is amazing
Elizabeth Romanski
Consumer Marketing & Analytics Manager


![10 Best Enterprise Analytics Platforms [2026]: Expert Picks with Reviews and Comparisons](https://static.wingify.com/gcp/uploads/sites/3/2025/08/Feature-image-10-Best-Enterprise-Analytics-Platforms_-In-Depth-Reviews-and-Comparisons.jpg?tr=h-600)


