The Ultimate A/B Testing Template for Smarter Experiments
Running A/B tests without a clear framework is like setting off on a journey with no map. You might eventually get somewhere, but not without wasting time, making missteps, or missing valuable insights. A well-structured A/B testing template changes that. It turns experimentation into a focused, repeatable process, where every test is aligned with your business goals, grounded in research, and built for actionable outcomes.
In this blog, we’ll walk through an ultimate A/B testing template based on a proven Conversion Rate Optimization (CRO) methodology we’ve seen work across multiple client experiments, ensuring your tests are not only systematic but also strategic, from identifying the right opportunities to extracting actionable insights post-test.

What are the benefits of using an A/B testing template?
An A/B testing template helps transform scattered ideas into structured, goal-driven experiments. Here’s why it’s worth adopting:
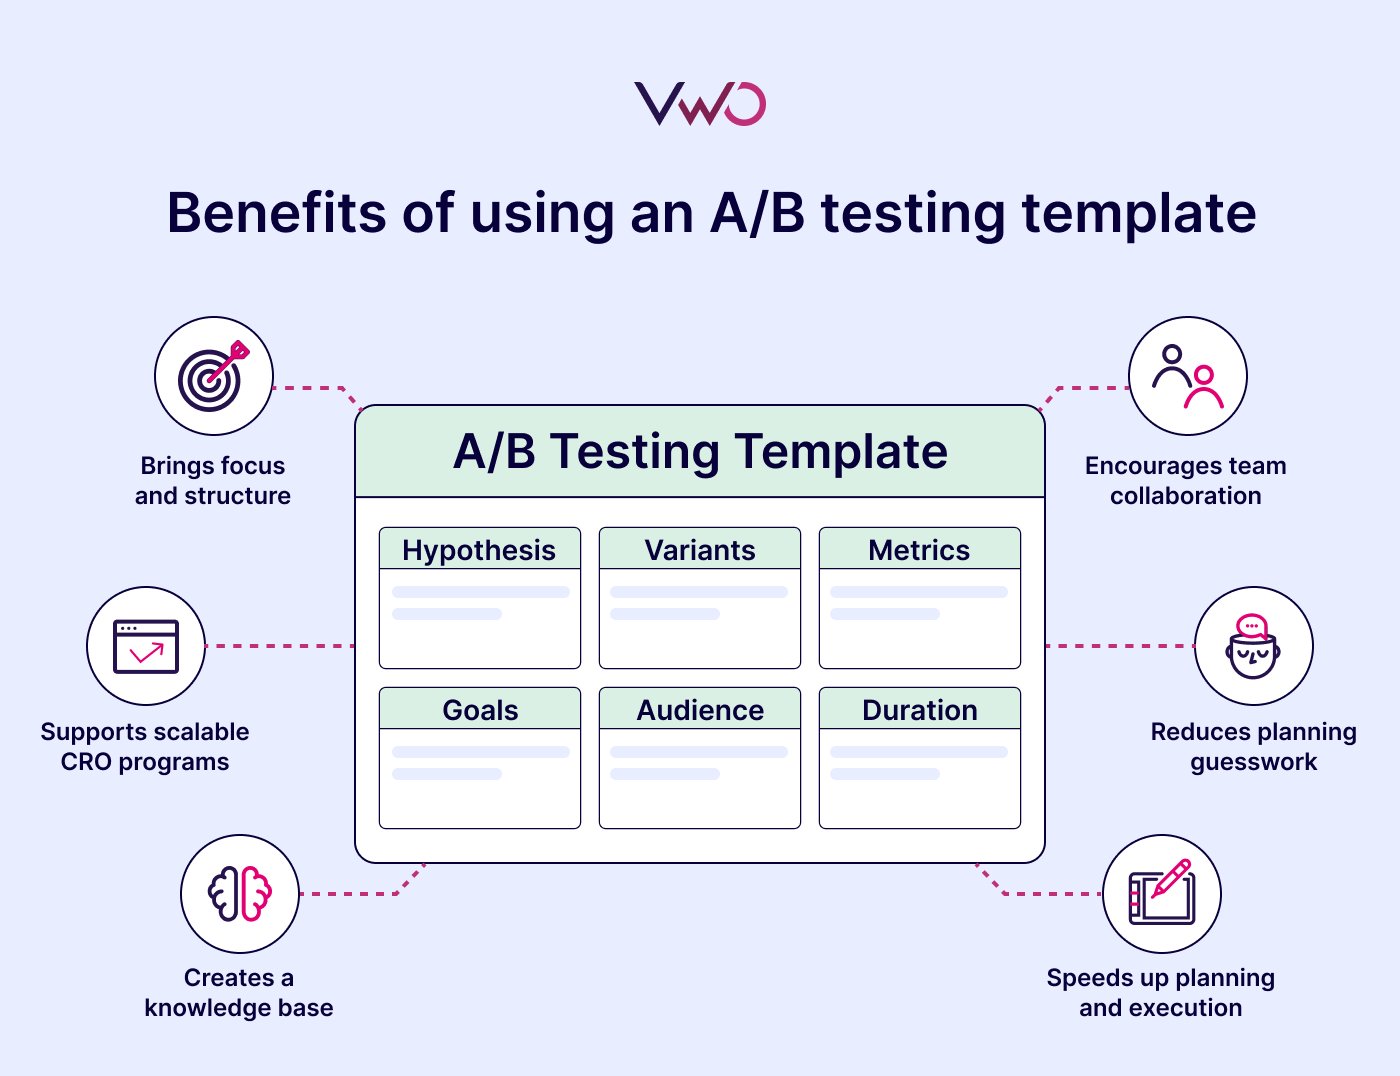
Brings focus and structure
Clearly outlines objectives, hypotheses, metrics, and target audiences so everyone understands the purpose and scope.
Encourages team collaboration
Keeps stakeholders, designers, developers, and marketers on the same page by centralizing all key test details.
Reduces planning guesswork
By outlining hypotheses, goals, variants, and traffic splits in advance, a template brings clarity to the setup process and helps avoid confusion or errors during execution and analysis.
Speeds up planning and execution
Having a repeatable format reduces time spent figuring out “what to do next,” allowing your team to focus on strategy.
Creates a knowledge base
Stores test results, learnings, and follow-up notes, making it easier to revisit past tests, spot patterns, and avoid redundant experiments.
Supports scalable CRO programs
As testing volume grows, templates make it easier to maintain quality, consistency, and strategic focus across multiple experiments.
Essential components of an A/B test template
A robust A/B testing template usually includes the following components:
| Section | Purpose |
| Test Name | A short, descriptive title of the test |
| Owner | The person or team responsible |
| Hypothesis | What do you believe will happen and why |
| Goal/Primary Metric | What you’re trying to improve (e.g., conversion rate) |
| Secondary Metrics | Supporting data points (e.g., time on page, bounce rate) |
| Variants | A and B (and more, if multivariate) versions to test |
| Target Audience | Who is included in the experiment |
| Traffic Split | % distribution of users across variants |
| Test Duration | How long will the test run |
| Success Criteria | What outcome qualifies the winner |
| Test Setup Summary | Tools, URLs, platform notes, and test triggers |
| Result Analysis | Final results, interpretation, and insights |
| Next Steps | Implementation or follow-up testing plan |
Step-by-step: Using this A/B testing plan template
Step 1: Identify a lagging metric (Quantitative research)
Start with the right question
Ask yourself — Where are we losing users?
Use quantitative data tools: Analyze user behavior using platforms like:
- Google Analytics
- Mixpanel
- Internal dashboards
Find funnel drop-offs
These tools help you identify:
- Where users abandon the funnel
- Pages with high bounce or exit rates
- Underperforming CTAs
Focus on friction, not guesswork
Don’t test random UI tweaks. Solve real issues backed by existing data.
Prioritize high-impact areas
- Audit high-traffic landing pages and top conversion paths
- Avoid optimizing areas users don’t reach (e.g., testimonial section)
Zoom into specific metrics
- Bounce rate
- Exit rate
- Click-through rate (CTR) on CTAs
- Step-by-step conversion drop-offs
Choose one key issue to test
- Keep your test focused on solving one high-value friction point.
For example, if your pricing page receives a lot of traffic but few users click the “Start Free Trial” button, that’s your opportunity to test and improve conversions. Segment by device, geography, or source to sharpen your hypothesis even further.
Step 2: Uncover the “why” (Qualitative research)
Move beyond the “what” to the “why”
Use qualitative tools to understand why users drop off, not just where.
Observe real user behavior with visual tools
- Heatmaps
Show if important elements (like CTAs or value propositions) are being seen. - Session replays
Provide a firsthand view of friction, such as:- Confused or erratic cursor movement
- Repeated clicks
- Abandoned form fields
Collect direct user feedback
- On-site surveys or polls
Capture feedback in the moment to uncover hidden friction points, e.g., pricing confusion, trust concerns, and missing valuable information.
Complement your data
While metrics show what users do, qualitative research uncovers why they do it, helping you shape stronger hypotheses.
Build a more informed hypothesis
Combine behavioral evidence with contextual insights to test the right changes, not just visible ones.
Step 3: Formulate a hypothesis
Translate insights into action
Use behavioral and user feedback data to create a clear, testable hypothesis.
Go beyond surface-level changes
A strong hypothesis should:
- Define what change is being made
- Explain why the change should improve the user experience or outcome
- Be rooted in actual user behavior and sentiment
Let’s return to the earlier example: scroll data showed most users didn’t reach the pricing table, and survey feedback pointed to confusion about plan options. This indicates a visibility and clarity issue.
A focused hypothesis could be: “If we move the pricing table higher and add a brief explainer above it, then plan selection clicks will increase because users will see and understand their options sooner.”
Why this matters?
- It ties observed friction to a specific user behavior
- Makes the expected impact measurable
- Helps you evaluate test outcomes more meaningfully
The best hypotheses link a user problem to a targeted solution, and predict the outcome enough to validate or invalidate through data.
Ready to turn research into results and create a positive impact? Use this guide to create a strong hypothesis in VWO and launch smarter experiments.
Step 4: Define variants and audience split
Translate the hypothesis into variations
- Create testable versions of the element in question.
- Typically includes:
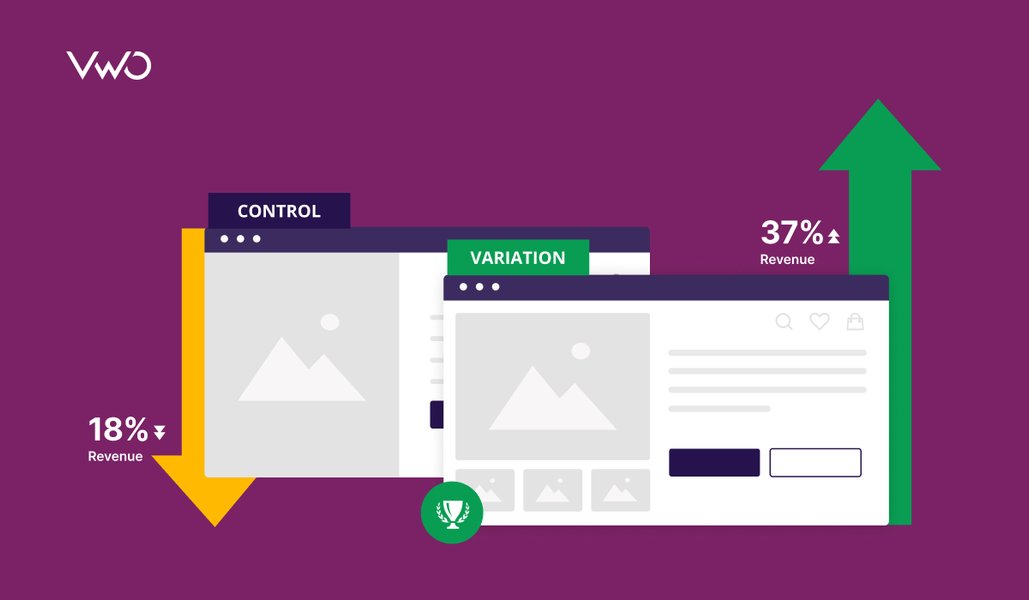
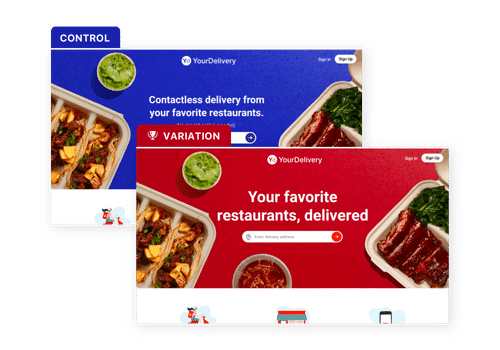
- Control: What users currently see
- Variant: The new version with the proposed change
Isolate the variable
- Keep all other variables constant.
- Ensures that outcome differences are due to the specific change being tested.
Distribute users effectively
- Use a balanced 50/50 traffic split for most A/B tests.
- Segmentation may be used when testing:
- Specific device types
- Geographic regions
- Particular user groups where the issue was observed
Continuing with the pricing table example-
In the control, the table stays in its original position. In the variation, it’s moved higher up the page with a one-line explainer added above it. Everything else stays the same, so any change in plan selection clicks can be directly tied to this adjustment. That way, the test stays true to the original hypothesis.
Use VWO Copilot to auto-generate variations of key page elements such as layouts, headlines, button designs, and more. It helps you save time and expand your pool of test ideas without manual effort.
Step 5: Set goals and metrics
Define success criteria before launching
- Establish clear, data-backed goals to avoid misinterpreting test results.
- Prevent chasing vanity metrics that don’t reflect true performance.
Choose a primary metric
- It should directly align with the outcome your hypothesis aims to influence.
- Common examples:
- Clicks on a call-to-action (CTA)
- Form completions
- Purchases
Include secondary metrics
- Provide insight into the broader impact of the change.
- Help detect unintended side effects.
- Examples include:
- Bounce rate
- Time on page
- Exit rate
Purpose of secondary metrics
- Ensure that positive results in the primary metric aren’t offset by negative impacts elsewhere in the user journey.
In the pricing table example, your primary metric might be clicks on the “Select Plan” button. Secondary metrics could include scroll depth or trial sign-ups. Defining these in advance keeps your test focused and makes it easier to interpret the results once the data starts coming in.
Step 6: Launch the test and let it run
Ensure everything is in place
- Confirm that variants, goals, and tracking mechanisms are set up before launching the test.
Maintain consistency
- Once live, allow the test to run its full course without making changes or ending it early—even if early results appear promising.
Avoid premature conclusions
- Stopping a test too soon can skew data and lead to unreliable outcomes, such as Type I (false positive) errors.
Understand the risk of false positives
- Ending a test early increases the chance of mistakenly identifying a non-performing variation as a winner.
Use planning tools before launch
- Estimate the required user count and test duration using available sample size and duration calculators, based on your traffic and expected uplift.
In our example, even if clicks on the “Select Plan” button rise within a few days, don’t rush to declare success. Let the test run its planned duration so that results reflect consistent user behavior rather than short-term fluctuations.
Step 7: Analyze results – Overall and by segment
Start with the primary metric
- Once the test concludes and reaches statistical significance, review the main goal to check if the variation met expectations.
Don’t rely solely on overall results
- High-level numbers may look positive, but they often mask variations in performance across different user groups.
Use segmentation to uncover deeper patterns
- Break down data by device, geography, user type, or other relevant segments to reveal hidden trends.
Understand mixed outcomes
- A variation might succeed overall but underperform for mobile users or a specific region.
Conversely, it might underwhelm in total but excel among returning visitors or high-value segments.
Make informed rollout decisions
- Use segment-wise insights to decide how, where, and whether to implement the winning variation fully.
In our ongoing example, let’s say the new pricing layout improved overall plan selection clicks by 12%. But when you break it down, the lift came primarily from desktop users, while mobile users showed no change. This could justify a desktop-first rollout and a follow-up test tailored to mobile behavior, testing different variations for better insights.
Taking the time to analyze results by segment not only sharpens your understanding of what worked, but it also helps you make smarter, more targeted decisions going forward.
Step 8: Document learnings and next steps
Capture insights while they’re fresh
- Regardless of outcome: win, loss, or neutral, every test provides learnings that can inform future decisions and avoid common mistakes.
Translate outcomes into clear next steps
- A winning variation might be ready for rollout, while a surprising result may lead to new hypotheses or testing directions.
Summarize key elements
- Document the hypothesis, test outcome, and notable insights, especially how different user segments reacted.
Value lies in clarity
- Even without a positive lift, knowing what doesn’t work narrows the path toward what will.
Centralize and share learnings
- Store test documentation in an accessible location so your team can refer to past tests, avoid redundancy, and build on existing knowledge.
In the pricing test, for example, the desktop lift confirms a visibility win, while mobile inertia points to the need for layout adjustments or performance tweaks. Logging both helps turn one test into a springboard for focused follow-up experiments, moving optimization from one-off fixes to an ongoing, informed process.
A free A/B testing Excel template for you
Grab your free A/B testing Excel template to plan, track, and analyze experiments with clarity and consistency; download it here.
Using VWO to bring this A/B testing template to life
Having a well-defined A/B testing template brings structure and consistency to your experiments. But a template alone isn’t enough. To truly make it work, you need a platform that can support each step, right from gathering insights to rolling out a winning variant. That’s where VWO comes in.
Start with research that reveals problem areas
Effective testing starts with finding what’s not working. Use tools like Google Analytics or Mixpanel to spot weak pages or drop-offs.
Most importantly, on the qualitative side, VWO Insights brings together heatmaps, scrollmaps, session recordings, and on-page surveys into a single workflow. You can also use VWO Funnels to understand exactly where users exit and highlight friction in your conversion journey.
This gives you a visual and contextual understanding of user behavior, where they drop off, what they’re missing, and how they feel.
You can dig deeper into specific pages, spot drop-offs, and even collect on-page feedback to replace guesswork with real behavior data.
Moreover, with VWO Copilot, behavioral analysis is automated, and insights come with clear recommendations, saving you hours of manual review.
Turn observations into actionable hypotheses
Once you’ve gathered user insights and identified problem areas, turn them into clear, testable hypotheses.
Add your hypotheses to the VWO Plan, the built-in program management tool that helps you track and prioritize your experimentation pipeline.
To speed things up, you can also enter your webpage URL into the idea-generation feature of VWO Copilot to get tailored testing ideas based on scientific principles.
Finally, link each hypothesis to the right success metrics. VWO lets you define and track goals from basic conversions to custom events, ensuring every test delivers measurable impact.
Access step-by-step guidance on selecting meaningful metrics and tracking them effectively throughout your A/B testing journey.
Set the groundwork before launching
VWO offers a free A/B Test Sample Size and Duration Calculator to help you estimate the required sample size and timeline based on your site’s traffic and expected uplift. These insights feed directly into the planning section of your template, keeping everything aligned.
VWO’s newly introduced Stats Engine further streamlines decision-making during tests. It highlights winning variations early, automatically stops underperformers, and supports equivalence testing.
Paired with enhanced reports featuring visual breakdowns and segment insights, it gives you both speed and depth for high-impact experimentation.
Run tests without workflow jumps
With VWO, you can run tests and deploy changes in one place.
Use VWO’s Visual Editor to build variations without code, and VWO Deploy to roll them out to specific segments or all users.
You can launch tests and push final updates from the same workspace, keeping workflows simple and decisions quick.
VWO Copilot can also create extra variations from your first one, saving time and expanding test coverage.
Dig deeper when the results come in
Once the test ends, VWO helps you understand the “why” behind your test results. You can segment results by device, location, or traffic source, and even overlay heatmaps on your test pages to spot behavior changes.
You can quickly search for the segment you want to analyze, like “mobile users,” “returning visitors,” or “users from New York”, using clear, descriptive terms.
Plus, you can save your segments and reuse them across future tests for faster, consistent insights.
VWO turns your test plan into a connected, repeatable process so insights lead to action and good ideas deliver better results, whether it is your first test or part of a large program.
Set up your next A/B test in minutes – here’s how to do it in VWO.
FAQs
A/B testing follows a structured flow: identify a goal, form a hypothesis, design control and variation, define your audience, run the test with equal traffic splits, and analyze the results to determine which version performs better.
A standard A/B test format includes: a control (original version), one or more variations (modified versions), randomized user assignment, predefined success metrics, and a statistical framework to measure impact and confidence.
Start by outlining the key components of any test: objective, hypothesis, primary metric, control and variation details, audience targeting, traffic allocation, duration, and success criteria. You can use a spreadsheet, a project management tool, or platforms like VWO Plan to organize these elements into a repeatable format.
Your template should include: test name, objective, hypothesis, target metric(s), control and variation descriptions, audience segmentation, traffic split, test duration, pre-launch checklist, and space for results and insights.
Summarize the outcome by comparing the performance of each variant against the primary metric. Include statistical significance, segment-wise insights, and visual summaries if possible. End with a clear conclusion and next steps, whether that’s rolling out the winner or iterating further.
Categories: