Three Kinds of Metrics: The Success, The Guardrail and The Diagnostic

Robert McNamara was a former executive in the Ford Motors Company and later served as the US Secretary of Defense from 1961 to 1968. Having a reputation for rigorous statistical analysis at Ford, McNamara went on to apply his ideology on numbers in the Vietnam War as the Secretary of Defense. McNamara resolved to measure the success of the war with one single metric, the number of dead enemy body counts. He believed that by maximizing the number of enemies killed, success in the war was guaranteed. Hence, he chose to focus on a single metric of success ignoring any information on the broader context.
But war is a complex process influenced by the morale of soldiers, the resilience of the enemy, and the global perception of events. McNamara’s choice of metric blinded him to all the other developments in war which eventually rendered his metric of choice useless. The US eventually lost the war and his name became synonymous with a dangerous fallacy – the belief that what can be measured is all that matters. Today, it is widely known as the McNamara’s fallacy.
The first step is to measure whatever can be easily measured. This is OK as far as it goes. The second step is to disregard that which can’t be easily measured or to give it an arbitrary quantitative value. This is artificial and misleading. The third step is to presume that what can’t be measured easily really isn’t important. This is blindness. The fourth step is to say that what can’t be easily measured really doesn’t exist. This is suicide.
McNamara’s Fallacy
More often than not, reducing your vision to a single metric can hide unexpected nuances of what is happening. We have repeatedly seen such errors in the history of metrics and modern tech companies have increasingly realized the value of tracking a handful of effective metrics. In your journey to define an effective set of metrics, you can start by considering three crucial kinds of metrics and the purposes they serve: the success metric, the guardrail metric, and the diagnostic metrics.
Success Metrics
The success metric is the central metric that you want to optimize and improve in the process of experimentation. The success metric defines the overall direction in which you want to head to reach your business goals. Actual business KPIs are often lagged metrics such as monthly active users, net profits, and quarterly growth. They are often not fit for experimentation because they might take a long time to detect the impact of the idea being tested. Success metrics are hence chosen to be the leading metrics that will immediately reflect the impact of the experiments such as conversion rates and user engagement time.
Success metrics should hence be designed with the objective that they will eventually improve the core KPIs of the business. However, such assumptions can be flawed and need to be brainstormed seriously before finalizing the choice of success metrics. Success metrics if wrongly chosen might end up negatively impacting the overall KPI and might mislead the experimenters in their work.
Overall, large organizations like Meta or Google assign different teams a handful of success metrics. The leaders ensure that the metrics are so designed that the overall KPIs of the business will improve if each team improves its success metric. A well-aligned hierarchy of success metrics can lead to a compounding effect on the overall impact. On the other hand, a misaligned hierarchy of metrics can also lead to the canceling of individual efforts yielding a much lesser impact on core KPIs.

Guardrail Metrics
Guardrail metrics are the metrics that should not be impacted negatively in an experiment. For instance, you might be deploying a new page design for a higher conversion rate (success metric), but you do not want the page load time to increase in the process. Experimentation Platforms can be so designed that when a guardrail metric is impacted, the experiment can be automatically shut down saving potential costs to the company. Guardrail Metrics are hence a crucial component in experimentation if you want to build a safe and liberal culture of testing in your organization.
To highlight the importance of guardrails, let us compare experimentation to evolution. Evolution progresses through many random mutations, some of which come to dominate the population pool by natural selection. Without an environment that supports natural selection, mutations will happen in many random directions but the overall population would not evolve towards some desirable characteristics. The same is true with experimentation.
In an ideal scenario, experimentation should be made as liberal as the random mutations in a genome, where every member of the organization can freely test their ideas but strong guardrails protect the overall experimentation effort. Large organizations with more mature experimentation programs have enabled this liberty by building automated systems that gradually increase exposure to an experiment only if no guardrails are hurt. If any guardrails are hurt, the system promptly kills the experiment.

Diagnostic Metrics
Diagnostic Metrics are the metrics that give a deeper insight into the results of an experiment. For instance, suppose you have made a change in your product description which has led to an increase in the sales of that product. By tracking a set of metrics other than the success metric, you can better analyze how your visitor behavior has been impacted. For instance, you might want to see how long the average user was engaged, what the average conversion rate on the product page was, and what the cart abandonment rate was. All these metrics can shed valuable insight into how the change in product description has ended up impacting the overall sales.
Any causal impact from X -> Y often follows a causal pathway that can help you understand the underlying system better. For instance, if a change made to your website increases sales, it might be doing this by reducing customer anxiety about the product’s quality, or probably by catching the attention of potential buyers better, and so on. A mature experimenter will try to reduce these causal pathways into effective metrics and try to derive better learnings from an experiment that can later help create better hypotheses.
Diagnostic Metrics can be creatively used for various purposes of experimental diagnosis such as understanding if the customer is being directed in the right direction and the website is working as expected. However, diagnostic metrics should strictly not be used for decision-making as they can often end up biasing your decision-making process.
Conclusion
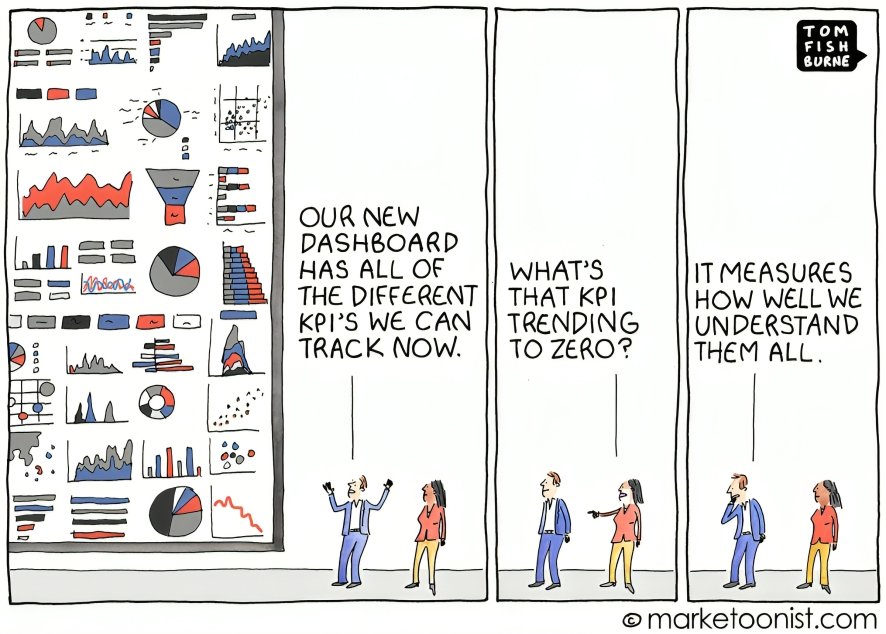
Different kinds of metrics come together in an organization to give a broad and robust picture of growth and performance. Larger organizations often invest efforts into building a comprehensive dashboard to visualize the most crucial metrics to track. However, there is an important piece of caution that needs to be addressed in the discussion on metrics.
While too few metrics obviously hide the complexities of the system you are dealing with, there are even severe risks with managing too many metrics together. As the number of metrics in a system increases, decision-making typically becomes complex because most ideas end up improving some metrics but deteriorating some others. Moreover, as the number of tracked metrics increases, the chance that different metrics show correlated information also increases leading to diminishing marginal utility of new metrics. Finally, systems become difficult to navigate as too many metrics become increasingly hard to process cognitively.
Overall, it is recommended that you judiciously add new metrics to your arsenal and only keep a handful of different purpose metrics to guide your experimentation journey.