The Statistics of Experimentation

A graduate-level statistics course would usually start with an innocuous discussion on the mean, median, and mode and the fundamentals of a probability distribution. A few weeks later the discussion might still seem tractable as the professor will be telling you all about hypothesis tests, the null hypothesis, and p-values which will make you ridicule the apparent aversion most students portray towards statistics. However, before you realize it, you will find yourself dabbling with complex statistical assumptions such as normality, stationarity, and homoscedasticity (pronounced ‘J-aar-g-un’). While you would still be fumbling to spell these words, the professor will jump to the various kinds of statistical tests that you can run to validate these assumptions for different kinds of data. Finally, by the end of the term, you will realize that there is hardly anything in statistics that comes without assumptions, and hardly any assumptions that come without the need to be tested.
And one fine day, you will wonder whether it was all a facade that statisticians put in place, to nauseate anyone who might be interested in understanding their work. You will wonder, what value the theorems of statistics hold if their very validity hangs over countless assumptions that might not be true in many real-world cases. The fact that even these tests have their own false positive rates that are hinged on certain assumptions will finally make you appreciate the whole world’s aversion towards statistics and statisticians.
But statistics is the way it is because it deals with an untamable beast that is neither easy to decipher nor easy to predict. Once you understand statistics and the problems it deals with, you also understand how there was no other way for statistics to be. This blog post introduces you to the larger framework of statistical problems and the area of our interest in this blog, the statistics of significance.
The Nuances of Statistics
Statistics is the branch of mathematics that deals with randomness. Abstract mathematicians invented the variable ‘x’ that ingeniously allowed them to talk about something that is unknown. Statisticians went one step further in their imagination. They invented the random variable ‘X’ whose value was not just unknown but also random in nature. For instance, statisticians can define D ~ the value on the top face when you roll a dice. Note that the top face of a dice can be anything between 1 and 6 with equal probability. Also, note that the variable D does not just represent one dice roll with some unknown outcome ‘x’. It rather represents the outcome of a dice over multiple rolls. They chose to represent this as a probability distribution over various possible outcomes.
Statistics is perplexing because randomness adds a layer of complexity to our mathematical intuitions. But once you dive in deeper, you realize that randomness is not as chaotic as it seems from the outside. Randomness has a structure to it and statistics provides us with a toolbox to deal with the randomized world.
Let us see the various components of statistics that help us dissect randomness.
- The assumptions and the model: Talking in terms of absolute truth is a luxury available to mathematicians and logicians but not to statisticians. Most random processes that exist in the real world have to be reduced to simpler forms and that is why any statistical solution makes some implicit assumptions. For instance, if you ask a statistician to approximately measure the surface area of a mountain, the statistician will first make some assumptions. A crude assumption can be that the mountain is a triangle. A more accurate assumption can be that the mountain is a cone. Both assumptions are wrong, but no assumption can exactly represent the mountain as it is. In specific terms, this is called statistical modeling and it is often the first step when a statistician solves a problem.
- The samples and the parameter estimation: With the model in place, the statistician seeks to estimate the latent parameters in his model to describe the real world. For instance, the conversion rate of a website is a latent parameter. Samples from the random process in question provide a window to the probable value of the latent parameter. In other words, if you need to find out the chance that a weighted coin comes out heads, the only way you have is to toss the coin multiple times and see the proportion of heads. The more samples you collect, the more accurately you are able to estimate the latent parameter. But keep in mind, the estimation is only as accurate as the assumptions of your model.
- The error rates in estimation: The world of statistics lacks another luxury available to the world of mathematics. Rarely can a statistician talk about a result being absolutely right or absolutely wrong. Rather, all statistical procedures have some possible error rates in their estimation. Statisticians go to lengths to ensure that the error rates are bounded by a desired limit. But the error rates can take many forms for a single problem and often there is a tradeoff to control one type of error at the expense of another. For instance, when diagnosing a disease, there is a higher cost associated with a diseased patient being declared healthy (false negative), compared to a healthy patient being declared diseased (false positive). The underlying statistical solution is tweaked to control one type of error at the expense of the other.
- The biases that break the assumptions: The world of randomness is interesting because on careful inspection you often realize that data carries deeply embedded scars from the process of its origination. For instance, say you launched an online survey to estimate the spending habits of an average citizen of your country. The samples you collect will suffer from selection bias as economically weaker sections of your country might not have access to the internet to take part in the survey. The samples will over-represent the rich and under-represent the poor, hence leading to inflated estimates of spending habits. Sometimes these biases are easy to spot, but sometimes they are much harder to spot. Statisticians go to lengths to identify these biases in their study and then find ways to eradicate them from their results. Identifying which biases are causing which assumptions to break is the heart of statistical application to scientific studies.
- Developing newer models with tailored assumptions for various cases: Once you understand which assumptions are not valid in the real world, statisticians create better models to describe the process in question. The world of statistics gives you a library of modeling assumptions to deal with ever more complicated real-world problems. A statistician improves the models to make better predictions, and the study of statistics diverges into deeper and deeper nuances of the problem of interest. From here on the statistical toolbox starts to evolve. Applied statistics is often about these various tools that one can use to test their assumptions and do things differently when assumptions are broken.
Conclusion
Models, samples, error rates, and biases are the daily dealings in the day of a statistician. Most problems of statistics and data science run into these concepts once you start to probe deeper beneath the surface. Statistics starts to seem beautiful when you start to see the deeper reasons behind why statistics evolved to be the way it is. While statistics is a very broad subject, as experimenters we are concerned with only a specific problem in statistics, but one with a central relevance to all queries of science. It is the problem of statistical significance.
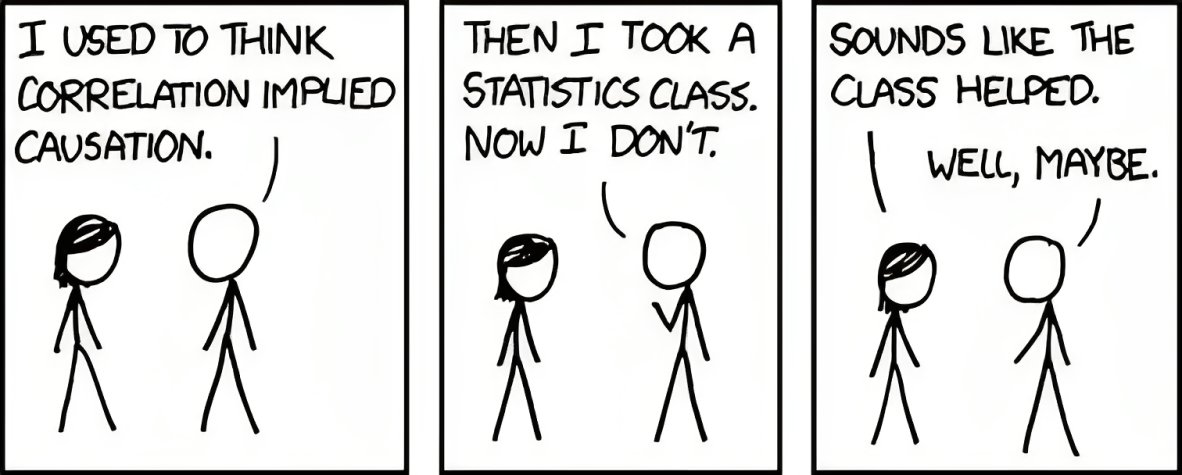
Science in its quest to estimate causality often returns home dumbfounded by patterns generated out of pure randomness. In other words, suppose you have two coins and you toss them 1000 times. If the first coin results in 490 heads and the second coin results in 510 heads, is there enough evidence to believe that the second coin has a higher probability of returning heads? In other words, science aims to ask that if the happening of X correlates with the happening of Y in a controlled experiment, is it enough evidence to believe that X causes Y? This is the central question that statistical significance tries to answer.
Statistical Significance is at the heart of all decisions emerging out of experimentation. Explaining the story of statistics behind it is the objective of this section.