The Statistical Significance

Ever since eternity, humans have looked up at the night sky and found patterns resembling the things they see around them. Humans gave names to these patterns such as Andromeda, Orion, and the Aries and today 88 of such star patterns have been identified as the officially listed constellation known to humans. Humans have even gone on to associate deeper meanings with such star patterns and created elaborate myths around them. But science tells us that there is no causal proof causing stars to be arranged in the shape of a lion or a bear. We humans have an exceptional capability to find distinct patterns out of thin air. Our minds work the same way with data, the way they look at stars.
As scientific thinking evolved, people started looking for evidence to confirm their hypotheses on how things work. But data holds an inherent potential to show patterns that are believable purely out of chance, just like stars show constellations.
Statisticians made an attempt to develop theories to quantify this chance. They asked the question, when can evidence be enough to ensure that the observable pattern is not being observed purely due to chance?
To solve the problem, they assumed that there was no real pattern underlying the observed data, and then tried to calculate the chance of observing a pattern as extreme as the one observed. They called the assumption as the null hypothesis and the chance as the p-value. That was the birth of statistical significance and ever since, it has been the cornerstone of trust in all science.
Today in modern A/B testing, statistical significance tells you if the uplift being observed in a test between the control and the variation, is due to chance or is driven by a real causal effect. Statistical significance is the decisional measure at the core of all A/B testing. In this blog post, I introduce what statistical significance is and why it is needed in experimentation. With two thought experiments, I aim to share the fundamental intuition that will clarify the relationship between experimentation and statistical significance.
What is statistical significance?
To understand statistical significance, let us work through a hypothetical scenario involving two weighted coins. Metaphorically, the two coins in the context of A/B testing represent the two page designs (the control and the variation). Further, each toss represents a visitor landing on the website, and every time a coin lands on heads, we can say that the visitor converted.
Taking the analogy with A/B testing further, let us suppose that an experimenter is given the task of figuring out if coin 2 (variation) has a higher probability of returning heads (conversions). With the coins being his only source of information, the experimenter tosses each coin 1000 times and obtains the following dataset.
| Number of Heads | Number of Tails | Total | |
| Coin 1 (Control) | 490 | 510 | 1000 |
| Coin 2 (Variation) | 495 | 505 | 1000 |
It can be clearly observed that the variation has a higher number of heads (an uplift of almost 1% over control). A careful experimenter might then ask, is this difference large enough to conclude that coin 2 has a higher probability of coming up heads in the future? To grasp the intuition further, one needs to realize that in a random world, there is a very low probability that such an experiment will lead to exactly the same number of heads even if there is no difference between coin 1 and coin 2. Since randomness always will lead to some difference in the collected samples, one will always have to ask the question if the observed difference is statistically significant or not.
The exact quantification of statistical significance might change across different domains and different A/B testing platforms but the core meaning of statistical significance remains the same across all statistics and all of experimentation.
Why does randomness create a need for statistical significance?
The only reason statistical significance is needed in experimentation is that the very metrics that we want to measure are not deterministic, but rather random. To better appreciate this link between randomness and statistical significance, I want to take you through another thought experiment that will help highlight the reason statistical significance is needed in experimentation.
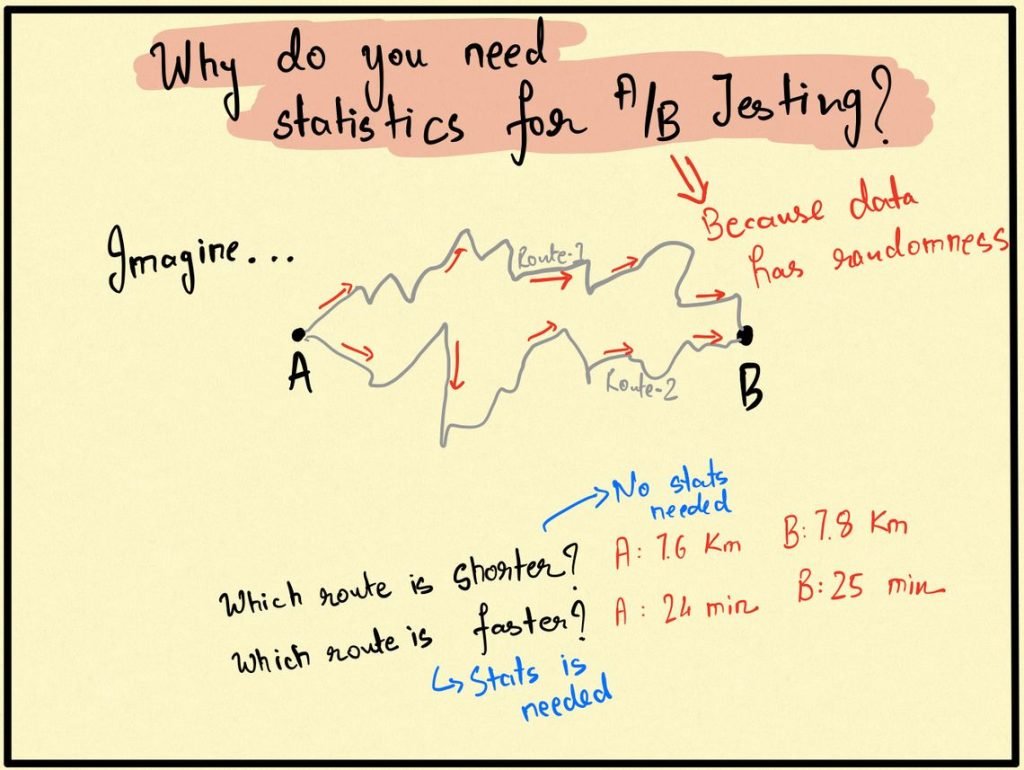
Suppose that a daily commuter wants to travel from point A to point B and there are two ways to go from A to B, say Route 1 and Route 2. Let us suppose that the commuter wants to answer the following question:
Which of Route 1 and Route 2 is shorter?
The question is extremely simple to answer as a modern commuter in the age of Google Maps would flip open his phone, enter the source and the destination, and see the exact length of Route 1 (say 7.6 km) and Route 2 (say 7.8 km). There is no doubt that Route 1 is shorter and given this information, no amount of statistics will ever be able to refute this conclusion. However, suppose that the commuter had asked a different question which would have made the answer to this question fairly difficult to answer in one go.
Which of Route 1 and Route 2 is faster?
The commuter flips open his phone and types in the source and destination in Google Maps only to find out that Route 1 takes 24 minutes whereas Route 2 takes 25 minutes. The answer is not really clear at this point because intuitively time is much more random than distance itself. It might be the case that there is more than expected traffic on Route 2 today which might not be there tomorrow. In light of the randomness of time, the commuter will be forced to ask if a difference of 1 minute is significant enough to conclude Route 1 is faster.
Statistics and statistical significance are hence required whenever you are trying to measure a metric that is fundamentally random in nature. Since most processes around us have some component of randomness in them, most experimenters are dealing with metrics that are random. Rarely does it happen that a metric has a fixed non-random value in which case you would not need to run an experiment.
Conclusion
Statistical significance might seem like a mathematical term but is essentially very intuitive to the human mind. Suppose you get a cough and take a syrup to soothe the throat. The human mind intuitively tries to judge if there is enough evidence that the syrup reduces coughing. If the impact is large, we are able to detect it and say confidently that the syrup worked. But if the impact is small, we take time to decide if the syrup really helped or not. What works in the background when we make such verdicts is our intuitive mental module of statistical significance. As it turns out, the mathematical workings of statistical significance are strongly aligned with our intuitions.
In the next post of this series, scraping further into the story, I will explain the three forces that drive statistical significance. The three forces are the effect-size, the standard deviation, and the sample size and they neatly align with intuition. They unfold in a way, that you realize that statistical significance is just a formal way of expressing something that our minds already understand. The journey afterward is a thrilling ride on the dirty tricks of nature that beats this fundamental intuition.