What are clickmaps?
Clickmaps are the visual representation of where visitors click on your website. Through click maps, you can see the number of clicks on various website elements like CTA buttons, images, text, URLs, and so on. Analyzing clickmaps will help you understand which are the most interacted parts of your website and which are often ignored by your visitors.
A clickmap is also a type of heatmap. The only difference is that heatmaps use color coding to understand different levels of user interactions with website elements, whereas clickmaps show the number of clicks on the same elements.
3 reasons why you must leverage clickmaps
Showing you real-time data, a clickmap is one of the most effective ways to analyze visitor behavior on your website. Given below are the top 3 benefits of using this analytics tool.
Identify best-performing website elements or areas
Simply keeping a record of where and what percentage of users are dropping off from your website will not help you fix the problem. You must do qualitative research at a granular level and understand user interaction with each website element in specific areas. Where you see the most clicks are the popular sections on your website. This will substantiate your optimization effort. Maybe you tested iteratively to get to where it is today.
Spot friction areas
Identifying low-performing areas on your website is equally important because this will tell you what’s not engaging or interesting to the users enough to click. For example, if you see fewer clicks on the primary CTA button on a page, you might want to hypothesize that moving its placement above the fold will help increase clicks on the element. This way, you can test and optimize to remove friction from your website.
Analyze from users’ perspective
When you see how users interact with website elements, you get into their shoes to understand what they like and what challenges they face in their user journey on your website. Based on these insights, you can optimize your website in a way it matches users’ mental model, help improve user experiences, and ultimately encourage them to convert.
What are some mistakes to avoid when using clickmaps?
To get the best result out of your clickmaps, you must implement the best practices and avoid making the following mistakes:
Choosing the wrong tool
There are scores of heatmap and clickmap tools today, which makes it difficult for marketers to choose the right tool for their needs. You must go for a tool that has been in the field for a long time and enjoys a good reputation in the industry. For example, VWO Insights can be a popular choice as it lets you capitalize not only on heatmaps but session recordings, on-page surveys, and form analytics for a comprehensive understanding of user behavior.
Wrong sample size and time
Don’t be focused on short-term results. You should let this exercise run for a certain period so that enough data is collected on an adequate number of visitors for it to be statistically significant. Also, if you are capturing clickmaps around the time of holidays or festivities, remember this will not represent users’ round-year behavioral pattern on your website.
Not pairing it with other tools
You should not see clickmaps as some isolated tool. Rather you should complement it with quantitative tools like Google Analytics and other qualitative tools like session recordings. If you see users drop off between the product page and the cart page on Google Analytics, you can come to clickmaps and see the elements users are not interacting with that are leading to drop-offs. Also, combining data from clickmaps with insights from session recordings where you watch users in action on your website can give you a better view of their problems.
How to make the most of VWO Heatmaps?
As already mentioned, VWO Heatmaps helps you understand how users interact with different elements on your website, what piques their interest, and what distracts them. Let’s look at some interesting features and the benefits of this tool:
Easy data collection
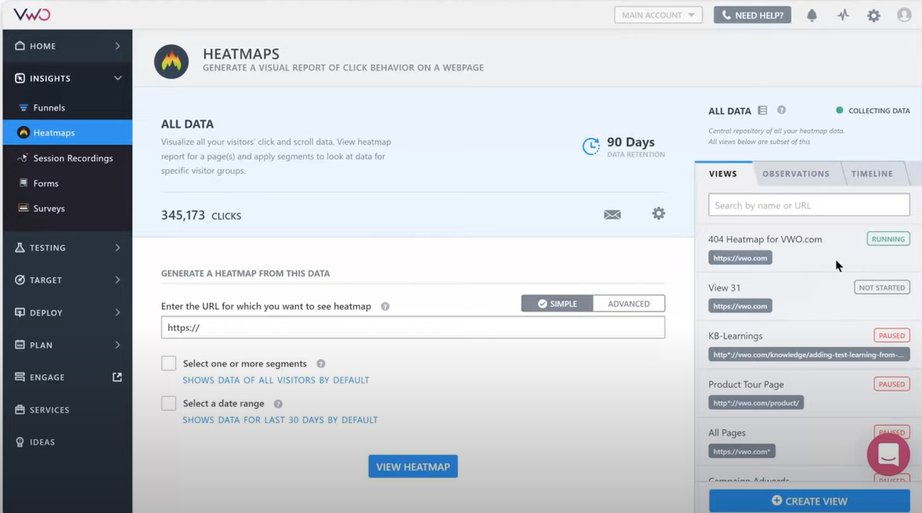
VWO gathers data from all pages that have VWO Smart Code from all sampled visitors. All you have to do is enter the URL for which you want to see the heatmap. The process is really simple and gets you started quickly.
User segmentation
You can also set a filter for a specific set of audiences. Suppose you want to see how your new visitors browse the website, you can select the new visitor segment and see only their data in heatmaps or clickmaps.
Switch between different types of heatmaps
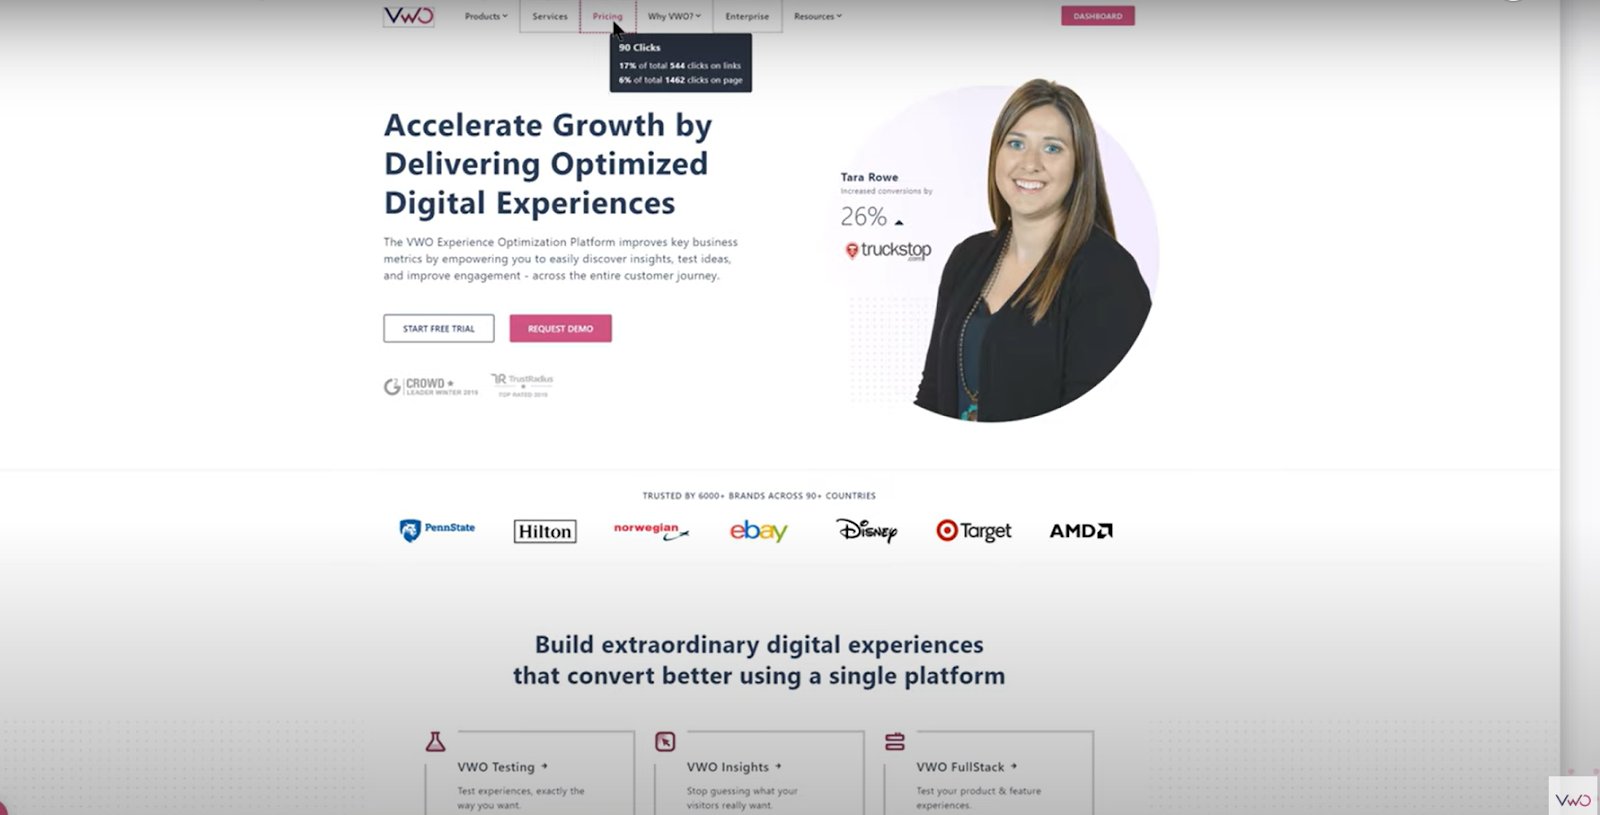
You can easily switch between heatmaps, clickmaps, and scrollmaps to see different visual representations of user behavior. Color codes don’t let you quantify user interaction with any elements. In that case, switch to clickmaps and see the total number of clicks on any particular area.
Compare clicks in two different areas
Select two different areas on your website to compare the total number of clicks on them. Let’s say you have two CTA buttons on your homepage, you can select both to see which gets the maximum clicks. Based on what you see, hypothesize if changing the CTA copy can help improve clicks on the low-performing button.
Element list
A tabular version of the heatmaps is also available in the form of an element list where you can also view the visitor data captured for every element on that particular page.
Heatmap and clickmaps success stories
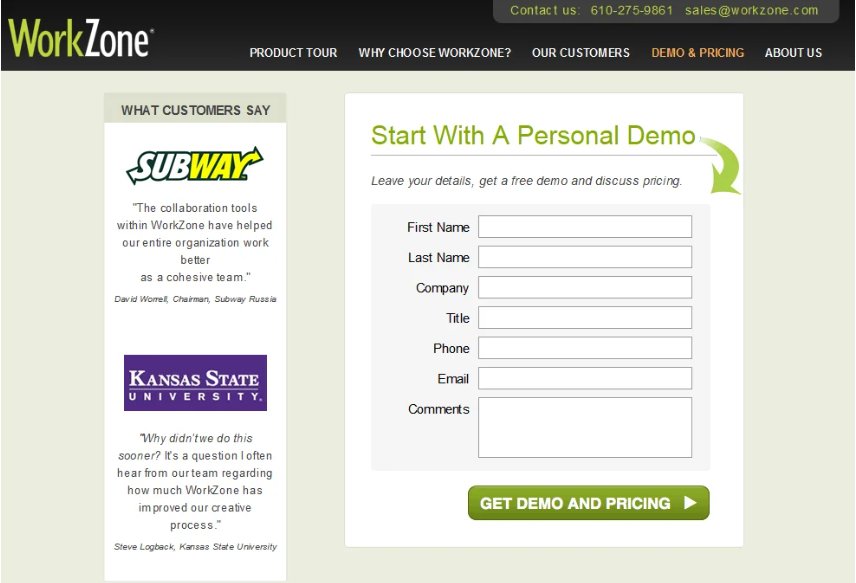
WorkZone increased form submission by 34%
Company: WorkZone is a US-based project management and document collaboration tool.
Objective: It was believed that colored logos of the clients in the testimonial section on the left distracted users from filling out the lead submission form. Further, heatmaps and clickmaps confirmed frequent mouse movement and clicking on the testimonial bar, which reinforced the belief that logos overshadowed the form.
The test: An A/B test was run where the logo colors were changed to black and white in the variation. The test was run for 22 days and the variation outperformed the control with a statistical significance of 99% and a 34% increase in form submission. Read the full case study to know what WorkZone learned from this result.
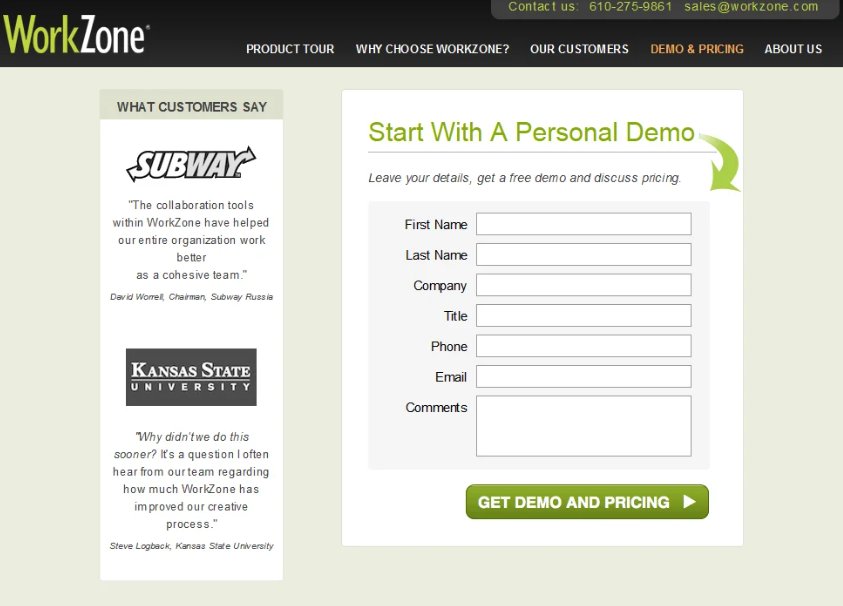
Variation – black and white logos
One Click saw a 10% increase in add-to-cart
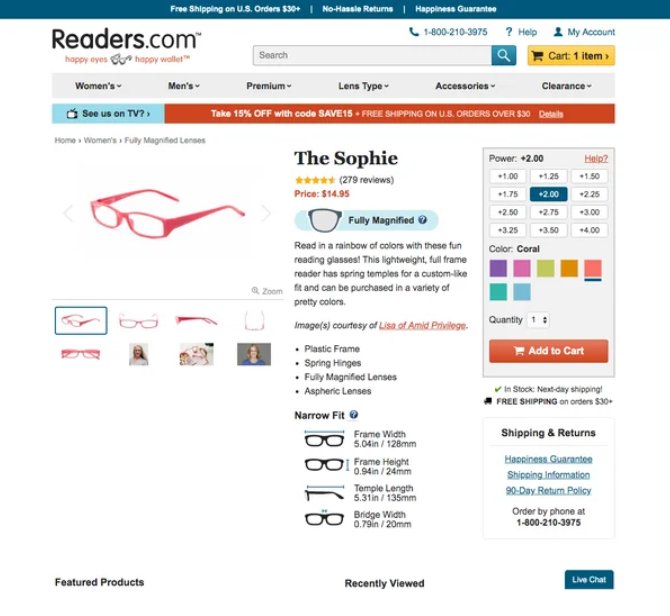
Company: The US-based One Click owns and operates three eyewear brands and one of them is Readers.com.
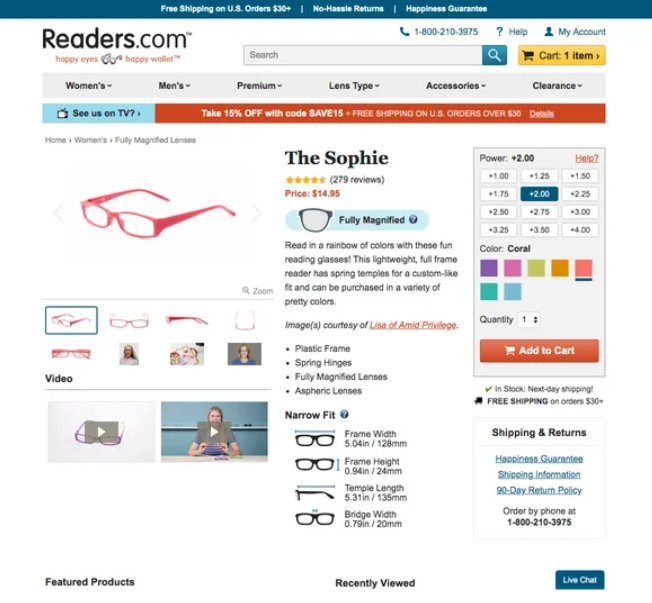
Objective: The team hypothesized that adding product videos could help strengthen decision-making among customers who were mostly hesitant about buying reading glasses online.
The test: In the variation, product videos were added that highlighted product values and had some in-house experts explaining the features. Heatmaps and clickmaps showed users engaged with product videos and found them valuable when making a purchase. This experiment showed a 10% increase in add-to-cart. Read an interesting geo-based messaging test run by One Click here.
The first step to delivering great user experiences is to understand user behavior on your website. VWO helps you do that and much more. Take a full-featured trial of VWO to explore its range of capabilities.


