What is a Type-II error?
Suppose a company wants to increase the number of adopters of the product they launched.
The company builds a hypothesis that offering a free trial may encourage users to try the product and evaluate it for their needs. To validate this hypothesis the company A/B tests the two strategies – giving a free trial and not giving a trial to its users. After running the experiment for a certain duration, the test declares a non-significant result. As the test doesn’t provide strong evidence for the proposed hypotheses, it gets rejected and the company decides to discontinue the free trial offer.
Now suppose that in reality the test results were wrong and offering free trials did increase the number of product users. Then the test has committed a False Negative or Type-II error. If an A/B or a Multivariate test declares a statistically non-significant result when in reality a difference exists in the performance of the variations being tested, then it is a Type-II error.
In scientific terms, during the hypothesis testing process when a test fails to reject the null hypothesis (representing no effect) when it’s false and should be rejected by the test then it is called a Type-I error or a False Negative. A null hypothesis is defined before the start of an A/B test or MVT which represents no difference between the variations being tested.
Why is it important to understand Type-II errors?
Every Type II error can be a missed opportunity to innovate and potentially could increase the number of conversions in the long run. A high number of Type II errors can lead to missing a lot of potentially good ideas which may have led to business growth.
Causes of Type-II errors
Type-II errors have an inverse relationship with the statistical power of a test. High statistical power will have low Type-II error. Statistical power is the probability of a hypothesis test of finding a statistical difference in conversion rate among variations if there is an effect to be found.
Statistical power and the minimum difference you care about together determine the sample size of a test. Higher statistical power and lower effect size can lead to a higher sample size which means a higher test duration.
A test gets underpowered if it is stopped early which can lead to a high number of type-II errors. This makes it difficult to detect true positives even in the presence of large effects.
In A/B or MVT tests, there is a tradeoff between statistical accuracy and the duration of the test. Depending upon the appropriate conversion rate difference strategically suitable for your business and statistical power you can determine the feasible sample size that can be collected for the test.
Graphical representation of Type-II errors
The following is the representation of a null hypothesis model and alternate hypothesis model.
- The Null model represents the probabilities of obtaining all possible results if the study were repeated with new samples and the null hypothesis was true in the population.
- The Alternate model represents the probabilities of obtaining all possible results if the study were repeated with new samples and the alternate hypothesis was true in the population.
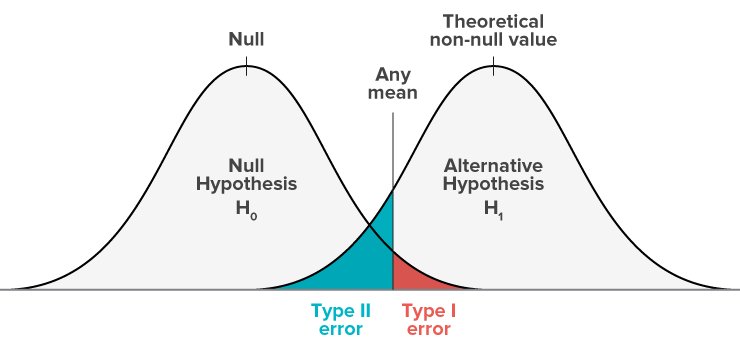
The shaded region is called the critical region. If your results fall in the blue critical region of this curve, they are considered statistically non-significant and the null hypothesis is not rejected. However, this is a false negative conclusion, because the null hypothesis is false in these cases and should be rejected.
The tradeoff between Type-1 and Type-II errors
The Type-I and Type-II error rates affect each other in statistics. Type-I errors depend on the significance level which affects the statistical power of a test. And the statistical power is inversely related to the Type-II error rate.
This means there lies a tradeoff between the Type-I and Type-II errors:
- A low significance level decreases Type-I error risk but increases Type-II error risk.
- A high-powered test can have a lower Type-II error risk but a high Type-I error risk.
Type-I and Type-II errors occur where the distributions of the two hypotheses overlap. The red shaded area represents alpha, the Type-I error rate, and the blue shaded area represents beta, the Type-II error rate.
Therefore, by setting the Type-I error rate, you indirectly influence the size of the Type-II error rate as well.
How to control Type-II error?
By increasing the statistical power of your test you can reduce the risk of making a Type-II error. The statistical power can be increased in the following ways-
- Increasing the sample size
With an increasing sample size the chances to detect the difference in a hypothesis test increases which eventually leads to the increased power of a test.
- Increasing the significance level threshold
Most statistical tests use 0.05 as a significance level threshold to determine a statistically significant result. By increasing the significance level you can increase the chances of rejecting the null hypothesis when it is true.
By increasing the probability of rejecting the null hypotheses you may decrease Type-II errors but also increase the chances of committing Type-1 errors. Therefore you need to assess the impact of both Type-1 and Type-II errors and accordingly set an appropriate significance level.
At VWO, we use Probability to be the Best (PBB) and Absolute Potential Loss (PL) as the decision-making metrics to determine a winning variation. The PBB metric captures the lead one variation has over the other competing variations. Keeping a higher PBB threshold can reduce the number of Type-II errors.
To understand more about how exactly VWO can help you bring down such errors, try out VWO’s free trial or request a demo by one of our optimization experts.


