Creating Better A/B Tests for eCommerce | Visitor Behavior Analysis Use Cases
According to a recent report, the total eCommerce sales in the U.S. soared from $60.6 billion in 2014 to $69.7 billion in 2015—the growth is almost 15%.
As an eCommerce business owner, you would agree that these numbers are promising. However, where on one hand there is tremendous growth in sales, on the other, there are an increasing number of challenges.
With growing number of market players competing to win the largest chunk of eCommerce sales, the fundamental challenge for them is to reduce Customer Acquisition Cost (CAC) and increase Customer Lifetime Value (LTV).
Download Free: Visitor Behaviour Analysis Guide
According to the 2015 Benchmark report series on eCommerce buyer behavior, the cost of acquiring new visitors through channels such as PPC, social media, and search engines is rapidly surging. The best way for eCommerce marketers to deal with that is by converting more of their existing visitors into customers. They should create a seamless and friction-free experience for their visitors, not only making more visitors convert into customers but also retaining the existing customers.
Creating such an experience requires eCommerce businesses to understand how their visitors behave — what exactly are users looking for, what are their pain points, and what makes them buy.
Understanding User Behavior with Visitor Behavior Analysis Tools
While website analytics tools such as Google Analytics tell who your users are and what they are doing on your website, visitor behavior analysis tools such as Heatmaps, Visitor Recordings and Form Analysis help analyze all interactions users have with specific pages.
For example, from Google Analytics you might get to know that a user bounced off from the product page, but Visitor Recordings will show you the exact drop-off point from the page, i.e., product menu, search bar, etc. In the process of uncovering ‘how users behave,’ these tools dig out the pain points that users face while browsing, searching, or paying.
Understanding user pain points can help eCommerce businesses provide a user-friendly experience, which can ultimately lead to more conversions.
More often than not, eCommerce marketers try to address the website usability issue by running random A/B tests. Only a few smart ones have realized the power of visitor behavior analysis.
The post walks you through multiple use cases of visitor behavior analysis tools, spun out of eCommerce A/B testing case studies. It will help you understand how those tools help in creating smarter, data-backed hypotheses for A/B tests quickly.
Use Cases for Heatmaps
Use Case 1
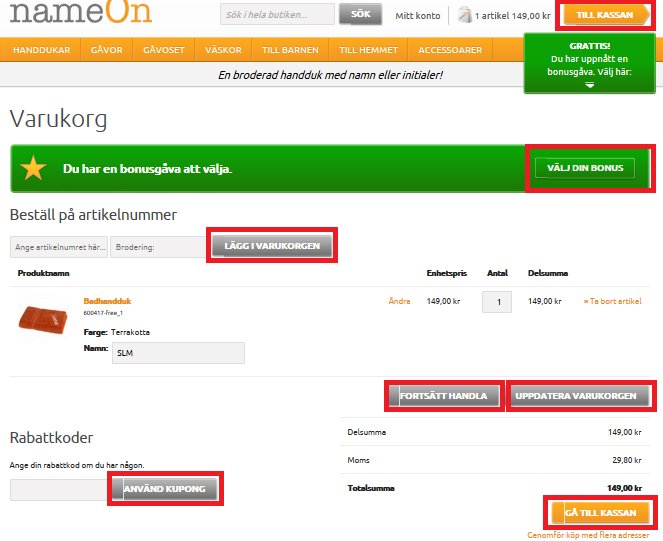
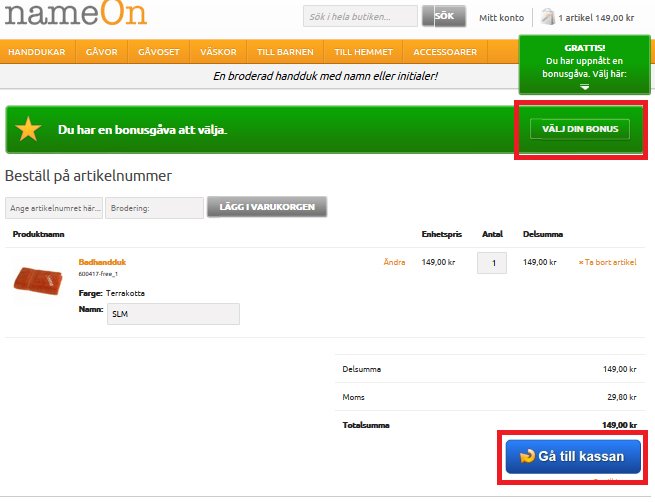
Company: nameOn (Scandinavia’s leading supplier of personalized gifts with embroidery)
Objective: Increase conversions from the “add-to-cart page” to the “checkout page.”
Hypothesis for A/B test: On observing a 31.7% drop-off rate between the add-to-cart page and checkout page, nameOn thought that reducing the number of CTAs on the page will reduce distractions for visitors, and allow them to focus on the “continue to checkout” button.
The Test: On reviewing the add-to-cart page, nameOn noticed that it contained too many CTAs. Because nameOn wanted visitors to focus only on “continue to checkout,” the decision was made to retain only two CTAs — “continue to checkout” and “welcome bonus.” The test was run for 44 days for 621 visitors. You can read the entire success story here. Images of control and variation are given below:
Running an Analysis with Heatmaps
With the help of Heatmaps, nameOn could have studied the number of clicks that each CTA on the page receives. With actual user insights derived from the analysis of Heatmaps and Clickmap (a type of Heatmaps), nameOn could have done the following:
- Study which areas on the page get the most attention.
- Discover which CTAs/hyperlinks on the page get the most/least clicks.
For example, nameOn could have studied clicks on all CTAs and only removed the ones that were considerably cannibalizing the primary CTAs.
Use Case 2
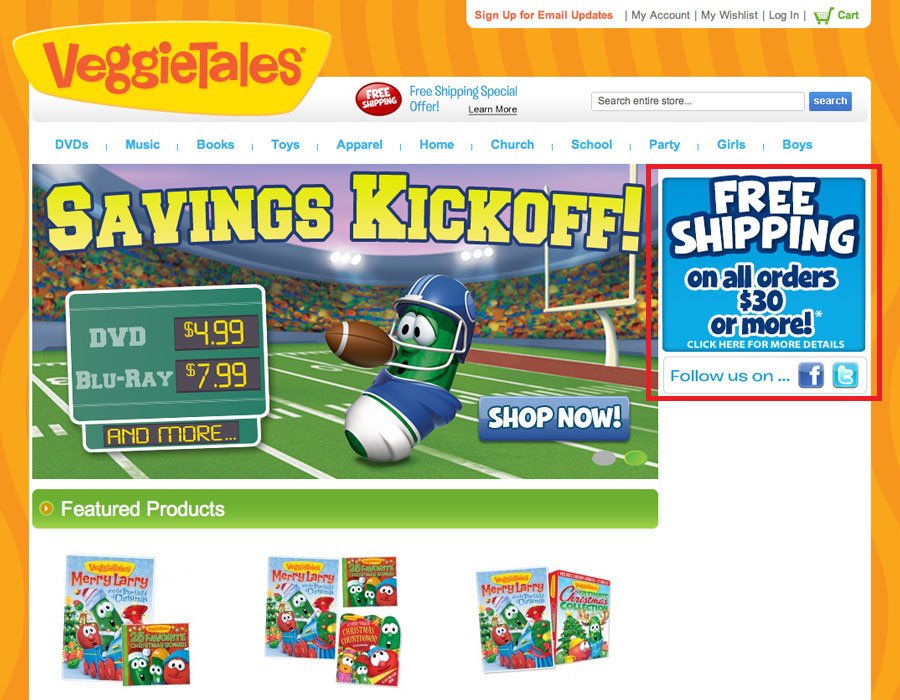
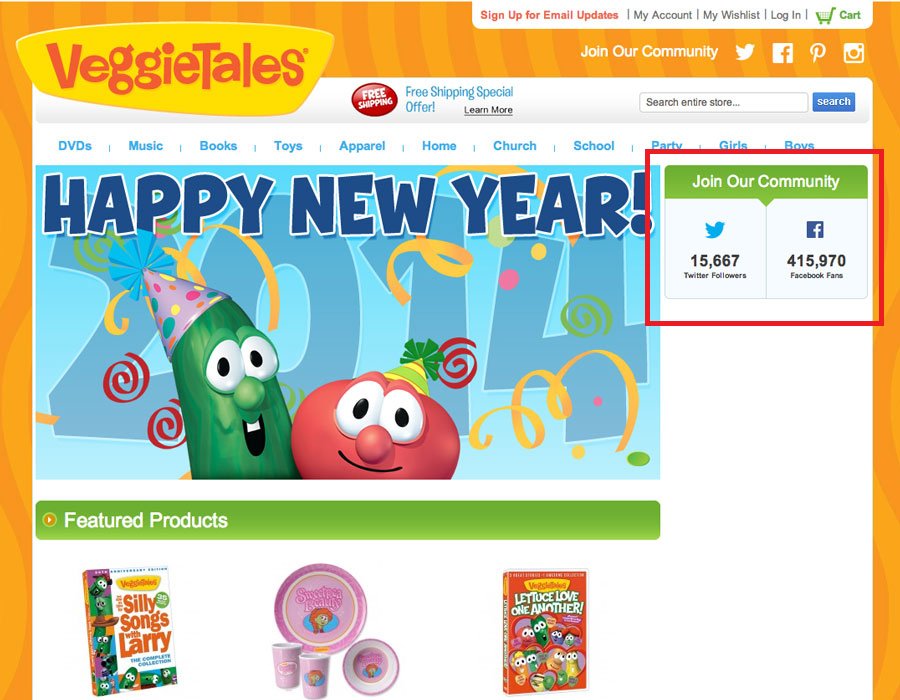
Company: Veggietales.com (eCommerce site for VeggieTales, a TV series for children)
Objective: To make people aware of the immense size of their followers on social media.
Hypothesis: The free shipping CTA overshadowed the social icons on the homepage. Increasing the size of the social icons and featuring the large follower count will act as a social proof, and increase the trust visitors have with the brand.
The Test: The control version of the homepage displayed a huge CTA for free shipping with social sharing buttons right below. Based on the hypothesis, VeggieTales replaced the free-shipping CTA with social sharing buttons along with the number of followers that VeggieTales had on Twitter and Facebook.
Images of control and variation are given below:
Running an Analysis with Heatmaps
VeggieTales could have studied the number of clicks on the free-shipping CTA on the header as well as the free-shipping CTA on the control page, using a Clickmap analysis.
Next, they could have decided whether doing away entirely with the free shipping CTA makes sense, or would it be wiser to simply shift the text below on the homepage. This way, they could have worked out another version that could get them more social engagement as well as retain the conversions that might have been lost because of completely removing the free shipping text on the right.
Use Case 3
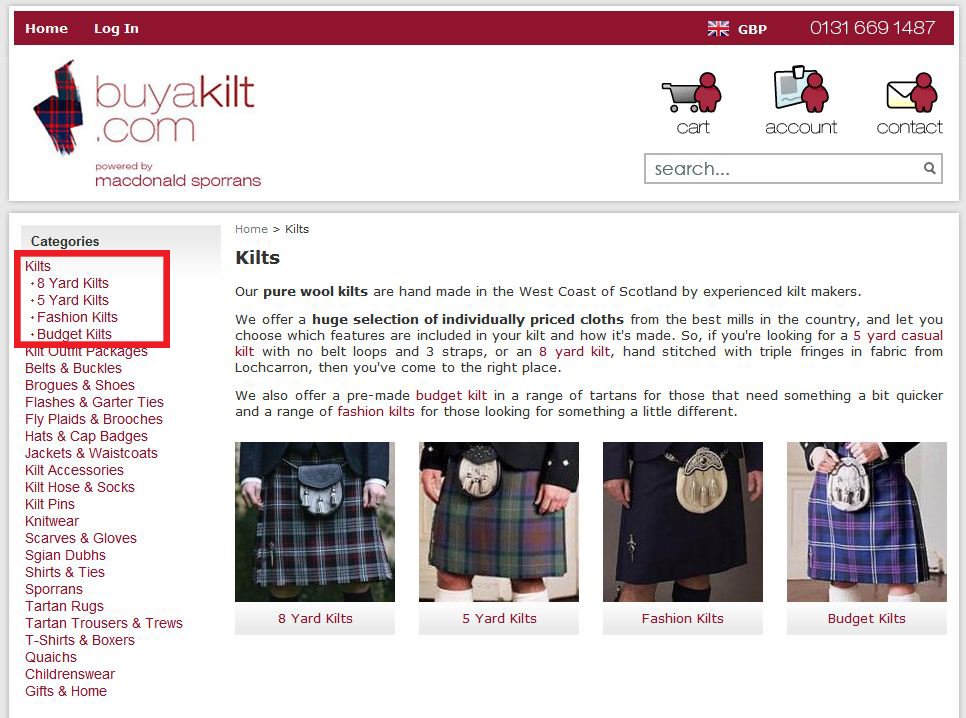
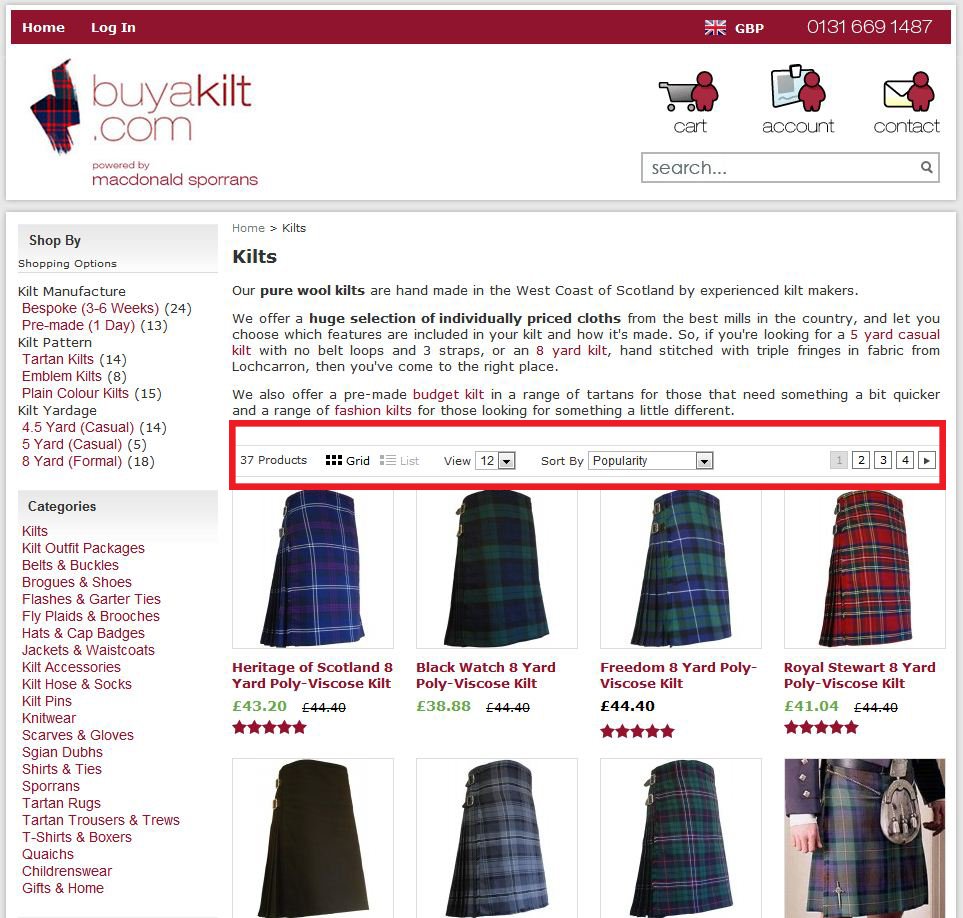
Company: Buyakilt.com (an online kilt and Scottish highland dress retailer)
Objective: To improve click-throughs and engagement on the product category page.
Hypothesis: Adding a product filter on the page would increase conversions.
The Test: Buyakilt.com has a number of category pages that further have four sub-category pages. They added a product filter that gave visitors an option to shop by different kilt types, kilt patterns, etc.
Images of control and variation are given below:
Running an Analysis with Heatmaps
In this case, apart from adding a product filter for simplifying the search process, Buyakilt could have used element list analysis (explained below) to study the number of clicks on each element under the categories.
An element list analysis is a type of Clickmap analysis which gives the actual number of clicks on both visible as well as hidden elements in a list (e.g., a drop-down list). This data can be further used for optimizing the category menu. For example, elements that receive maximum clicks can be placed on the top of the list, and those with lesser clicks can be placed lower on the list.
Use Cases for Visitor Recordings
Use Case 1
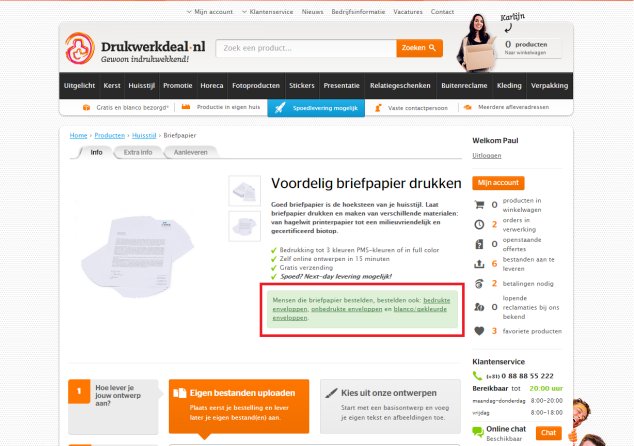
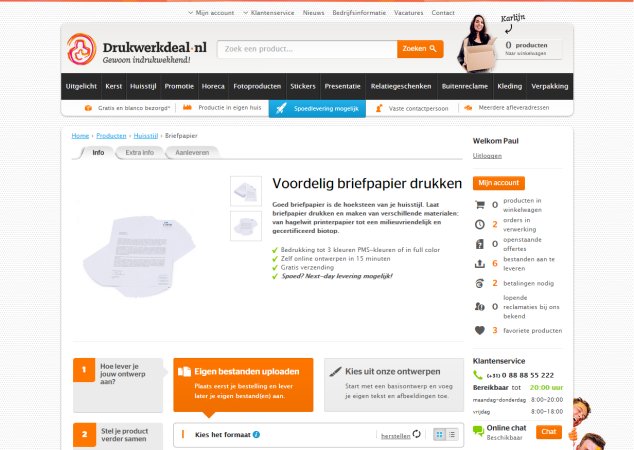
Company: Drukwerkdeal (an online printing shop based out of the Netherlands)
Objective: To push more checkout actions from the product pages.
Hypothesis: Drukwerkdeal hypothesized that the cross-sell messages were doing more harm than good. Upon reviewing a number of its product pages, Drukwerkdeal realized that their cross-selling messages were not very convincing.
The Test: Drukwerkdeal decided to remove these messages from some of the page categories and test if this would have any impact on the sales. 14,000 visitors participated in this test that was run for two weeks. Read the entire success story here. Images of control and variation are given below:
Running a Visitor Recording Analysis
Although upsell and cross-sell help boost eCommerce conversions, at times these strategies might backfire. Using Visitor Recordings, businesses can find out whether their upsell or cross-sell campaigns are getting them the desired results, or are proving to be a distraction. These recordings give accurate data about users’ entire journey on a website — where exactly they dropped-off, where they spent maximum time, from which point on a page they bounced off, etc. Based on this data, website owners can tailor an improved experience for users.
Here’s an example of Visitor Recordings:
In Drukwerkdeal’s case, before removing the cross-sell messages from the product page, they could first analyze how people interact with the product pages. Using Visitor Recordings, they could have played back the entire session of visitors who interacted with the product page. They could then validate whether users who clicked on a link in the cross-sell message returned to the original product page or not. It could then be established whether actually the cross-sell messages were proving to be a distraction on the product page.
Use Case 2
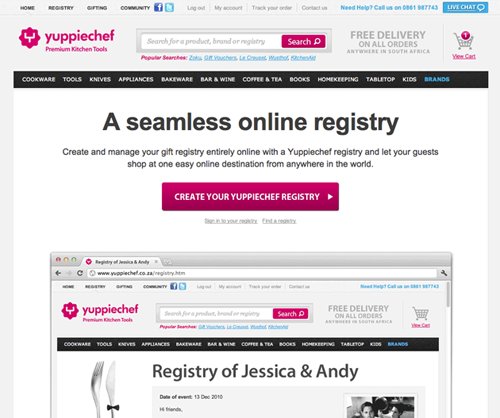
Company: Yuppiechef (a leading online store selling premium kitchen tools)
Objective/Conversion Goal: Increase the rate of wedding registry signups on one of their landing pages.
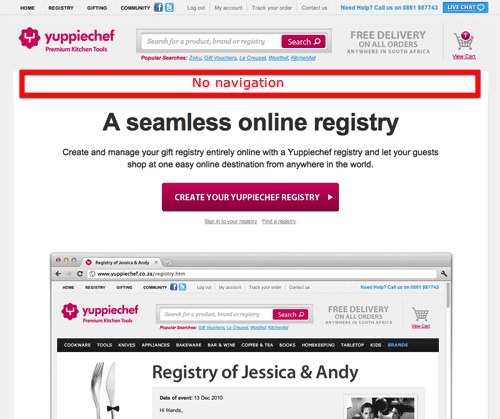
Hypothesis: Removing navigation menu would increase the rate of wedding registry signups.
The Test: Yuppiechef created a variation of their landing page without a navigation bar and tested it against the control.
Here’s how the control and variation for Yuppiechef looked like:
Running a Visitor Recording Analysis
By playing back the Visitor Recordings of users who visited the landing page, Yuppiechef would be able to playback the individual recordings of those visitors who browsed and clicked on the navigation menu but did not register.
They could also playback recordings of those who clicked on an item in the navigation bar but returned to register. Studying different kinds of interactions by different users, Yuppiechef could have used this research to validate that the navigation bar was serving as a distraction on the website.
Download Free: Visitor Behaviour Analysis Guide
Use Case 3
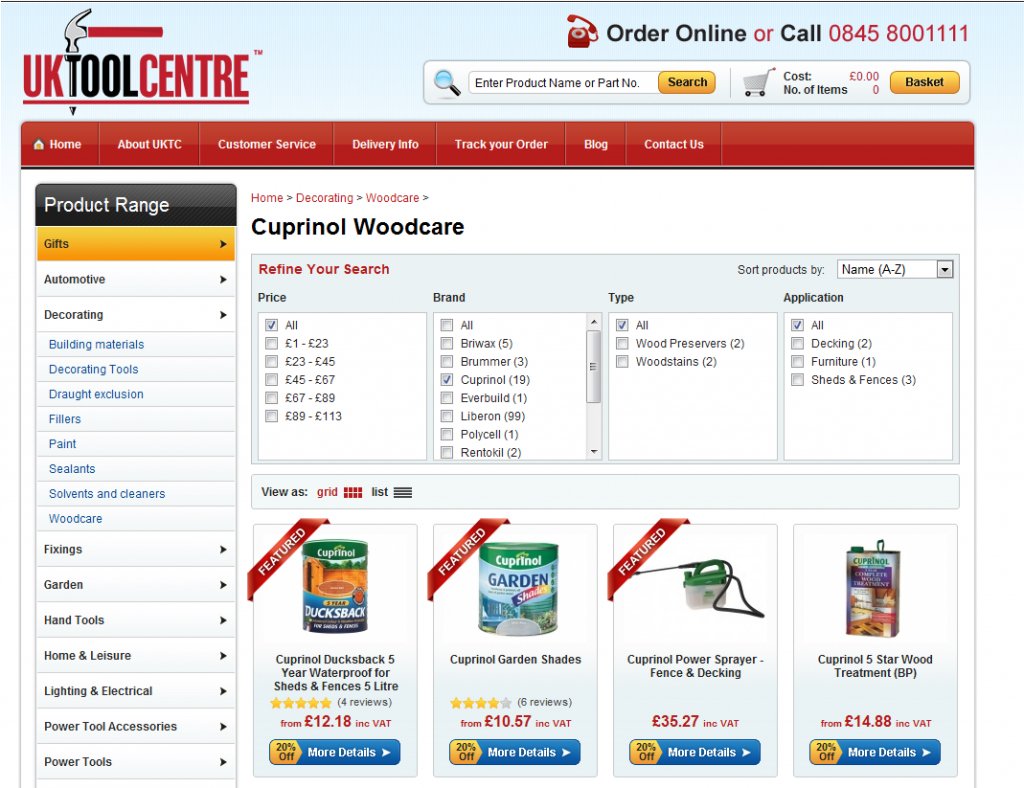
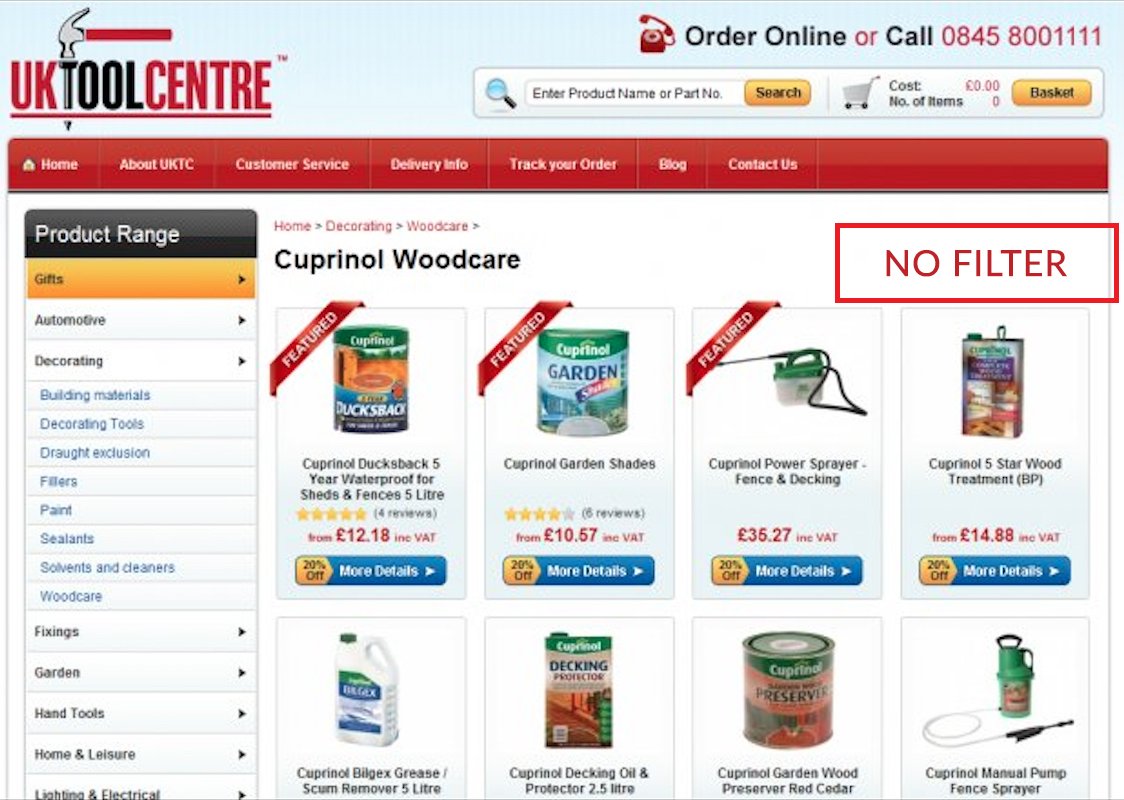
Company: UKToolCenter (an online store that offers tools & products for trade professionals and DIY experts)
Objective: To increase user engagement on a specific category of products on the website.
Hypothesis: By removing the filtering option on a product search, users will convert more.
The Test: UKToolCenter hypothesized that the filter menu was unnecessarily adding extra options for the users, and removing it could help increase engagement for a specific product category page (Cuprinol, a brand of woodcare products). They created a variation in which the product filter for Cuprinol products was removed. You can read the entire success story here. Take a look at their control and variation page:
Running a Visitor Recording Analysis
While removing the filter from that specific product category increased user engagement on that product page by 27%, we have another success story where adding a product filter led to an increase in conversions.
Using Visitor Recordings, UKToolCenter could have studied user engagement on the product filter for Cuprinol. By playing back Visitor Recordings they could have identified visitors dropping-off from the Cupinol category page. By playing individual recordings, they could have validated whether the filter on the page was causing visitors to drop-off without browsing Cuprinol products at all.
Use Case for Form Analysis
Use Case 1
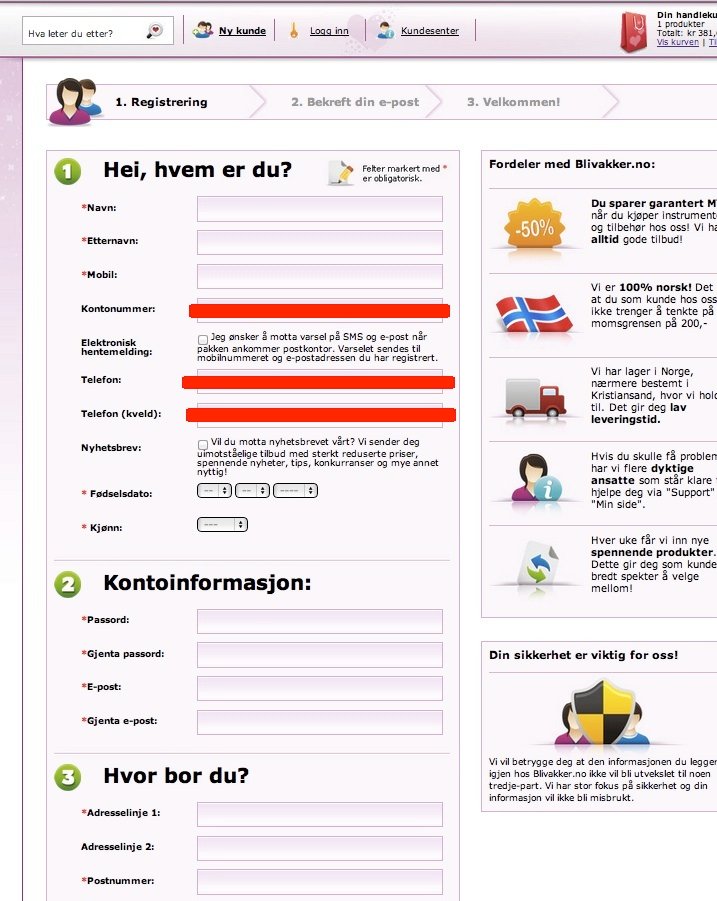
Company: Blivakker.no (Norway’s leading online beauty shop)
Objective: To increase form conversions on the registration form.
Hypothesis: Reducing number of form fields will increase conversions.
The Test: The original registration form on Blivakker.no consisted of 17 form fields. The company wanted to test if making a small change in the form would increase conversions on the form. Three form fields — phone number, account number and phone number (evening) — were removed from the web form. Another variation that was tested was a completely stripped down form with fewer fields and less navigational elements. You can read the entire success story here.
Running a Form Analysis
While the test showed that removing unnecessary fields from the form increased the number of registrations, using Form Analysis could have shown the actual fields on the form where users dropped off or hesitated to fill in the information. Here’s a screenshot from VWO’s Form Analysis feature:

Rather than relying on expert opinions, which can only be contextually right, using Form Analysis could have helped Blivakker.no to remove the fields that created most confusion and retain all the other ones, aiming to fetch more conversions and valuable user information, at the same time.
To Wrap Up
eCommerce businesses cannot rely on A/B testing random ideas for improving conversions. The need of the hour is to understand what their users are really looking for and what pain-points they’re facing.
Any eCommerce business that is able to identify what appeals or repels its users has an edge above its competitors. Using actual user behavior data, businesses can create smoother, friction-free experience for their users, and ultimately push overall conversions higher.
Check out this exciting conversation we had on the VWO Podcast with Stuart Scott from Mammoth Growth. Here, he shares effective best practices to run better A/B tests along with some practical strategies to improve conversion rates.
Let us know what you think about visitor behavior analysis tools. Post your comments below.
Categories: