How to Create A Heatmap in Excel? – Make or Generate Excel Heatmaps in 4 Simple Steps
Analysts use heatmaps to analyze the magnitude of an event using visual cues. A data visualization technique, heatmaps are utilized to derive quick interpretations of the intensity of an event and do course corrections accordingly.
Table of Contents
Download Free: Website Heatmap Guide
One of the examples of heatmaps can be the visual representation of COVID-19 cases being registered globally. The following map shows the geographic distribution of the cumulative number of COVID-19 cases reported per 100,000 people worldwide. Darker shades of orange denote the most affected countries, and the light yellow hues indicate the opposite.
![How to Create A Heatmap in Excel (Image 01) - Geographic Heatmap in excel [COVID-19 cases]](https://static.wingify.com/gcp/uploads/sites/3/2020/04/Global-COVID-19-heatmap.png)
There are quite a few efficient ways to generate a heatmap, such as using readily available free heatmap generators like VWO’s AI-powered heatmap generator or integrated analytical tools. Microsoft Excel or Google Sheets is another great option to explore. Let’s dive right in!
Learn How To Create a Heatmap in Excel
When using Excel or Google Sheets, you can either create a heatmap by manually coloring each cell depending on its value or act smartly and enter a formula/function to do all the taxing work for you. We’d suggest you use the latter method to create a heatmap.
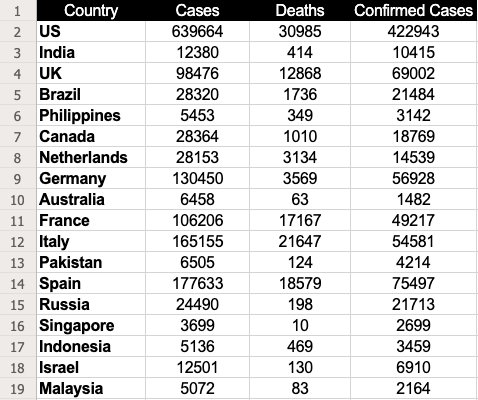
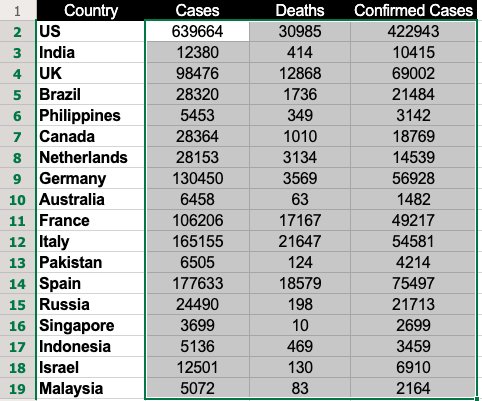
Let’s consider the dataset extracted from the above represented COVID-19 globally registered cases as an example to learn how to create a heatmap using the function—apply “Conditional Formatting.”
| Country | Cases | Deaths | Confirmed Cases |
| US | 639664 | 30985 | 422943 |
| India | 12380 | 414 | 10415 |
| UK | 98476 | 12868 | 69002 |
| Brazil | 28320 | 1736 | 21484 |
| Philippines | 5453 | 349 | 3142 |
| Canada | 28364 | 1010 | 18769 |
| Netherlands | 28153 | 3134 | 14539 |
| Germany | 130450 | 3569 | 56928 |
| Australia | 6458 | 63 | 1482 |
| France | 106206 | 17167 | 49217 |
| Italy | 165155 | 21647 | 54581 |
| Pakistan | 6505 | 124 | 4214 |
| Spain | 177633 | 18579 | 75497 |
| Russia | 24490 | 198 | 21713 |
| Singapore | 3699 | 10 | 2699 |
| Indonesia | 5136 | 469 | 3459 |
| Israel | 12501 | 130 | 6910 |
| Malaysia | 5072 | 83 | 2164 |
Image source: European Centre for Disease Prevention and Control
Step 1: Enter the data
Enter the necessary data in a new sheet. We entered the data above.
Step 2: Select the data
Select the dataset for which you want to generate a heatmap. In this case, it would be B2 through D19.
Download Free: Website Heatmap Guide
Step 3: Use conditional formatting
If you are using Excel, go to “Home,” click on “Conditional Formatting,” and select “Color Scales.” The color scale offers quite a few options for you to choose from to highlight the data.
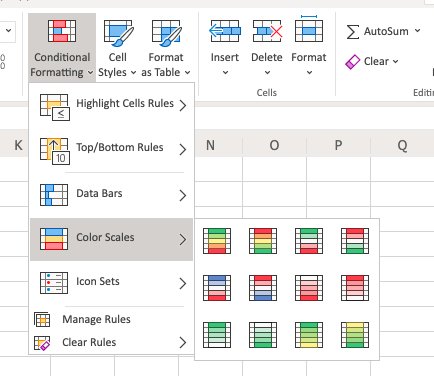
In our case, we’ve used the first option where cells with high values are colored in green and ones with low values in red.
If you are using Google Sheets, you will find “Conditional Formatting” under the “Format” option in the menu bar.
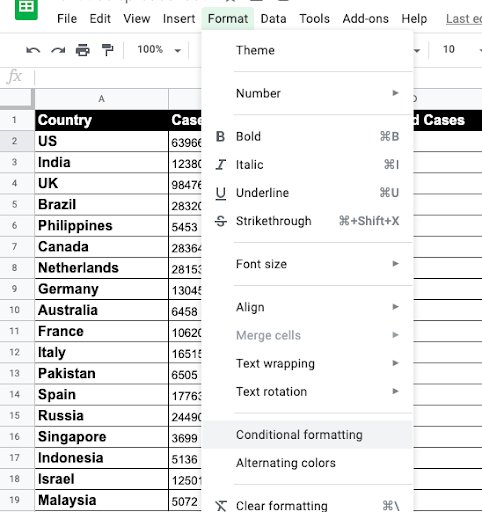
Then select “Color Scale” and choose the relevant colors for the midpoint, minpoint, and maxpoint.
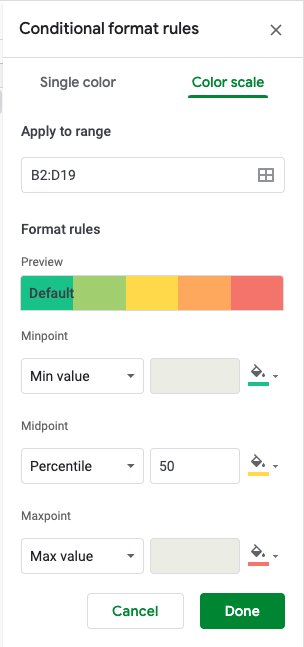
Note: Use a color scheme that best matches your data interpretation needs.
Step 4: Select the color scale
Once you select a color scale, you’ll see a heatmap as shown below:
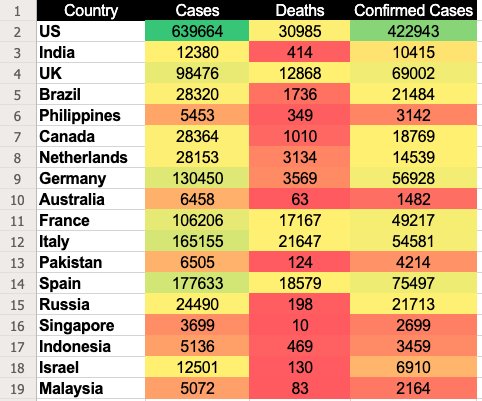
In this color scale, Google Sheets assign a green color to the cells with the highest values and red to the ones with the lowest values. Meanwhile, the remaining values are assigned colors based on the descending value order showing a gradient of shades falling between green and red. And there you have it: your beautiful heatmap to analyze visitor experience and get more conversions.
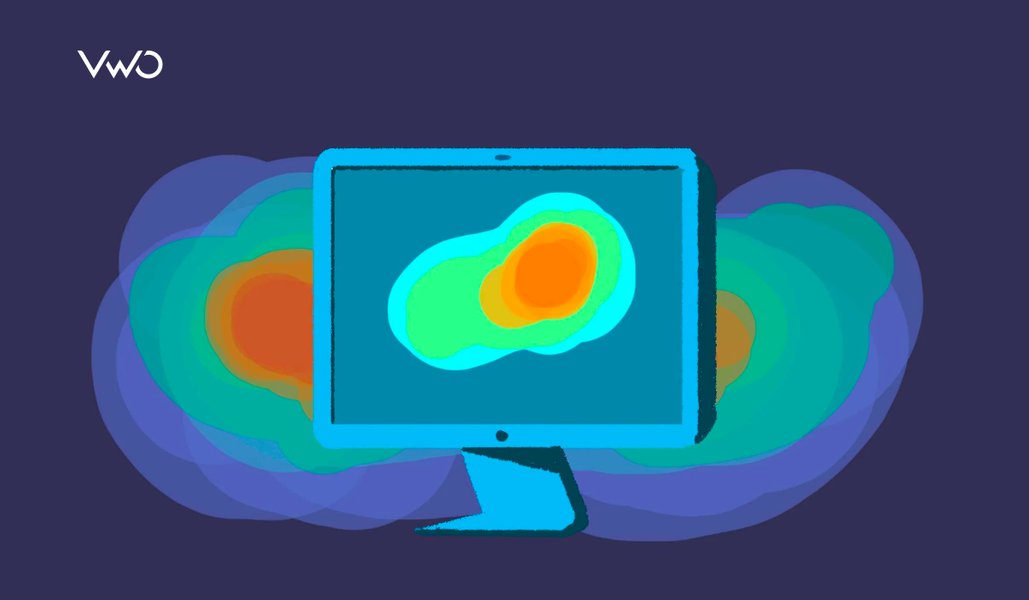
While this was just one of the ways to generate a heatmap using Excel or Google Sheets, you can get as creative as you want to. It also gives you the leverage to drill down and create mapping views of specific data sets as well. However, if you’re planning to create heatmaps to study the performance of your website or particular pages, we’d recommend you to use more robust and integrated tools than Excel, such as VWO heatmaps. They not only help you see how visitors engage with your website but also highlight web elements that catch their attention or distract them.
Watch the video to get an overview of VWO Heatmaps:
VWO’s free AI-powered heatmap generator allows you to predict how visitors interact with your web page. It enables you to gauge bottlenecks based on user experience for you to take required optimization measures. You can follow your visitors’ trails on your web pages and analyze granularly how they interact with each static or dynamic element.
To know more about how you can leverage VWO heatmaps to visualize visitor behavior and draw valuable insights, sign up for a free demo session from one of VWO’s optimization experts or opt-in for a free trial to give it a spin yourself and assess whether it meets your unique requirements.

Categories: